Digital holographic interferometry
by using long wave infrared radiation (CO
2laser)
Igor Alexeenko
1,a, Jean-François Vandenrijt
2,b, Marc Georges
2,c,
Giancarlo Pedrini
1,d, Thizy Cédric
2,e, Wolfgang Osten
1,f, Birgit Vollheim
3,g1
Institut für Technische Optik, Pfaffenwaldring 9, Stuttgart, 70569, Gemany
2
Centre Spatial de Liège,Avenue du Pré Aily, B-4031 Angleur (Liège), Belgium
3
InfraTec GmbH, Gostritzer Str. 61-63, Dresden, 01217, Germany
a
[email protected], [email protected], [email protected],
d
[email protected], [email protected],
f
[email protected], [email protected]
Keywords: holography, digital holographic interferometry, non-destructive testing.
Abstract. We show how digital holographic interferometry in the Long Wave InfraRed spectral range (LWIR) can be used for the investigation of mechanical structures. The 10.6 µm radiation is produced by a CO2 Laser. Experimental results showing that the method can be used to locate
defects in a panel are presented and advantages and disadvantages of this approach are discussed. Introduction
Digital holographic interferometry is commonly used for non-destructive testing of mechanical structures and dynamical stress analysis (e.g., vibrations, non stationary dynamical processes). The technique is based on the comparison of wave fronts recorded at different instants of time [1] where the recordings correspond to the deformation states of the investigated object. The result of the wave fronts comparison is the calculated phase difference containing the information about the object deformation.
In the early years of holography, the holograms were recorded by using photographic plates or films only, but the CCD, CMOS and other detectors (having sensitivity in the visible, ultraviolet and infrared spectral range) developed during the past 20 years, allowed the electronic digital recording and processing and thus a dramatic speed-up of the measurements and information retrieval.
Long wave radiation in the infrared spectral range (LWIR) may be used in order to decrease the sensitivity of the holographic method. Some investigations about this subject have been already published [2-6]. We developed digital holographic interferometry at 10.6 µm for diffuse reflecting objects, the sensitivity is 20 times lower compared with methods using visible light and thus allows the recording of large deformations as they usually occur in aeronautical structures.
Infrared digital detectors can be used for the registration of holograms. Two types of such detectors are commercially available. One type uses an uncooled microbolometer array, the other is based on IR photodiode technology and is cooled down with a cryogenic system, this last detector has higher sensitivity and speed compared with the bolometers but it is more expensive.
The digital holographic interferometry can be used only if a speckle field is scattered by the object surface and this appears when the roughness reaches the magnitude of the used wavelength [7]. Since aeronautical structures have a roughness of approximately 10 micrometers, they can be easily investigated by using LWIR digital holographic interferometry [8].
All rights reserved. No part of contents of this paper may be reproduced or transmitted in any form or by any means without the written permission of the publisher: Trans Tech Publications Ltd, Switzerland, www.ttp.net. (ID: 81.242.199.80-20/08/10,11:54:44)
Industrial applications usually require the measurement of large scale objects. Consequently CO2
lasers are well suited for this purpose since they may produce radiation having power up to kW and thus allow the investigation of surfaces having size of some m².
Set-up
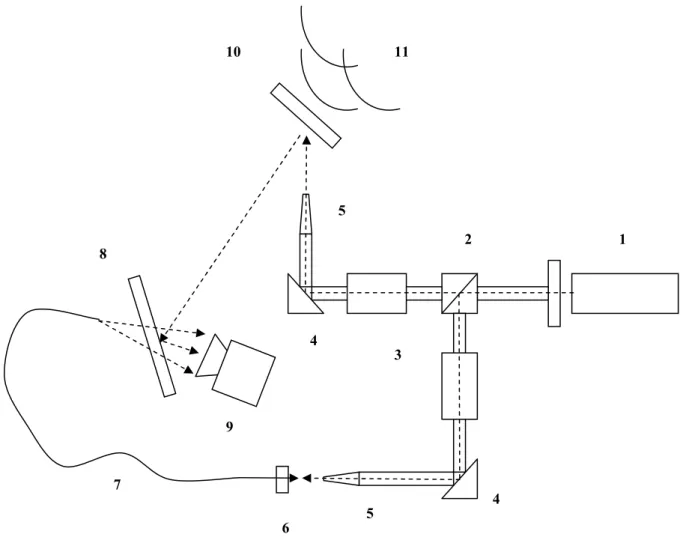
Figure 1 shows the set-up to record the image plane holograms [9] by using a CO2 laser with
wavelength 10.6 µm and coherence length 1-1.5 m and an uncooled microbolometer infrared camera (VarioCam-hr) manufactured by InfraTec. The Focal Plane Array (FPA) detector has 640x480 pixels (physical dimension of each pixel is 25x25 µm²), its dynamical range is 16 bit and the frame rate is 50 Hz. The imaging system is composed by a Germanium objective with 50 mm focal length. The basic parts of the interferometer have been isolated inside a beam delivery system in order to avoid that unwanted reflections from the surrounding environment hit the detector which is very sensitive and could be destroyed irreversibly by the CO2 laser radiation. Attenuators were
used to reduce the output intensity for the illumination and reference beams. Finally the reference beam was delivered by using a flexible hollow silica fiber with core diameter 300 µm. The use of a fiber together with the beam delivery system makes the laboratory unit compact, flexible and reliable. The investigated object (part of an aircraft) was a carbon composite 25x25 cm plate with a delamination defect. The loading system was an infrared lamp located at the back side of the object that increases the temperature of the sample and produces its deformation.
If we denote with R(x,y) and U(x,y) the reference and the object waves, then the intensity recorded on the sensor is:
I
(
x,y)
= RH(
x,y)
+UH(
x,y)
+R*H(
x,y)
UH(
x,y)
+U*H(
x,y)
RH(
x,y)
2 2
, (1) where the subscript H indicates the sensor plane and * denotes a complex conjugation. The third
term contains the information about amplitude and phase of the object wavefront and the determination of the phase change allow us to calculate the deformation of the object as a function of the time. If we consider two states, the phase difference ∆φ depends on the sensitivity vector s
and the object deformation d:
λ π
∆ϕ= 2 d·s , (2)
s= k1-k2 is determined by the geometry of the set-up where k1 and k2 are the unit vectors of
illumination and observation respectively. Wave length and sensitivity vector determine the sensitivity of holographic set-up.
Two arrangements have been developed, in the first one a tilted reference wave (off-axis set-up) has been used, the second is an in-line configuration where a phase shifting of the reference is applied. When we use the off-axis configuration we are restricted by the spatial resolution of the detector and for recording the hologram the maximal spatial frequency should satisfy the condition fmax < 1/(2∆)
where ∆ is the camera pixel size. If θmax is the maximal angle between reference and object beam we
get: ∆ ≤ ≈ = 2 1 max 2 max sin 2 max λ θ θ λ f (3)
The spatial frequency of the object beam has to be restricted by an aperture in order to satisfy this condition, then by taking the Fourier Transform of the intensity (Eq. 1) it is possible to select the third term. Its inverse Fourier transformation restores the complex amplitude of the object wave, thus the phase can be calculated as:
(
)
(
)
= ) x,y U Re( ) x,y U Im( arctan H Hϕ
(4)Fig. 1: Experimental set-up: 1. CO2 Laser, 2. Beam splitter, 3. Intensity attenuators, 4. 45° Mirrors, 5. Output nozzles, 6. Piezo with fiber, 7. Hollow fiber, 8. Beam combiner, 9. IR camera,10. Object, 11. Thermal loading (2,3,4,5 are included in a closed compact beam delivery system)
For the in-line configuration, the calculation of the phase is done by using the four steps algorithm: , (5) where i=0, 1, 2, 3, I0, I1, I2, I3 are intensities recorded with phase shifted reference: 0°, 90°, 180° and 270° respectively. IR and IU are the intensities of reference and object beams. The phase is given
by [10]: − − = 2 0 1 3 I I I I arctan
ϕ
, (6)For the four steps algorithm the phase shifting of the reference beam was carried out by shifting a fiber mounted on a piezo stage. During the acquisition of the interferograms the trigger regime of the camera has been used. The system was full automated by using LabView software and NI data acquisition boards (DAQ). The phase difference calculation was implemented as post processing module in the main program.
)
/
i
cos(
U
I
R
I
U
I
R
I
i
I
=
+
+
2
φ
+
π
2
3 2 1 6 7 10 11 8 9 4 4 5 5Experimental results of digital holographic interferometry in LWIR
The object was illuminated by CO2 laser radiation (power 300 mW). The interference between the speckled radiation field reflected by the object and the reference was registered by the FPA. We measured the roughness (RMS) of the object with the white light interferometer (Zygo New View 6300) and found that the roughness parameter RQ was about 12 µm. This is approximately the magnitude of the wavelength and produces fully developed speckle which are ideal for the successful investigation of object deformations.
At first we used the Fourier transform method to calculate the phase difference due to the thermal loading on the object. The advantage of this method is that in one single hologram we have the information necessary for calculating the phase of the wavefront, it is thus well suited for the investigation of dynamical and high speed processes.
In order to restrict the spatial frequency of the object beam we reduced the camera aperture to 5 mm, since the default minimum aperture size of the IR camera was 7 mm and thus not enough to decrease the wavefront spatial frequency and satisfy Eq. 3. The reference beam was transmitted through the objective and focused into the aperture plane. The small aperture reduced the resolution of the recorded images and the quality of the phase difference map. It was not possible to get good results by using these methods, as shown in Fig. 2 the obtained phase map has poor quality and the defect recognition is not easy.
a) b)
Fig. 2. Fourier transform method: a) FFT of the recorded intensity, b) Phase difference due to the thermal deformation, loading duration: 15 sec, investigated area: 15x15 cm2
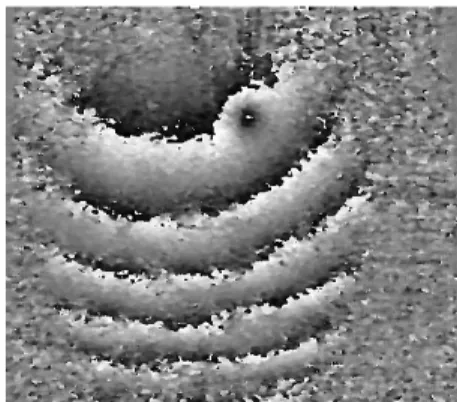
The four steps algorithm gives better results. Figure 3 represents the phase difference calculation due to the displacement under the thermal loading. High density circular fringes on the phase map and surface distortion on 3D representation can be observed in the delaminated zone. The spatial resolution of the image system is about 100 µm and the smallest detectable deformation is approximately λ/10 = 1 µm.
The experimental results (Fig. 3) show deformation magnitudes of about 15 µm. It is very difficult to measure such large deformations by using interferometers based on visible light. Figure 4 shows the mathematically modeled results for the same deformation but obtained by using different wave lengths. The calculations were done by simulating the effect produced by the wave length change on the phase difference. The twenty fold sensitivity (Fig. 4.c) obtained by using visible light (500 nm) leads to unresolved fringe distributions and is not well suited to detect deformations of about 15 µm. Large deformations (e.g. 5-100 µm) could be measured and properly represented by using interferometers based on visible radiation but in this case much more holograms should be recorded during the object displacement (e. g. by using a high speed camera) in order to get a reduced
deformation between two consecutive holograms; further addition of the phases is necessary. However this approach is time consuming and increases the errors due to the addition of speckled phase map sequences.
a)
b)
Fig. 3. Phase difference and 3D representation of the deformation due to the different thermal loading durations: a) 15 sec, b) 60 sec. The investigated area was 15x15 cm2.
a) b) c)
Fig. 4. Modeled phase difference for different wave lengths. a) fivefold, b) tenfold and c) twenty fold sensitivity (investigated area: 15x15 cm2)
Conclusion
We have developed optical NDT methods where LWIR radiation is used. These methods may be used successfully in measurements of large deformations. The algorithm for recording and processing is fully automated and allows a real time representation of the results.
We have shown that the Fourier transform method is not well suited to be used in our set-up due in particular to the relatively low spatial resolution of the IR detectors. The in-line configuration with
the four step algorithm gives better results but may be used only for the investigation of relatively slow processes, because four interferograms need to be recorded in order to calculate the phase, which has to remain approximately constant during the image capturing. In order to speed up the method: short integration times and high frame frequency of the camera, are needed.
The disadvantage of the LWIR holographic interferometry is the high price of the detectors and some optical components, which is slightly counterbalanced by the low price of CO2 lasers. However the detectors are becoming cheaper together with increased performances and resolution. The advantage of our technique is the possibility of measuring larger deformations compared to equivalent methods using visible light, furthermore the use of LWIR allows measurements in more perturbed environmental conditions. However our first experiments are performed in laboratory conditions.
Acknowledgments
These works are funded by the FP7 European project FANTOM (ACP7-GA-2008-213457).
References
[1] C. M. Vest: Holographic Interferometry (Wiley & Sons, New York 1979).
[2] M. M. Rioux, M. Blanchard, M. Cornier, R. Beaulieu, D. Bélanger, in: Plastic recording media for holography at 10.6 µm, Appl. Opt. Vol. 16 (1977), pp. 1876-1879.
[3] E. Allaria, S. Brugioni, S. De Nicola, P. Ferraro, S. Grilli, R. Meucci, in: Digital Holography at 10.6 µm, Opt. Commun. 215 (2003), pp. 257-262.
[4] N. George, K. Khare, W. Chi, in: Infrared holography using a microbolometer array, Appl. Opt. Vol. 47, N° 4 (2008), pp. A7-A12.
[5] J.-F. Vandenrijt, M. Georges, in: Infrared Electronic Speckle Pattern Interferometry at 10 µm, Proc. SPIE Vol 6616 on Optical Measurement Systems for Industrial Inspection V, paper 6616-72, Munich, June (2007).
[6] S. De Nicola, P. Ferraro, S. Grilli, L. Miccio, R. Meucci, P. K. Buah-Bassuah, F. T. Arecchi in: Infrared digital reflective-holographic 3D shape measurements, Optic Communication, 281 (2008), pp. 1145-1449.
[7] I. Yamaguchi, in: Fundamentals and applications of speckle, Proc. SPIE, Vol. 4933 (2003), pp.1-8
[8] J.-F. Vandenrijt, C. Thizy, I. Alexeenko, I. Jorge, I. López, I.S. de Ocáriz, G. Pedrini, W. Osten, M.Georges, in: Electronic Speckle Pattern Interferometry at Long Infrared Wavelengths. Scattering Requirements, Fringe 2009 – 6th International Workshop on Advanced Optical Metrology, Stuttgart, September (2009).
[9] G. Pedrini and H. Tiziani, in: Digital Speckle Pattern Interferometry and Related Techniques, ed. P. K. Rastogi / Wiley & Sons, New York (2001).
[10] J. M. Huntley, in: Digital Speckle Pattern Interferometry and Related Techniques, ed. P. K. Rastogi / Wiley & Sons, New York (2001).
Digital Holographic Interferometry by Using Long Wave Infrared Radiation (CO<sub>2</sub> Laser)