Dielectric barrier discharges: A promising tool for the
fabrication of anti-fogging coatings
Thèse
Ivan Rodriguez Duran
Doctorat en génie des matériaux et de la métallurgie
Philosophiæ doctor (Ph. D.)
Dielectric barrier discharges: A promising tool for
the fabrication of anti-fogging coatings
Thèse
Iván Rodríguez Durán
Sous la direction de :
Résumé
La « vue floue » typique des surfaces embuées peut être extrêmement frustrante. Des exemples tels que les lunettes qui s’embuent pendant l’activité physique, la condensation qui se forme à l’intérieur des fenêtres pendant l’hiver ou les miroirs qui se couvrent de buée pendant la douche le démontrent. En outre, la présence de buée sur les surfaces cause des effets néfastes dans certains secteurs d’activité comme l’industrie automobile (pare-brise et rétroviseurs), l’industrie optique (objectifs, caméras, télescopes et capteurs), l’industrie solaire (modules photovoltaïques), l’industrie alimentaire (emballages d’aliments) et le secteur médical (lunettes et endoscopes). Au cours de la dernière décennie, l’application de revêtements (super)hydrophiles a suscité un intérêt croissant, en raison de leur capacité d’atténuer les effets de la buée. Leur principe de fonctionnement repose sur l’utilisation de matériaux interagissant avec les gouttes d’eau pour en modifier leur morphologie, générant une couche mince d’eau sur la surface. Ainsi, la lumière incidente n’est pas dispersée et les effets de la buée sont amoindris.
Jusqu’à présent, la plupart des techniques de dépôt explorées pour produire des revêtements (super) hydrophiles sont inaccessibles à la production de masse en raison de leur nature multi-étape. Pour cette raison, l’exploration de techniques adaptées à ce type de production, telles que les décharges à barrière diélectrique à pression atmosphérique (AP-DBD), un type de procédé de dépôt chimique en phase vapeur assisté par plasma (AP-PECVD), est cruciale afin d’élargir l’utilisation des revêtements antibuée au-delà du laboratoire. Dans un procédé AP-PECVD contrôlé par des barrières diélectriques (AP-DBD), certains précurseurs inorganiques ou organométalliques (e.g., TiCl4, TiN, SiH4, Si2O(CH3)2) sont introduits entre
deux électrodes parallèles avec un gaz vecteur (e.g., N2, Ar, He) à la pression atmosphérique,
où ils se fragmentent à la suite d’interactions avec les espèces du plasma. Les fragments résultants réagissent les uns avec les autres ou avec le substrat afin de produire les espèces réactives requises au dépôt du revêtement. Les caractéristiques structurelles et fonctionnelles des revêtements PECVD (e.g., la rugosité de surface, la biocompatibilité, les propriétés
optiques et de mouillage) dépendent des certains paramètres de dépôt, tels que la puissance dissipée dans la décharge, le type de décharge, la concentration de précurseurs et le débit de gaz.
La possibilité de se procurer des échantillons de verre dotés de la propriété antibuée via AP-PECVD a été démontrée dans cette thèse. En contrôlant les paramètres de dépôt, les revêtements antibuée ont été préparés en utilisant du 1,3,5,7-tétraméthylcyclotétrasiloxane (Si4O4H4(CH3)4) et de l’oxyde nitreux (N2O) au moyen d’une DBD fonctionnant en N2 à la
pression atmosphérique. Dans le cas des revêtements fabriqués dans des conditions statiques (aucun mouvement entre l’échantillon de verre et les électrodes), l’évaluation quantitative de la résistance à la buée (ASTM F 659-06) a révélé que les revêtements obtenus avec un rapport [N2O]/[TMCTS] ³ 30 ou avec une puissance dissipée ³ 0,25 W cm-2 sont antibuée
(transmittance > 80%) en raison de leur nature hydrophile. La quantité de précurseur et d’oxydant injectée dans la décharge, exprimée par la somme « [N2O] + [TMCTS] »,
n’agissait que peu sur la performance antibuée. En l’absence de changements significatifs dans la rugosité de surface (Rrms et Ra étant compris entre 3 et 6 nm), l’origine de la
performance antibuée a été attribuée à la chimie de surface. Couplé aux rapports O/Si (résultats XPS), un paramètre arbitraire, appelé « rapport d’embuage » a été défini en considérant les résultats FTIR pour expliquer les performances antibuée observées. On a pu constater qu’un rapport O/Si ≥ 2,3 couplé à un rapport d’embuage dans l’intervalle de 0-0,10, résultant de la présence de fonctionnalités hydrophiles, telles que les groupes silanol, hydroxyle, carboxyle or ester à la surface étaient nécessaires pour atteindre la propriété antibuée. Par ailleurs, les revêtements préparés dans des conditions dynamiques utilisant trois autres précurseurs aux structures différentes quant à la présence d’un cycle et au nombre de groupes Si-H et Si-CH3 (l’octaméthylcyclotétrasiloxane, le 1,1,3,3-tétraméthyldisiloxane et
l’hexaméthyldisiloxane) n’étaient pas antibuée. Ce résultat porte à croire que la structure cyclique du TMCTS et la forte réactivité des liaisons Si-H est à l’origine de la formation de ces fonctionnalités hydrophiles et par conséquent, à la performance antibuée observée dans les verres traités en injectant du TMCTS dans la décharge plasma.
Abstract
Experience shows that the “blurred view” typical of fogged surfaces can be incredibly frustrating. Eyewear fogging up during physical activity, condensation forming on the inside of windows during the winter, or bathroom mirrors steaming up when taking a shower are some obvious examples. In addition to being upsetting, the fogging of surfaces has been reported to cause adverse effects on sectors of activity as diverse as the automotive industry (e.g., windshield glass and rearview mirrors), the optical industry (e.g., lenses, cameras, telescopes, and sensors), the solar industry (e.g., photovoltaic modules), the food industry (e.g., food packaging), and medicine (e.g., goggles and endoscopes). Over the last decade, interest has been growing in the application of hydrophilic and superhydrophilic coatings, as they can efficiently mitigate the effects of fogging by changing the morphology of fog drops. The working principle of a (super)hydrophilic surface is based on the use of materials producing a thin film of water on the solid surface on interaction with fog drops. As a result, incident light transmits without being scattered and the effects of fogging are minimized.
Unfortunately, most of the deposition techniques used thus far for the fabrication of (super)hydrophilic coatings involves multiple steps, thus making their integration into mass production a challenging task. For this reason, the exploration of deposition techniques adapted for large-scale production is crucial to broaden the range of application of anti-fogging coatings beyond the laboratory. In this regard, numerous studies on the use of dielectric barriers in plasma enhanced chemical vapor deposition at atmospheric pressure (AP-PECVD) are strongly emerging to address this issue. In a typical AP-PECVD controlled by dielectric barriers, inorganic or organometallic precursors (e.g., TiCl4, TiN, SiH4,
Si2O(CH3)2) are introduced between two parallel electrodes along with a carrier gas (e.g., N2,
Ar, He) at atmospheric pressure where, on interaction with plasma species, undergo fragmentation. The resulting fragments can react with the substrate or with each other to produce short-lived species required for coating deposition. The structural and functional features of PECVD coatings (e.g., surface roughness, biocompatibility, wetting and optical
properties) depend on several deposition parameters, including the power dissipated in the discharge, type of plasma discharge, precursor concentration, and the flow rate of gases.
With this in mind, the feasibility of conferring fogging resistance to commercial glass samples via AP-PECVD has been demonstrated in this doctoral thesis. By appropriately controlling the deposition parameters, anti-fogging coatings were prepared using 1,3,5,7-tetramethylcyclotetrasiloxane (Si4O4H4(CH3)4) and nitrous oxide (N2O) by a dielectric
barrier discharge operated in N2 at atmospheric pressure (AP-DBD). When coating
deposition was conducted in static conditions, that is, with no relative movement between the glass sample and the electrodes, quantitative assessment of the fogging resistance (ASTM F 659-06 standard) revealed that coatings obtained under [N2O]/[TMCTS] ratios ³ 30 or
under a dissipated power ³ 0.25 W cm-2 endowed glass samples with the anti-fogging
property (transmittance > 80%), because of their hydrophilic nature. In terms of the [N2O] + [TMCTS] sum, the amount of TMCTS and N2O injected into the discharge did not
appear to have a great impact on the anti-fogging performance. Indeed, as no significant changes in surface roughness were observed (Rrms and Ra were between 3 and 6 nm), the
origin of the anti-fogging performance was attributed to the surface chemistry. To this end, an arbitrary parameter, called “fogging ratio”, was defined considering FTIR results to account for, along with O/Si ratios (XPS results), the observed anti-fogging performance. Fogging ratios in the 0-0.10 range coupled with O/Si ratios ³ 2.3, resulting from the presence of hydrophilic functionalities, such as silanol (Si-OH), hydroxyl (C-OH) carboxyl (COOH), and ester (COOR) groups at the coating surface were necessary to attain the anti-fogging property. Interestingly, coatings prepared in dynamic conditions using three other precursors with different structures and different number of Si-H and Si-CH3 groups; namely,
octamethylcyclotetrasiloxane (OMCTS), 1,1,3,3-tetramethyldisiloxane (TMDSO), and hexamethyldisiloxane (HMDSO) were not fogging-resistant. This result leads us to believe that the cyclic structure of TMCTS in conjunction with the high reactivity of Si-H bonds is behind the formation of the above-mentioned hydrophilic functionalities, and thus the anti-fogging performance of TMCTS-coated glasses.
Table of contents
Résumé ... ii Abstract ... iv Table of contents ... vi List of tables ... x List of figures ... xiList of symbols and constants ... xx
List of abbreviations ... xxii
Acknowledgements ... xxv
Foreword ... xxix
Introduction ... 1
Problem statement ... 1
How to prevent surfaces from fogging up? ... 2
Research purpose and objectives ... 4
Dissertation organization ... 6
1 Water drop-surface interactions as the basis for the design of anti-fogging surfaces: Theory, practice, and application trends ... 7
1.1 Résumé ... 8
1.2 Abstract ... 9
1.3 Introduction ... 10
1.4 Wetting states of anti-fogging surfaces ... 13
Smooth surfaces ... 14
1.4.1.1 Young model ... 14
Rough surfaces ... 16
1.4.2.1 Wenzel equation ... 16
1.4.2.2 Cassie-Baxter equation ... 16
The issue of line tension in micro/nano droplets and contact angle hysteresis 18 1.5 How to prevent surfaces from fogging up: Anti-fogging strategies, mechanisms, and materials ... 20
(Super)hydrophilic anti-fogging surfaces: Spreading mechanism ... 21
(Super)hydrophobic anti-fogging surfaces: Rolling mechanism ... 25
Hydrophilic/oleophobic anti-fogging surfaces: Percolation mechanism ... 27
1.6 Fabrication techniques toward anti-fogging property ... 30
Bottom-up processing ... 30
1.6.1.1 Dip-coating deposition ... 30
1.6.1.2 Spin-coating deposition ... 35
1.6.1.3 Layer-by-layer deposition ... 39
1.6.1.4 Physical and chemical vapor deposition ... 43
1.6.1.5 Electrochemical deposition ... 45
Top-down processing ... 47
1.6.2.1 Dry and wet etching methods ... 47
1.6.2.2 Lithography ... 51
1.6.2.3 Template-assisted fabrication ... 52
Surface functionalization and related techniques ... 53
1.7 Application trends of anti-fogging surfaces ... 55
Food industry ... 55
Photovoltaic industry ... 56
Medicine ... 57
Optical applications ... 59
1.8 Concluding remarks and outlook ... 59
1.9 Acknowledgements ... 62
2 Phenomenology: From discharge physics to coating deposition ... 63
2.1 Introduction ... 63
2.2 Fundamentals of plasmas: Getting the basics right ... 64
Definition of plasma ... 64
Basic plasma parameters ... 65
2.2.2.1 The degree of ionization ... 65
2.2.2.2 Plasma temperature ... 66
2.2.2.3 Debye length and plasma parameter ... 68
2.3 Plasma types ... 70
Plasmas in complete thermodynamic equilibrium (CTE plasmas) ... 71
Plasmas in local thermodynamic equilibrium (LTE plasmas) ... 73
Plasmas that are not in any local thermodynamic equilibrium (non-LTE plasmas) ... 74
2.4 Electrical breakdown in gases ... 77
Townsend breakdown mechanism ... 79
Streamer breakdown mechanism ... 86
2.5 Dielectric barrier discharges (DBDs) ... 89
Fundamentals: DBD configurations and working principle ... 89
DBD regimes ... 92
2.5.2.1 The HDBD-to-FDBD transition in nitrogen ... 95
2.6 Plasma-surface interactions: Low-pressure vs. atmospheric pressure ... 96
2.7 Atmospheric pressure deposition of SiOxCy:H coatings from siloxane precursors: Focus on 1,3,5,7-tetramethylcyclotetrasiloxane ... 101
3 Characterization techniques of anti-fogging coatings ... 104
3.1 Chemical characterization ... 104
Attenuated total reflectance Fourier transform infrared spectroscopy (ATR-FTIR) 104 X-ray photoelectron spectroscopy (XPS) ... 108
3.2 Surface characterization ... 112
Atomic force microscopy (AFM) ... 112
3.3 Assessment of the deposition rate ... 116
Stylus profilometry ... 116
4 Atmospheric pressure Townsend discharges as a promising tool for the one-step
deposition of anti-fogging coatings from N2O/TMCTS mixtures ... 122
4.1 Résumé ... 123
4.2 Abstract ... 124
4.3 Introduction ... 125
4.4 Materials and methods ... 127
Materials and sample preparation ... 127
Deposition process ... 128
Coating characterization ... 129
4.4.3.1 Stylus profilometry ... 129
4.4.3.2 Attenuated total reflectance Fourier transformed infrared spectroscopy (ATR-FTIR) ... 130
4.4.3.3 X-ray photoelectron spectroscopy (XPS) ... 130
4.4.3.4 Atomic force microscopy (AFM) ... 131
Wetting behavior assessment ... 131
Fogging resistance assessment ... 132
4.5 Results and discussion ... 132
Deposition rate of the coatings ... 132
Structural analysis of the coatings ... 134
4.5.2.1 IR spectrum of liquid TMCTS ... 134
4.5.2.2 IR spectra of the coatings ... 136
Surface composition of the coatings ... 143
Surface topography of the coatings ... 146
Anti-fogging performance and wetting behavior of the coatings ... 148
4.6 Conclusions ... 151
4.7 Acknowledgments ... 151
5 Anti-fogging coatings deposited by atmospheric pressure dielectric barrier discharges: A comprehensive structural and chemical analysis ... 152
5.1 Résumé ... 153
5.2 Abstract ... 154
5.3 Introduction ... 155
5.4 Materials and methods ... 157
Materials and sample preparation ... 157
DBD setup and deposition conditions ... 158
Characterization of surface chemistry ... 160
5.4.3.1 Attenuated total reflectance Fourier transformed infrared spectroscopy (ATR-FTIR) ... 160
5.4.3.2 X-ray photoelectron spectroscopy (XPS) ... 161
Characterization of surface topography ... 161
5.4.4.1 Atomic force microscopy (AFM) ... 161
Coating thickness and deposition rate measurements ... 162
Wetting behavior of the coatings ... 162
Anti-fogging performance assessment ... 162
5.5 Results and discussion ... 163
Structural analysis of the coatings ... 163
Surface topography and deposition rate of the coatings ... 176
Anti-fogging performance and wetting behavior of the coatings ... 179
5.6 Conclusions ... 185
5.7 Acknowledgments ... 186
6 Unveiling the origin of the anti-fogging performance of plasma-coated glass: Role of the structure and chemistry of siloxane precursors ... 187
6.1 Résumé ... 188
6.2 Abstract ... 189
6.3 Introduction ... 190
6.4 Experimental section ... 192
Materials and sample preparation ... 192
Experimental setup and operating conditions ... 193
Thermal and washing treatments ... 196
Chemical characterization of the coatings ... 196
6.4.4.1 Attenuated total reflectance Fourier transformed infrared spectroscopy (ATR-FTIR) ... 196
6.4.4.2 X-ray photoelectron spectroscopy (XPS) ... 197
Morphological characterization of the coatings ... 197
6.4.5.1 Atomic force microscopy (AFM) ... 197
Coating thickness and deposition rate measurements ... 198
Wetting behavior of the coatings ... 198
Fogging resistance assessment ... 199
6.5 Results and discussion ... 199
Electrical characterization of the discharge ... 199
Structural analysis of the plasma-deposited coatings ... 200
Surface chemical composition ... 205
Surface morphology and deposition rate of the coatings ... 209
Anti-fogging performance and wetting behavior of the coated glasses ... 212
6.6 Conclusions ... 218
6.7 Acknowledgements ... 219
General discussion: Limitations and opportunities ... 220
Silanol groups: Where do they come from? ... 220
Deposition mechanism of anti-fogging coatings ... 222
On the reliability of the anti-fogging performance ... 227
On the assessment of the anti-fogging performance ... 229
Future research: What’s next? ... 229
Conclusions ... 231
List of tables
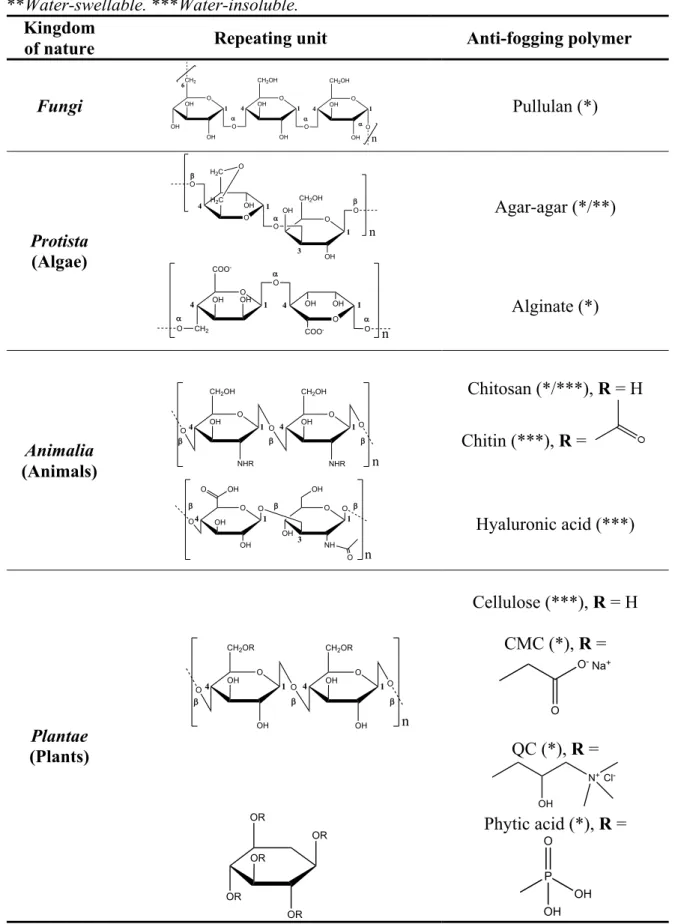
Table 1.1: Repeating units of the main polymers of natural origin used in anti-fogging
formulations. CMC: carboxymethyl cellulose, QC: quaternized cellulose. *Water-soluble. **Water-swellable. ***Water-insoluble. ... 22
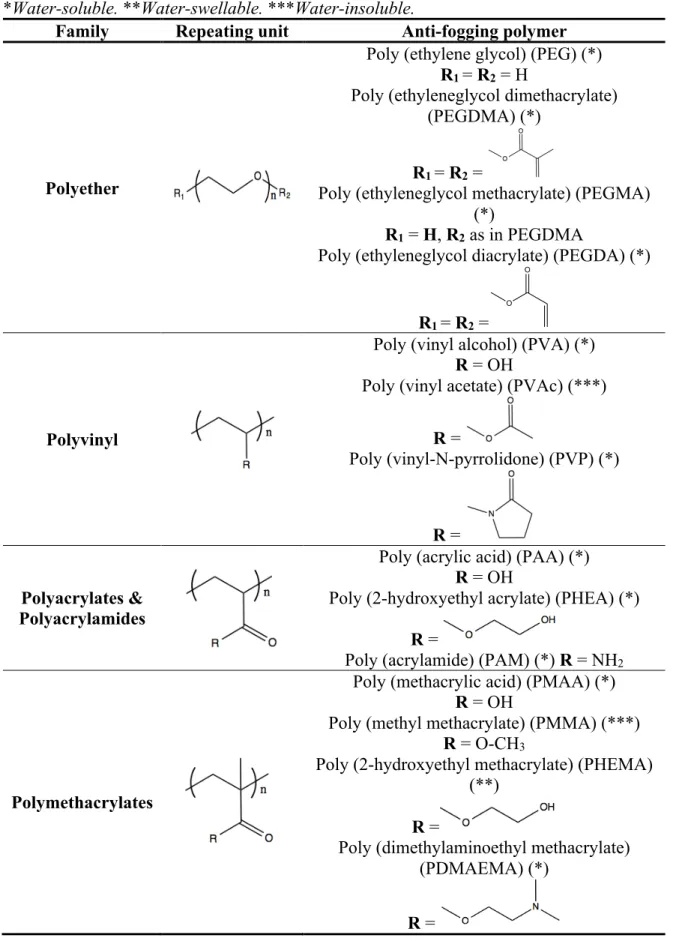
Table 1.2: Repeating units of the main synthetic polymers used in anti-fogging formulations.
*Water-soluble. **Water-swellable. ***Water-insoluble. ... 24
Table 2.1: Elementary processes in active plasma environments. R: radical; S: surface; g:
gas, f: fast, s: slow (Adapted from ref. [349]). ... 98
Table 2.2: Deposition conditions for TMCTS and other siloxane precursors at low and
atmospheric pressure. ... 102
Table 2.2: Continuation ... 103
Table 3.1: Advantages and disadvantages of the sessile drop method. ... 119
Table 4.1: Deposition parameters. [X] indicates concentration in parts per million (ppm).
R = [N2O]/[TMCTS] and S = [N2O] + [TMCTS]. ... 129 Table 4.2: Full width at half maximum (FWHM) of bands and integrated band areas (A) for
plasma-deposited coatings in the 650-1300 cm-1 range. ... 141 Table 4.3: Surface composition of plasma-deposited coatings as a function of the position.
(Middle: at 0.5 cm from the entrance to the discharge). ... 143
Table 4.4: Typical data measured from the light transmission curves presented in Figure 4.9.
*The uncertainty in the A d CH3/A d Si-OH ratios was calculated by error propagation using data
from Table 4.2. ... 149
Table 5.1: Deposition parameters. [X] indicates concentration in parts per million (ppm)
... 160
Table 5.2: Surface composition of the coatings (at. %). * Percentage composition of TMCTS.
... 172
Table 5.3: Root mean square roughness (Rrms), mean roughness (Ra), and deposition rates of
plasma-deposited coatings on 1 ´ 1 and 10 ´ 10 µm2 areas. ... 177 Table 6.1: Principal IR bands of the siloxane precursors used in this study. n = stretching,
d = bending, r = rocking, a = asymmetric, and s = symmetric. ... 203
Table 6.2: Surface composition of plasma-deposited coatings. * Percentage composition of
siloxane precursors. ... 205
Table 6.3: Root mean square roughness (Rrms), mean roughness (Ra), and deposition rates
(DR) of plasma-deposited coatings on 5 ´ 5 and 50 ´ 50 µm2 areas (VP: vapor pressure).
List of figures
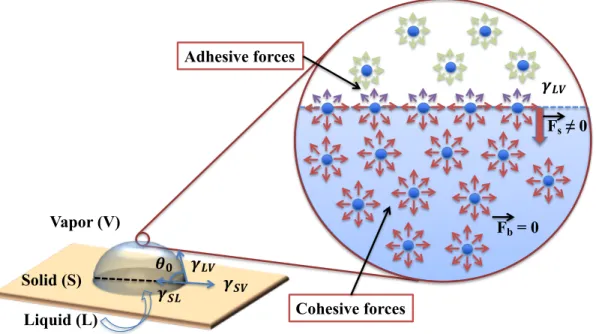
Figure 1.1: Microscopic view of a water drop showing surface tensions at liquid/vapor,
liquid/solid, and solid/vapor interfaces and forces acting on water molecules (adhesive and cohesive forces). Surface tension is the energy required to increase the surface area of a given phase by a unit of area (J m-2). F
s = forces between water molecules at the drop
surface, and Fb = forces between water molecules within the bulk. ... 14 Figure 1.2: Wetting regimes. (a) Wenzel state, (b) Cassie air-trapping state, and (c) Cassie
impregnating state. Solid, liquid, and vapor phases meet in an imaginary circular line known as the “triple phase contact line” (TPCL). ... 18
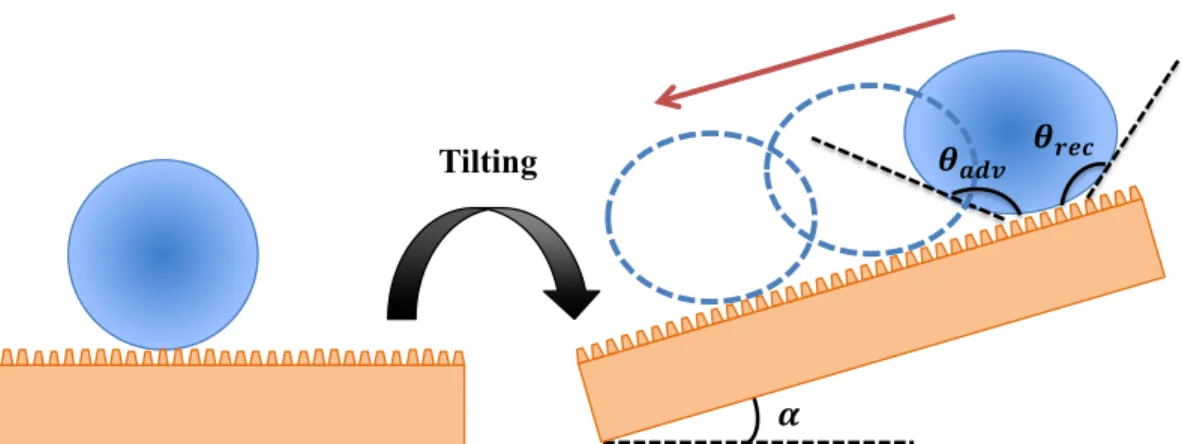
Figure 1.3: Dynamic sessile drop method for the assessment of (a) receding !"#$ and (b)
advancing !%&' contact angles. (c) Tilting base method for the measurement of advancing
and receding contact angles, and sliding angles. Adapted with permission from “Definitions for hydrophilicity, hydrophobicity, and superhydrophobicity: Getting the basics right”, Law, K.-Y., J. Phys. Chem. Lett., Volume 5, Issue 4, 2014, Pages 686-688. Copyright 2018, American Chemical Society. ... 20
Figure 1.4: Illustration of the spreading mechanism. As water drops spread across the
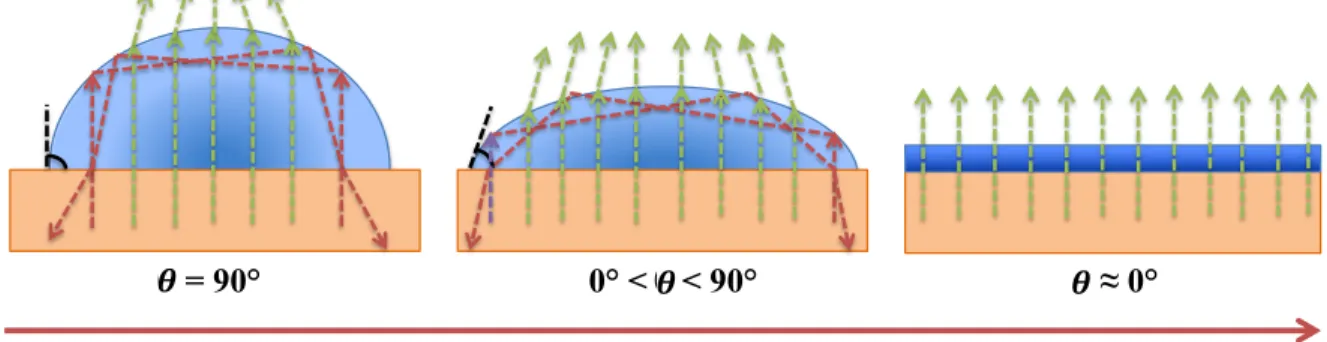
surface, total internal reflection (dashed red rays) become less prevalent while transmitted light (dashed green rays), increasingly less scattered, travel through the system water drop/surface. These surfaces are either hydrophilic (10° < ! < 40-50°) or superhydrophilic (5° <! < 10°). ... 21
Figure 1.5: Illustration of the rolling mechanism. Upon elevation of one side of the surface,
water drops roll off easily, thereby preventing light scattering. These surfaces are either hydrophobic (150° > ! > 90°) or superhydrophobic (! > 150°) and exhibit very low CAH
and SA. ... 25
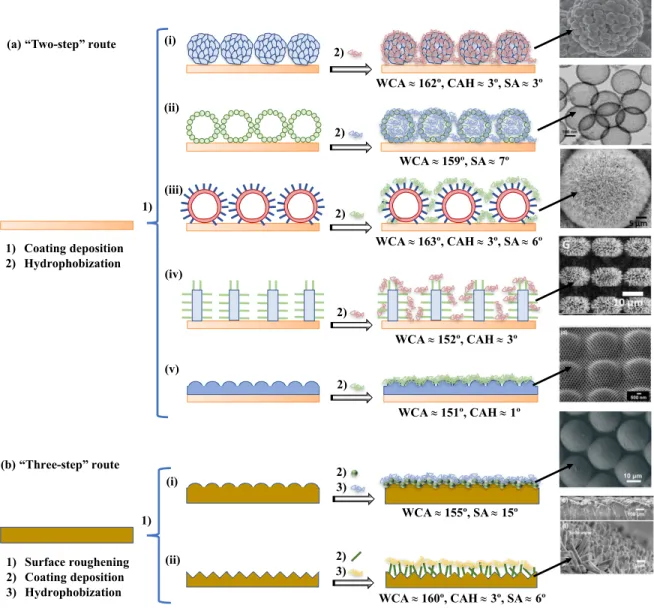
Figure 1.6: Routes toward water-repellency and anti-fogging performance. (a) The
“two-step” route: deposition of a layer with high specific surface and hydrophobization. (i) Deposition of fly-eye bio-inspired ZnO nanostructures and treatment with 1H, 1H, 2H, 2H-perfluorooctyltriethoxysilane (PFOTES) [123]; (ii) deposition of raspberry-like SiO2
nanospheres and hydrophobization with 1H,1H,2H,2H-perfluorodecyltriethoxysilane (PFOTS) [124]; (iii) deposition of dandelion-like ZnO microspheres and subsequent treatment with heptadecafluorodecyltripropoxysilane (FAS-17) [125]; (iv) deposition of epoxy micropillars covered with ZnO nanohairs and hydrophobization with PFOTES [126]; (v) deposition of multiscale ommatidial arrays of a resin containing “methacryl POSS” and treatment with 1H,1H,2H,2H-heptadecafluorodecyl methacrylate (HDMA) [127]. (b) The “three-step” route: surface roughening, coating deposition, and treatment with a low surface energy material. (i) Dome-like surfaces on PDMS covered with solid SiO2 nanoparticles and
hydrophobization with fluoroalkylsilane molecules (FAS) [128]; (ii) ZnO nanohairs on poly (vinylidene difluoride) (PVDF) microratchets treated with FAS-17 [129]. WCA: water contact angle, CAH: contact angle hysteresis, SA: sliding angle. Figures reprinted with permission from refs. [123–129]. ... 26
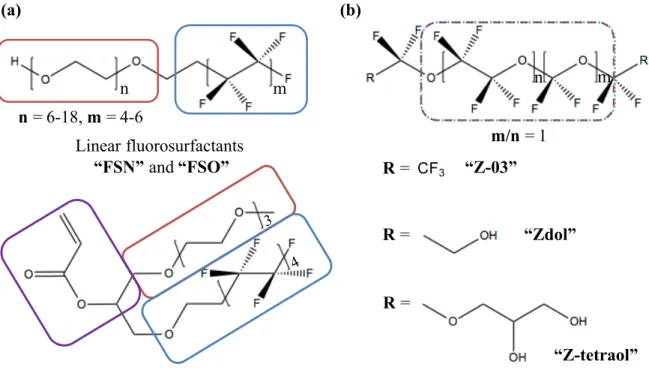
Hydrophilic and oleophobic components are separated in the polymer chain. Depending on the hydrophilic domain, these molecules can be anionic, cationic, non-ionic, or amphoteric. (b) Family of perfluoropolyether polymers (PFPE): hydrophilic and oleophobic domains cannot be distinguished in the backbone. Red: hydrophilic domain, blue: hydrophobic domain, purple: a polymerizable vinyl group. ... 28
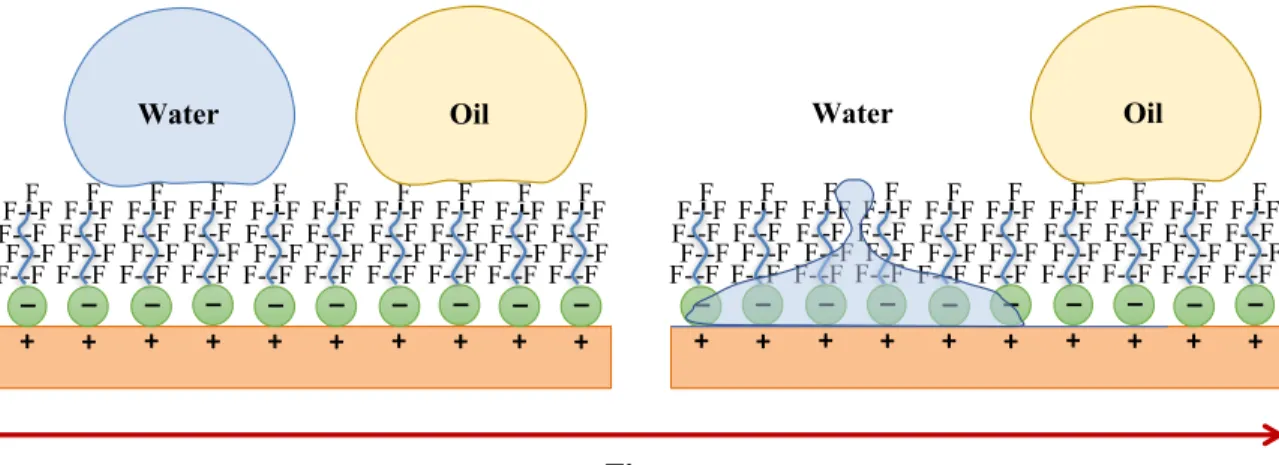
Figure 1.8: Illustration of the “flip-flop” mechanism. The distinguishing feature of a
oleophobic/hydrophilic coating is the tendency of water drops to permeate the coating, and thus eliminate the effects of condensations, while blocking or slowing down the passage of oily substances. Accordingly, oil contact angles (OCA) are greater than water contact angles (WCA). Adapted from “Bioinspired, roughness-induced, water and oil super-philic and super-phobic coatings prepared by adaptable layer-by-layer technique”, Brown, P. S.; Bhushan, B.; Young, T.; et al., Sci. Rep., Volume 5, 2015, Page 14030. (Open access). .... 29
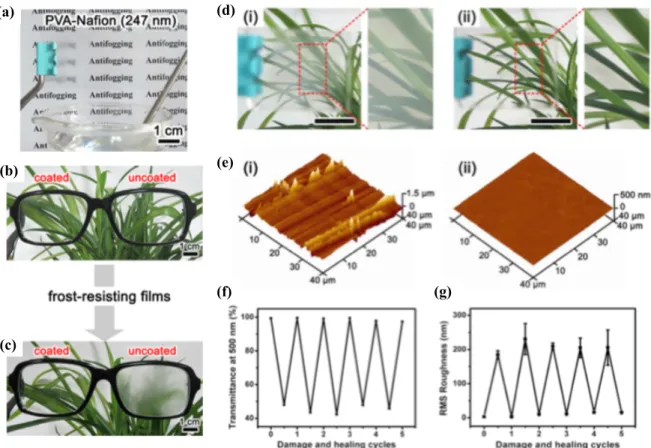
Figure 1.9: (a) Anti-fogging properties of a PVA-Nafion film with thickness of ∼247 nm, respectively. These films were first conditioned in a -20°C refrigerator for 1 h and then placed over boiling water (∼ 50°C and ∼ 100% RH). (b) Pair of polycarbonate eyeglasses, with the left-hand lens coated with PVA-Nafion films and the right-hand one uncoated. (c) Eyeglasses after being conditioned at -20°C for 1 h and then exposed to an ambient environment of ∼20°C and ∼ 40% RH. (d) Digital images of the PVA-Nafion film on a glass substrate that heals scratches. (i) Film scratched with sandpaper and (ii) scratched film from panel i after healing in water for 5 min. The scale bar is 1 cm. (e) AFM images of the scratched PVA-Nafion film before (i) and after (ii) healing in water. (f,g) Changes in transmittance at 500 nm and Rrms roughness, respectively, of the PVA-Nafion film during five
cycles of the scratching-healing process. Reprinted with permission from “Highly transparent and water-enabled healable antifogging and frost-resisting films based on poly(vinyl alcohol)-nafion complexes”, Li, Y.; Fang, X.; Wang, Y.; Ma, B.; and Sun, J., Chem. Mater., Volume 28, Issue 19, 2016, Pages 6975-6984. Copyright 2018, American Chemical Society. ... 31
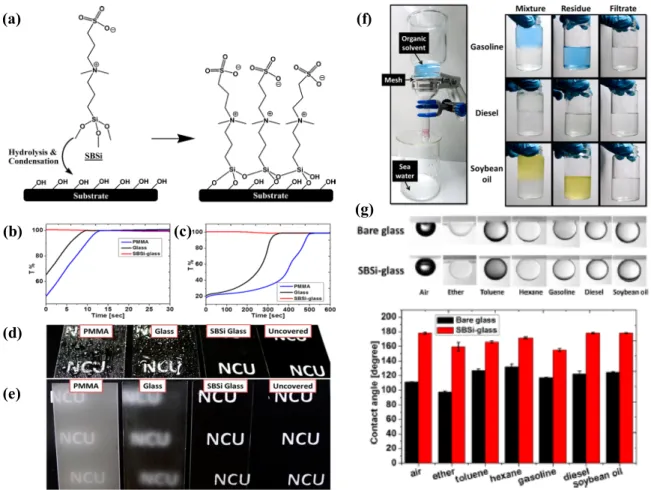
Figure 1.10: (a) Chemical structure of SBSi and the formation of SBSi coatings on the
oxidized substrate. Light transmission through the samples of PMMA, bare glass, and SBSi-glass after the treatments of (b) hot or (c) freezing at -20°C. (d) Water spray on samples of PMMA, bare glass, and SBSi-glass. (e) Anti-fogging test by treating the water steam to samples of PMMA, bare glass, and SBSi-glass. (f) Oil-water separation apparatus and images of oil-water mixtures, residues, and filtrates in vials before and after separation. The colors of organic fluids are original, without pigment added. (g) Optical images of the underwater-oil CA measurements for SBSi-glass performed with air bubbles, ether, toluene, hexane, gasoline, diesel, and soybean oil; and quantitative results of OCAs for bare and SBSi-glass samples. Reprinted with permission from “Surface modification for superhydrophilicity and underwater superoleophobicity: Applications in antifog”, Huang, K.-T.; Yeh, S.-B.; and Huang, C.-J., ACS Appl. Mater. Interfaces., Volume 7, Issue 38, 2015, Pages 21021-21029. Copyright 2018, American Chemical Society. ... 32
Figure 1.11: (a) Schematic of the in situ nanopressing process. (b) SEM images of (i)
SNs/polymer/PET, and (ii) ISNW20-SNs/polymer/PET, ISNW20: 20 washing cycles. (iii) Digital images exhibiting the antifogging property of blank (lower part) and ISNW20-SNs/polymer coated (upper part) PET, respectively; (iv) Transmission spectra of blank PET, polymer/PET, SNs/polymer/PET, ISN-SNs/polymer/PET, ISNW20-SNs/polymer/PET, and
ISNW120-SNs/polymer/PET, respectively. (c) (i) SEM image of the 2HSNs/polymer thin film coated glass, (ii) TEM image of the HSNs. (iii) Digital images exhibiting the antifogging properties of 2HSNs/polymer coated glasses (upper part) and blank glasses (lower part). (iv) Transmission spectra of blank glass and glasses coated, respectively, by polymer, 1HSNs/polymer, 2HSNs/polymer, and 3HSNs/polymer. The best anti-fogging configuration is shown in a red rectangle. Figures and graphics reprinted with permission from references
[157,158]. ... 34
Figure 1.12: (a) The in situ synthesis mechanism of TiO2/SiO2 nanospheres. (b) Contact
angle of the blank substrate, substrate with SiO2 particles, and substrate with TiO2/SiO2
nanospheres. (c) The anti-fogging property of the samples. “In situ growth of TiO2/SiO2
nanospheres on glass substrates via solution impregnation for antifogging”, Liu, F.; Shen, J.; Zhou, W.; Zhang, S.; and Wan, L., RSC Adv., Volume 7, Issue 26, 2017, Pages 15992-15996. Published by The Royal Society of Chemistry. ... 35
Figure 1.13: (a) Schematic illustration of partial quaternization of
poly(DMAEMA-co-MMA). Photos of different samples: (b) control glass and (c) SIPN-Q-5, which were first stored at -20°C for 30 min and then exposed for 5 s to ambient lab conditions (∼ 20°C, 50% RH). Light transmittance at the normal incident angle for various samples: (d) as prepared and (e) 5 s under ambient condition (∼ 20°C, 50% RH) after being stored at -20 °C for 30 min. (f) Zone-of-inhibition test result of (a) SIPN-Q-5 and (b) SIPN-Q-10 in a cultured lawn of E. coli. “SIPN-Q-X”, X: x mol% in the copolymer of quaternized DMAEMA. Reprinted with permission from “Dual-functional antifogging/antimicrobial polymer coating”, Zhao, J.; Ma, L.; Millians, W.; Wu, T.; and Ming, W., ACS Appl. Mater. Interfaces., Volume 8, Issue 13, 2016, Pages 8737-8742. Copyright 2018, American Chemical Society.
... 36
Figure 1.14: (a) Bilayered anti-fogging coating. (b) Steam anti-fogging tests of coatings in
AF10 after 1 year in service. Reprinted with permission from “Preparation of water-resistant antifog hard coatings on plastic substrate”, Chang, C.-C.; Huang, F.-H.; Chang, H.-H.; Don, T.-M.; Chen, C.-C.; and Cheng, L.-P., Langmuir, Volume 28, Issue 49, 2012, Pages 17193-17201. Copyright 2018, American Chemical Society. ... 37
Figure 1.15: (a) Scanning electron microscopy image of ((PAH-PVA-PAA)/(PVA-PAA))10
films. (b) Transmittance of films with different numbers of bilayers on glass substrates. (c) Photography of a cooled glass slide with (left) and without (right) the coating in a high-humidity environment (90% RH) at 35°C after being cooled in a refrigerator to < 5°C. Fourier transform infrared spectra of (d) bare silicon wafer substrate and fibrinogen and (e) ((PAH-PVA-PAA)/(PVA-PAA))10 films before and after contact with a fibrinogen solution.
Reprinted with permission from “Antifibrinogen, antireflective, antifogging surfaces with biocompatible nano-ordered hierarchical texture fabricated by layer-by-layer self-assembly”, Manabe, K.; Matsuda, M.; Nakamura, C.; Takahashi, K.; Kyung, K. H.; and Shiratori, S., Chem. Mater.,Volume 29, Issue 11, 2017, Pages 4745-4753. Copyright 2018, American Chemical Society. ... 40
Figure 1.16: LbL strategies for the deposition of inorganic materials used in anti-fogging
coatings [206,208,211,213]. C: Carbon (template), MPSNPs: Mesoporous silica nanoparticles, NS: Nanosheets, PC: Polycarbonate (template), PDDA: Poly
(diallyldimethylammonium chloride), PSS: Sodium poly(4-styrenesulfonate), SSNPs: Solid silica nanoparticles. ... 42
Figure 1.17: Schematic illustration of the fabrication procedures for preparing a
multifunctional ITO nanorod film: (a) superhydrophilic ITO nanorods (WCA < 1°) displaying anti-fogging behavior when exposed to a humid environment (RH > 80%) after storage at -20°C, and (b) superhydrophobic ITO nanorods (WCA = 172.1°, SA » 0°) featuring self-cleaning activity. (c) WCA of the post-annealed ITO nanorod films on glass substrates as a function of the growth time. The insets show the water CAs of a bare glass substrate and of an ITO nanorod film grown on a glass substrate for 60 min. (d) Top- and side view SEM images of the ITO nanorod film grown on a glass substrate for 60 min. Reproduced from “Fabrication and characterization of large-scale multifunctional transparent ITO nanorod films”, Park, H. K.; Yoon, S. W.; Chung, W. W.; Min, B. K.; and Do, Y. R., J. Mater. Chem. A, Volume 1, Issue 19, 2013, Pages 5860-5867. Copyright 2018, with permission of The Royal Society of Chemistry. ... 44
Figure 1.18: (a) Schematic drawing of the synthesis and hydrogen-bond-driven stabilization
of titanate nanobelts. (b) Schematic illustration of the electrophoretic deposition process to prepare a TNB/FAS film. (c) SEM image of the as-prepared superhydrophobic TNB/FAS film (2 min). The inset image shows water droplets on the transparent TNB/FAS film on ITO glass. (d) Time sequence of the self-cleaning process on the superhydrophobic coating with low water adhesion. (e) Water droplet on the superhydrophilic TiO2 film. (f) Photograph of an
ITO substrate deposited with superhydrophilic coatings (bottom) and a control ITO substrate without any coating deposition (upper) taken from a refrigerator (-4°C) to the humid laboratory air (ca. 50% RH). Reproduced from “Transparent superhydrophobic/superhydrophilic TiO2-based coatings for self-cleaning and
anti-fogging”, Lai, Y.; Tang, Y.; Gong, J.; Gong, D.; Chi, L.; Lin, C.; Chen, Z.; Liu, M. J.; Zheng, Y. M.; Zhai, J.; et al., J. Mater. Chem., Volume 22, Issue 15, 2012, Pages 7420-7426. Copyright 2018, with permission of The Royal Society of Chemistry. ... 46
Figure 1.19: SEM images of glasses etched for different periods of time (4, 12, and 24 h):
(a) glass “A” (27.42 wt% of Na2O), (b) glass “B” (24.08 wt% of Na2O), and (c) glass “C”
(0.35 wt% of Na2O). (d) Transmittance spectra of glass A before and after etching (KOH
1M) at different etching times, and (e) anti-fogging performance of etched “A” glasses (4 h) when cooled at -10°C and exposed thereafter to steam (right: before etching and left: after etching). Reproduced from “A multifunctional nanoporous layer created on glass through a simple alkali corrosion process”, Xiong, J.; Das, S. N.; Kar, J. P.; Choi, J.-H.; and Myoung, J.-M., J. Mater. Chem. Volume 20, Issue 45, 2010, Pages 10246-10252. Copyright 2018, with permission of The Royal Society of Chemistry. ... 48
Figure 1.20: (a) Facile solution-based procedure for the preparation of the gradient-index
anti-reflection coating (GIARC) based on Si-containing block copolymers. SEM images of a double-layered GIARC consisting of (b) SD55k (fPDMS = 0.091) and (c) SD43k
(fPDMS = 0.488). (d) Comparison of the anti-fogging properties of GIARC and a bare glass
substrate. (e) Changes in transmittance with the exposure time to water vapor. Reprinted from “Ultra-high optical transparency of robust, graded-index, and anti-fogging silica coating derived from Si-containing block copolymers”, Sim, D.; Choi, M.-J.; Hur, Y.; Nam, B.; Chae, G.; Park, J.; and Jung, Y., Adv. Opt. Mater. Volume 1, Issue 6, 2013, Pages 428-433. Copyright 2018, with permission from John Wiley and Sons. ... 50
Figure 2.1: (a) Maxwellian (solid blue line) and Druyvesteyn (dashed blue line) electron
energy distributions with average electron energies of 1, 3, and 5 eV and corresponding elemental processes (Adapted from ref. [340]). (b) Pressure dependence of electron and gas temperatures in DC-driven plasma discharges (Adapted from ref. [343]). ... 67
Figure 2.2: Illustration of the “Debye shielding”. If the charge density is perturbed, plasma
reconfigures to reduce the resulting electric field. Image adapted from https://www.nextbigfuture.com/2016/09/electrostatic-glider-update.html. ... 69
Figure 2.3: Classification of man-made and natural plasmas as a function of electron
temperature and electron density (Adapted from http://pdml.tamu.edu/about.html.). ... 71
Figure 2.4: (a) Voltage-current characteristics of DC discharges (current values are
illustrative) and (b) schematic diagram of a DC discharge between two metal parallel plate electrodes. Curve in red: atmospheric pressure discharges. Curve in blue: low-pressure discharges (typically < 103 Pa). *+": breakdown voltage, ,0: saturation current. (Adapted
from ref. [356]). ... 77
Figure 2.5: (a) Electron avalanche in the presence of a uniform electric field . = *&. In
blue: seed electrons and electrons resulting from inelastic collisions. In red: secondary electrons emitted by the cathode. In green: positive ions resulting from the ionization of gas particles (Adapted from ref. [363]. (b) Variation of the Ln current as a function of the inter-electrode distance, with an E/P uniform (Adapted from ref. [364]). ... 80
Figure 2.6: Paschen’s curves showing the breakdown voltage as a function of 0 ∙ & for
different gases (Adapted from ref. [372]). The Paschen’s curve is only applicable to parallel plane electrodes or uniform electric fields in the absence of a magnetic field. ... 84
Figure 2.7: (a) Representation of field distortion in a gap caused by space charge of an
electron avalanche (local electric field). (b) The space charge distribution in an electron avalanche. The head of the avalanche is rounded because the diffusion of electrons occurs in all directions and is assumed to be concentrated within a spherical volume with negative charge ahead of the positive charge. The form of the tail is wedge-shaped (Adapted from ref. [377]). ... 87
Figure 2.8: Temporary and spatial evolution of a streamer. (a) Electronic avalanche
propagation and avalanche-to-streamer transition, (b) negative or anode-directed streamer, (c) positive or cathode-directed streamer, and (d) formation of a conductive filament or micro-discharge (Adapted from ref. [376]). ... 88
Figure 2.9: Typical dielectric barrier discharge configurations: (a, b) single-barrier
parallel-plate discharge, (c) double-barrier parallel-plate discharge, (d) single-barrier concentric discharge, (e) single-barrier surface discharge, and (f) double-barrier surface discharge (coplanar discharge). Adapted from ref. [361]. ... 90
Figure 2.10: The working principle of a DBD. (a) Electrons in the micro-discharge spread
across the dielectric surface when they reach the anode, while the positive ions in the tail head towards the cathode. (b) The micro-discharge extinguishes and a second one initiates elsewhere. (c) Transient reversal of the electrodes polarity induced by charge accumulation. The presence of a dielectric material leads to the formation of a transient discharge, which must be reactivate by the external circuit using an alternating or pulsed current power
Figure 2.11: V-I characteristics of (a) a filamentary discharge in nitrogen (gas gap = 1mm
and applied voltage = 6.4kV) of (b) a homogeneous discharge in nitrogen —Townsend discharge (gas gap = 1mm and applied voltage = 10 kV) (Adapted from ref. [387]). ... 93
Figure 2.12: Schematic of main processes involved in a CVD process. In bright purple:
plasma generated by a DBD. (Adapted from ref. [399]). ... 96
Figure 2.13: Influence of the discharge regime on the coating morphology. (+): anode, (-):
cathode. ... 100
Figure 3.1: Vibrational modes in IR spectroscopy. ... 105
Figure 3.2: (a) FTIR spectrometer layout*, (b) working principle of an interferometer, and
(c) ATR crystal. (*http://mmrc.caltech.edu/FTIR/Literature/General/FTIRintro.pdf). ... 106
Figure 3.3: (a) XPS instrumentation [433]. (b) Emission of photoelectrons and (c) Auger
electrons. Auger process involves four sequential steps: (1) absorption of a X-ray photon by a core electron (e.g., 1s or K electron), (2) emission of a core electron leaving a hole in the shell, (3) a second electron from an outer shell (e.g., 2s or L1 level) fills in the hole (4) with
simultaneous emission of an outer electron (e.g., 2p electron). The result is a three-electron process that results in a doubly ionized atom. Spectroscopic notation of this Auger electron is KL1L2,3 or KLL. ... 109 Figure 3.4: Sample/spectrometer energy level diagram for (a) conductive and (b) insulating
samples. In conductive samples, the Fermi level (.2 ) of the sample and that of the
spectrometer are aligned because of the ohmic contact between them. A potential “.$ℎ”
appearing in insulating samples in response to a surface charging phenomenon causes the Fermi level of the spectrometer to raise with respect to that of the sample. (.* = Energy
level of vacuum, .2 = Fermi level, 45%678# = Work function of the sample, 457#$9":6#9#" = Work function of the spectrometer). ... 110
Figure 3.5: AFM instrumentation. (Image from http://web.mit.edu/cortiz/www/afm.gif). 113
Figure 3.6: Schematic of a surface profile Z(x). Note that Rrms> Ra. ... 116 Figure 3.7: Schematics of a stylus profilometer head with loading system and scan
mechanism used in Veeco/Sloan Dektak profilers [445]. ... 117
Figure 3.8: (a) Schematic setup used in this doctoral project to measure contact angles. (b)
Photograph of a sessile drop lying on clean glass showing the tangent line at the three-phase point, the base line, and the outer contour of the drop. ... 118
Figure 3.9: (a) ASTM F 659-06 setup (equivalent BS EN 168) for the assessment of fogging
resistance. (b) Setup for the assessment of the anti-fogging performance. The setup is composed of (1) a 590 nm LED (light emitting diode), (2) a diaphragm, (3) a beam splitter, (4) a mirror, (5) a mirror inside the water bath as shown in (a), (6) a converging lens, and (7) a photodetector. ... 121
Figure 4.1: Molecular structure of TMCTS. ... 127
Figure 4.2: DBD setup used for the deposition of TMCTS-based coatings. ... 128
Figure 4.3: Deposition rate as a function of the position for coatings deposited under
Figure 4.4: IR spectrum of liquid TMCTS (n = stretching, d = bending, r = rocking, a = asymmetric, and s = symmetric). ... 135
Figure 4.5: IR spectra of (a) 4000-500 cm-1, (b) 3800-2400 cm-1, (c) 1800-1300 cm-1, and
(d) 1300-700 cm-1 regions of coatings deposited at R = 10 (in red) and R = 30 (in blue).
... 137
Figure 4.6: Example of curve fitting of the 650-1300 cm-1 region for a coatings deposited at
S = 100 and R = 10. The spectral features resulting from ns O-Si-C [491,492], d Si-O-Si, and n Si-C/r CH3 vibrations were also considered to provide further detail on the chemistry and
structure of the coatings. ... 140
Figure 4.7: HRXPS C1s and Si2p spectra for the coating A (R = 10) (a,c) and the coating B
(R = 30) (b,d), respectively, on areas located at 0.5 cm from the entrance to the discharge.
... 145
Figure 4.8: Atomic force micrographs of the plasma-deposited coatings on glass using a
homogeneous N2/N2O Townsend discharge. (a) R = 10, (b) R = 30 on a 2 × 2 μm2 scanning
area, and (c) R = 10 and (d) R = 30 on a 20 × 20 μm2 scanning area (AFM analyses were
performed on areas located at 0.5 cm from the discharge). ... 147
Figure 4.9: (a) Percentage of light transmitted as a function of time through plasma-coated
glasses fabricated under different [N2O]/[TMCTS] ratios and [N2O] + [TMCTS] sums. (b)
Side view of a coated glass obtained at [N2O]/[TMCTS] = 30 and [N2O] + [TMCTS] = 100,
when exposed to water vapor at 80°C (Fog testing was performed on areas located at 0.5 cm from the discharge). ... 148
Figure 5.1: Structure of 1,3,5,7-tetramethylcyclotetrasiloxane (TMCTS). ... 158
Figure 5.2: (a) DBD setup showing gas flow, electrodes, and glass sample. (b) A
current-voltage characteristic of an atmospheric pressure TMCTS/N2O/N2 discharge operating in
the homogeneous regime or “Townsend” regime (f = 6 kHz, Vapplied = 16 kVpeak-to-peak). .. 159 Figure 5.3: IR spectrum of liquid TMCTS (n= stretching, d = bending, r = rocking, a = asymmetric, and s = symmetric). ... 163
Figure 5.4: IR spectra of (a) 2400-3800 cm-1, (b) 2100-2300 cm-1, (c) 1300-1800 cm-1, and
(d) 700-1300 cm-1 regions of plasma-deposited coatings under different [N2O]/[TMCTS]
ratios, namely, 0 (in black), 10 (in red), 20 (in green), 30 (in navy blue), and 40 (in light blue). ... 165
Figure 5.5: IR spectra of (a) 2400-3800 cm-1, (b) 2100-2300 cm-1, (c) 1300-1800 cm-1, and
(d) 700-1300 cm-1 regions of plasma-deposited coatings under different power dissipated in
the discharge, namely 0.10 (in black), 0.25 (in red), 0.40 (in green), 0.55 (in navy blue), and 0.70 W cm-2 (in light blue). ... 167 Figure 5.6: Curve fitting of the 850-1300 cm-1 region (deposition conditions:
[N2O]/[TMCTS] = 30, DP = 0.25 W cm-2). (b) Variation of the Si-O-Si bond angle as a
function of the [N2O]/[TMCTS] ratio and the dissipated power. ... 170 Figure 5.7: Curve fitting of C 1s core level spectra for (a-c) coatings obtained under
Figure 5.8: (a) 3D and (b, c) 2D phase contrast images of a plasma-deposited TMCTS on
glass using a homogeneous N2/N2O Townsend discharge. (d) 2D phase contrast image of an
untreated glass substrate. Deposition conditions = 0.7 W cm-2 and [N
2O]/[TMCTS] = 30 (In
the 3D image, the phase contrast colors are used to enhance the standard topographic information obtained from the height). ... 178
Figure 5.9: Water contact angles, “fogging parameter”, and O/Si ratios for coatings
deposited under different (a) [N2O]/[TMCTS] ratios (0.25 W cm-2) and (c) dissipated power
([N2O]/[TMCTS] = 30). Percentage of light transmitted as a function of time through
plasma-coated glasses obtained under different (b) [N2O]/[TMCTS] ratio and (d) dissipated
power. ... 180
Figure 5.10: Side view of coated glasses obtained (a) at [N2O]/[TMCTS] = 30,
DP = 0.7 W cm-2 and (c) at [N2O]/[TMCTS] = 20, DP = 0.25 W cm-2, respectively, when
exposed to water vapor at 80°C. (b,d) The coated glasses on a paper with letters written in it following hot-fog testing. ... 184
Figure 6.1: Siloxane precursors used for the preparation of coatings by AP-DBD. (a)
TMCTS, (b) OMCTS, (c) TMDSO, and (d) HMDSO. ... 193
Figure 6.2: DBD design used for the deposition of siloxane-based coatings. ... 194
Figure 6.3: (a) The I-V characteristic of a N2O/N2/TMCTS discharge, and (b) a detail of the
I-V characteristics of a N2/N2O discharge in the presence of TMCTS, OMCTS, TMDSO, and
HMDSO. ... 200
Figure 6.4: (a) IR spectra of TMCTS, OMCTS, TMDSO, and HMDSO. (b) IR spectra of
plasma-deposited coatings in the 500-4000 cm-1 range. Detail of the (c) 700-1300 and (d)
2600-3800 cm-1 regions showing the main IR spectral features (n = stretching, d = bending, r = rocking, a = asymmetric, and s = symmetric). ... 201
Figure 6.5: Curve fitting of the 800-1300 cm-1 region (TMCTS-based coating). ... 202 Figure 6.6: Curve fitting of the C1s core level spectrum of (a) TMCTS-based, (b)
OMCTS-based, (c) TMDSO-OMCTS-based, and (d) HMDSO-based coatings. ... 207
Figure 6.7: Curve fitting of Si2p core level spectra of (a) TMCTS-based, (b) OMCTS-based,
(c) TMDSO-based, and (d) HMDSO-based coatings. ... 208
Figure 6.8: Atomic force micrographs of the plasma-deposited coatings on glass using a
homogeneous N2/N2O Townsend discharge. (a) TMCTS-, (b) OMCTS-, (c) TMDSO-, (d)
HMDSO-based coatings. ... 210
Figure 6.9: (a,d,g,j) Top and (b,e,h,k) side views of coated glasses placed over an
Erlenmeyer flask containing water at 80°C for 15 s. (c,f,i,l) Coated glasses at a distance of
~ 1 m from the Erlenmeyer following hot-fog testing. ... 213
Figure 6.10: WCA measured on (a) TMCTS-, (b) OMCTS-, (c) TMDSO-, and (d)
HMDSO-based coatings. ... 214
Figure 6.11: Percentage of light transmitted as a function of time through the TMCTS-coated
glasses treated at (a) 100°C for 1 h, (b) 100°C for 5 h, (c) 500°C for 1 h, and (d) 500°C for 5 h, under an Ar atmosphere. ... 216
Figure 6.12: Percentage of light transmitted as a function of time through the TMCTS-coated
glasses treated at (a) 100°C for 1 h, (b) 100°C for 5 h, (c) 500°C for 1 h, and (d) 500°C for 5 h, under an Ar/O2 (2% v/v) atmosphere. ... 217 Figure 7.1: Possible reaction pathways involved in the deposition of anti-fogging coatings
showing the formation of different structures in the plasma phase. ... 224
Figure 7.2: (a) Silanol type distribution as a function of the pretreatment temperature in
vacuo in silica: curve 1, average concentration of the total OH groups; curve 2, average concentration of the free isolated OH groups; curve 3, average concentration of vicinal OH groups bound through the hydrogen bonds; and curve 4, average concentration of surface Si atoms that are part of the siloxane bridges and free of OH groups (Reproduced from ref. [402]). ... 228
List of symbols and constants
Symbol Description Units
; Area m2
< Speed of light in vacuum (2.9979 ´ 108) m s-1
=> Concentration of element i at.%
? Inter-electrode distance mm
?@ Depth of penetration µm
A Charge of the electron (1.6022 ´ 10-19) C
B Kinetic energy eV
B Electric field V m-1
BC Fermi level eV
BD Energy level of vacuum eV
B/@ Total reduced electric field V m-1 Torr-1
F(B) Energy distribution function -
C Force N
I Planck constant (6.626´10-34) m2 kg s-1
J> Partition function of the state i -
K Current A
L Force constant/spring constant N m-1
LM Boltzmann constant (1.3806 ´ 10-23) m2 kg s-2 K-1
N Sampling length m
O Characteristic reaction dimension m
P Particle mass kg
PA Electron mass (9.1094 × 10⁻³¹) kg
Q Particle number density, plasma density m-3
Q> Refractive index of medium R -
ST Plasma parameter -
U Pressure Torr
V (Particle) temperature eV
D Applied voltage V
DWX Breakdown voltage V
Y Townsend’s first ionization coefficient m-1
Y> Degree of ionization -
Z< Cantilever deflection m
[\ Permittivity of free space (8.854´10-12) F m-1
[ Electrical permittivity of a medium F m-1
[> Ionization energy eV
] Electron attachment coefficient m-1
^ Work function eV
^> Sensitivity factor of the element i -
_ Contact angle/Incident angle °
_< Critical angle °
Symbol Description Units
aT Debye length m
a Mean free path length/wavelength m/nm
b Reduced mass m
b Bond dipole moment C m
b Particle mobility m2 V-1 s-1
c Collision frequency s-1
List of abbreviations
Abbreviation Definition
AFM Atomic force microscopy
APGD Atmospheric pressure glow discharge
APCAs Apparent contact angles
AP-DBD Atmospheric pressure dielectric barrier discharge
ASTM American society for testing and materials
ATR-FTIR Attenuated total reflectance – Fourier transform infrared spectroscopy
BE Binding energy
CA Contact angle
CAH Contac angle hysteresis
CHI Chitosan
CLA Center-average line
CMC Carboxymethyl cellulose
CNTs Carbon nanotubes
CNRS Centre national de recherche scientifique
CQMF Centre québécois sur les matériaux fonctionnels
CR-39 Allyl diglycol carbonate
CSH Calcium silicate hydrates
CTAB Cetyltrimethylammonium bromide
CTE Complete thermodynamic equilibrium
CVD Chemical vapor deposition
DBD Dielectric barrier discharge
DC Direct current
DFT Discrete Fourier transform
DLIL Direct laser interference lithography
DSHNs Double-shell hollow nanospheres
DZ Faujasitic nanozeolites
EEDF Electron energy distribution function
ESCA Electron spectroscopy for chemical analysis
FAS Fluoroalkylsilane molecules
FAS-17 Heptadecafluorodecyltripropoxysilane
FDBD Filamentary dielectric barrier discharge
FQRNT Fonds québécois de la recherche sur la nature et les technologies
GLID Glycerol monolauric acid monoitaconic acid diester
GIARC Gradient-index anti-reflection coating
HA Hyaluronic acid
HMDA 1H, 1H, 2H, 2H-heptadecafluorodecyl methacrylate
HDBD Homogeneous dielectric barrier discharge
HMDSO Hexamethyldisiloxane
HRXPS High-resolution x-ray photoelectron spectroscopy
HSNs Hollow silica nanoparticles
IR Infrared
ISO International organization for standardization
Abbreviation Definition
KE Kinetic energy
L Liquid phase
LAPLACE Laboratoire plasma et conversion d’énergie
LbL Layer-by-layer deposition
LED Light emitting diode
LLDPE Linear low-density polyethylene
LIS Laboratoire d’ingénierie de surface
LTE Local thermodynamic equilibrium
LVDT Linear variable differential transformer
MA Maleic anhydride
MMGD Monostearic acid monomaleic acid glycerol
MPSNPs Mesoporous silica nanoparticles
MTMS Methyltrimethoxysilane
NSERC Natural sciences and engineering research council of Canada
MW Micro wave
NB Norbornene
NF Nanoflowers
NP Nanoparticles
NS Nanosheets
OCA Oil contact angle
OPD Optical path difference
PAA Polyacrylic acid
PAM Polyacrylamide
PC Polycarbonate
PDDA Polydiallyldimethylammonium chloride
PDMAEMA Polydimethylaminoethyl methacrylate
PDMS Polydimethylsiloxane
PE Polyethylene
PECVD Plasma enhanced chemical vapor deposition
PEG Polyethylene glycol
PEGDA Polyethylene glycol diacrylate
PEGDMA Polyethylene glycol dimethacrylate
PEGMA Polyethylene glycol methacrylate
PFOS Perfluorooctanesulfonic acid potassium salt
PEI Polyethylenimine
PET Polyethylene terephthalate
PFPE Perfluoropolyether polymers
PFTOES 1H, 1H, 2H, 2H-perfluorooctyltriethoxysilane
PFTOS 1H, 1H, 2H, 2H-perfluorodecyltriethoxysilane
PHEA Poly (2-hydroxyethyl acrylate)
PHEMA Poly (2-hydroxyethyl methacrylate)
PLA Polylactic acid
Abbreviation Definition
PP Polypropylene
PPMM Polyether pentaerythritol monomaleate
pSBMA Polysulfobetaine methacrylate
pSBVI Polysulfobetaine vinylimidazole
PS Polystyrene
PSS Sodium poly(4-styrenesulfonate)
PTFE Polytetrafluoroethylene
PVA Polyvinyl alcohol
PVAc Polyvinyl acetate
PVC Polyvinyl chloride
PVD Physical vapor deposition
PVDF Polyvinylidene fluoride
PVP Poly vinylpyrrolidone
QC Quaternized cellulose
RE Rare earth
RIE Reactive ion etching
RF Radio frequency
RGO Reduced graphene oxide
RH Relative humidity
ROS Reactive oxidizing species
S Solid phase
SA Sliding angle
SBSi Sulfobetaine silane
Sccm Standard cubic centimeter per minute
SEM Scanning electron microscopy
SIPN Semi-interpenetrating polymer networks
SLAN Sacrificial layer-mediated nanoimprinting
SN2 Substitution nucleophilic bimolecular
SPM Scanning probe microscopies
SSNPs Solid silica nanoparticles
SWSs Subwavelength structures
TD Townsend discharge
TDBD Townsend dielectric barrier discharge
TEOS Tetraethoxysilane
TFAA Trifluoroacetic acid allyl ester
TMCTS 1,3,5,7-tetramethylcyclotetrasiloxane
TMDSO 1,1,3,3-tetramethyldisiloxane
TNB Titanate nanobelts
TPCL Triple phase contact line
OMCTS Octamethylcyclotetrasiloxane
UHV Ultra-high vacuum
V Vapor phase
WCA Water contact angle
Acknowledgements
À travers ces lignes, je souhaite exprimer ma sincère et profonde gratitude à toutes les personnes qui, avec leur soutien scientifique et humain, ont collaboré à la réalisation de ce travail de thèse.
Tout d’abord, je tiens à remercier les membres du jury Luc Stafford, Émile J. Knystautas et Sylvain Coulombe d’avoir accepté de lire et d’évaluer cette longue thèse, et pour tous les commentaires pertinents, les précieuses suggestions et remarques qui en ont découlés. Je voudrais exprimer ma gratitude à mon directeur de recherche, le professeur Gaétan Laroche, pour le dévouement et le soutien qu’il a apporté à ce travail, pour le respect de mes suggestions et idées ainsi que pour la direction et la rigueur qu’il a maintenue tout au long du processus d’élaboration de ma thèse. Je le remercie pour la confiance et l’accueil depuis mon arrivée à Québec. Merci beaucoup à Luc Stafford pour ses conseils et la patience dont il a fait preuve envers moi dans le cadre du cours de physique de plasmas. Sa contribution à cette thèse est très considérable.
Je remercie mes collègues du département de Génie des mines, de la métallurgie et des matériaux, et tout particulièrement Geoffroy Rouget et Geneviève Bruneau qui m’ont toujours apporté un grand soutien moral et humain, nécessaires dans les moments difficiles durant le doctorat, en plus des nombreux litres de café tant appréciés.
Merci à tous mes collègues (amis) du laboratoire d’Ingénierie de Surface (LIS) : Morgane Laurent, Caroline Royer, Laurence Padioleau, Natalia Milaniak, Nawel Ghribi, Souhaila Ghadhab, Saeideh Shokrollahi, Amna Amri, Laurine Martocq, Andrée-Anne Guay-Bégin et Ibrahim Bilem. Le soutien et la joie que vous m’avez transmis au cours de cet ardu chemin me sont très chers. Je vous embrasse fort.
Camasão, Sergio Loffredo, Francesco Copes, Gabriel Morand, Samira Ravanbakhsh, Sergio Piraña, Vanessa Montaño, Linda Bonilla, Daniele Pezzoli, Nina Bono, Lucie Levesque, Caroline Loy… et le big chef, le professeur Diego Mantovani—merci de m’avoir donné la chance de t’assister dans le cours de matériaux de l’ingénieur, entre autres choses J.
À mon cher collègue Carlo Paternoster. Merci pour ton savoir-être, merci d’avoir partagé avec moi tes réflexions sur la vie, sur ce que l’avenir nous réserve, sur la façon dont la vie peut être parfois injuste, etc. Tu ne sais pas à quel point nos conversations au bureau vont me manquer. En ta compagnie, les aléas et les malheurs deviennent bons, la tristesse prend la forme de la joie et la solitude disparaît. Bonne continuation mon ami.
Je ne pourrais pas faire mes remerciements sans dédier quelques mots à mon amie Stéphanie. Ce fût un vrai plaisir de travailler avec toi. Le jour où je t’ai rencontrée, je me suis dit que nous allions très bien nous entendre. Je ne m’étais pas trompé; le temps m’a donné raison. J’espère que nous garderons notre belle amitié à vie.
Un travail de recherche est toujours le résultat des idées et des efforts de personnes qui gravitent autour de nous. Pour cette raison, je remercie sincèrement Jacopo. Je lui suis très reconnaissant pour sa gentillesse, son temps, ses idées et d’avoir facilité la fin de cette thèse.
Grazie mille.
À ma beloved Pascale. Qu’est-ce que j’aurais fait sans toi? Dis-moi. Je te remercie doublement—pour ton professionnalisme et pour tes qualités humaines. Merci pour tes conseils, tes suggestions, les belles discussions et ta présence lors de mes consultations sur le XPS, FTIR et AFM, entre autres. Sans aucun doute, tu as contribué à mon développement professionnel; tu m’as beaucoup appris. Merci pour ton soutien, tes encouragements, ton affection, pour avoir partagé avec moi de nombreux moments heureux et tristes, pour avoir su m’écouter. Bref, pour m’avoir donné de l’amour et de l’amitié depuis mon arrivée.
Un travail de recherche est également le résultat de la reconnaissance et du soutien vitaux offerts par les personnes qui nous accordent de la valeur, sans lesquelles nous n’aurions pas la force et l’énergie qui nous incitent à nous développer en tant qu’individus et en tant que professionnels.
Merci à mon cher Martin. Merci de m’avoir accueilli à bras ouverts à mon arrivée au Québec. Merci de m’avoir fait voir qu’il y a toujours des gens qui ont des valeurs, du cœur et qui sont capables du don de soi sans ne jamais rien attendre en retour. Tu as toujours été là, même si c’était pour m’entendre me plaindre du froid ou pour corriger mes textes en français. Tes réflexions et tes conseils demeurent avec moi.
Merci aux membres de ma famille, car malgré la distance, leurs encouragements, leur soutien et leur joie m’ont donné la force pour avancer et terminer. Javier, mon frère, même si nous sommes très différents, je sais que tu es aussi fier de moi que je peux l’être de toi. Je remercie spécialement ma mère. Je suis qui je suis grâce à toi. Il n’y a pas assez de mots pour décrire à quel point je t’admire. Merci pour ta patience, pour ta compréhension, pour le temps que tu as accordé pour m’encourager et me consoler quand je vivais de mauvais moments.
Une mention spéciale pour celles qui ne sont plus avec moi—ma tante Isabelle et ma grand-mère Marie. Je n’ai pas pu vous dire adieu. Votre absence m’a ramené et ancré plus les pieds sur la terre. Votre absence m’a fait réfléchir sur la fugacité de la vie, la fragilité de l’être humain, l’importance d’aimer et d’être aimé. Je tiens à partager mes pensées avec vous, c’est le moment, c’est mon moment, mon cœur me le demande.
Pendant la jeunesse, on ne pense que très peu au temps. Il n’y a pas de dates éloignées. Le temps n’expire pas. Tout est programmé : les jours, les semaines, les mois et les années. Il n’y a pas de conscience du temps. Il n’y a pas d’abîmes. Lorsqu’on vieillit la fugacité de la vie commence à avoir une signification tangible. Certaines personnes parlent de la fugacité de la vie. Celles qui le font le plus sont les aînés, les malades et les désillusionnés. Pour eux,
ne peut pas reculer le temps. Tout ce qui semblait lointain devient soudainement proche. Ce qui semblait improbable devient palpable. L’impossibilité d’arrêter le temps devient évidente et les pertes deviennent encore plus douloureuses. La certitude qui accompagne l’aphorisme « les limites de la vie » quitte le terrain des mots et devient une réalité.
La fugacité est synonyme d’impuissance et de prélude à une réalité presque toujours triste, sombre et cruelle. L’éphémère n’est pas une condition du temps, c’est une condition de l’être humain et de la mort qui ne cesse jamais de mourir. La manque d’espoir, de joie, d’enthousiasme, de sentiment d’appartenance déterminent la cadence de la marche. Les pages des calendriers tombent très lentement. Le cours du temps n’est établi ni par le désir ni par la volonté; c’est le poids de la tristesse qui tient les rênes. Le temps devient ami ou ennemi, c’est selon.
On remarque la fugacité de la vie lorsque l’inclémence du temps frappe. Les aînés, les malades, les solitaires, et même les bohémiens essaient en vain d’appréhender le temps, car ils savent que le temps ne leur appartient que pour un temps. La phrase « le temps ne pardonne pas » est vraie. Face à la vie qui s’en va, l’impossibilité de capturer les instants devient évidente. Les petites certitudes qui construisent les significations de l’existence disparaissent. Il n’y a pas d’antidote contre la fugacité de l’existence. Il ne pouvait en être autrement: il en va de même avec la mort. Certains écrivent, d’autres peignent, certains dansent, d’autres essaient de dire quelque chose. Ces actions soulagent, tempèrent, mais sans plus.
À tous les jours, je me dis : « Iván la vie est fugace, elle glisse entre tes doigts, elle glisse entre tes mots, profites-en ».