Overbidding in Independant Private-Values Auctions and Misperception of Probabilities
53
0
0
Texte intégral
(2) CIRANO Le CIRANO est un organisme sans but lucratif constitué en vertu de la Loi des compagnies du Québec. Le financement de son infrastructure et de ses activités de recherche provient des cotisations de ses organisations-membres, d’une subvention d’infrastructure du Ministère du Développement économique et régional et de la Recherche, de même que des subventions et mandats obtenus par ses équipes de recherche. CIRANO is a private non-profit organization incorporated under the Québec Companies Act. Its infrastructure and research activities are funded through fees paid by member organizations, an infrastructure grant from the Ministère du Développement économique et régional et de la Recherche, and grants and research mandates obtained by its research teams. Les partenaires / The Partners Partenaire majeur Ministère du Développement économique, de l’Innovation et de l’Exportation Entreprises partenaires Alcan inc. Banque du Canada Banque Laurentienne du Canada Banque Nationale du Canada Banque Royale du Canada Bell Canada BMO Groupe financier Bombardier Bourse de Montréal Caisse de dépôt et placement du Québec Fédération des caisses Desjardins du Québec Gaz Métro Hydro-Québec Pratt & Whitney Canada Raymond Chabot Grant Thornton Autres partenaires gouvernementaux Industrie Canada Ministère des Finances du Québec Ville de Montréal Partenaires universitaires École Polytechnique de Montréal HEC Montréal McGill University Université Concordia Université de Montréal Université de Sherbrooke Université du Québec Université du Québec à Montréal Université Laval Le CIRANO collabore avec de nombreux centres et chaires de recherche universitaires dont on peut consulter la liste sur son site web. Les cahiers de la série scientifique (CS) visent à rendre accessibles des résultats de recherche effectuée au CIRANO afin de susciter échanges et commentaires. Ces cahiers sont écrits dans le style des publications scientifiques. Les idées et les opinions émises sont sous l’unique responsabilité des auteurs et ne représentent pas nécessairement les positions du CIRANO ou de ses partenaires. This paper presents research carried out at CIRANO and aims at encouraging discussion and comment. The observations and viewpoints expressed are the sole responsibility of the authors. They do not necessarily represent positions of CIRANO or its partners.. ISSN 1198-8177.
(3) Overbidding in Independant Private-Values Auctions and * Misperception of Probabilities Olivier Armantier†, Nicolas Treich‡ Résumé / Abstract Nous menons une expérience pour évaluer si le fait qu'un sujet évalue mal ses probabilités de gagner peut être une hypothèse alternative à l’aversion au risque pour expliquer les surenchères lors d'enchères indépendantes privées au premier prix. Les résultats expérimentaux montrent, en effet, que les sujets sous-estiment leurs probabilités de gagner l'enchère et ont tendance à surenchérir. Cependant, lorsqu'on leur présente plus de précisions sur leurs prédictions, les sujets apprennent d'abord à prédire correctement leurs probabilités de gagner, puis à limiter considérablement la surenchère. L'estimation de différents modèles du comportement suggère que i) les sujets sont hétérogènes par rapport à leurs préférences du risque et leurs perceptions des probabilités, ii) les sujets choisissent leur meilleure réponse conditionnellement aux croyances qu’ils révèlent, et iii) bien que nécessaire pour expliquer pleinement le comportement des sujets, l'aversion au risque semble jouer un rôle moins important que prévu. Finalement, nos résultats expérimentaux sont consistants avec un modèle théorique d'enchères standard qui combine l'aversion au risque et la mauvaise perception des probabilités. Mots clés : aversion au risque, enchères, mauvaise perception des probabilités, surenchère We conduct an experiment to test whether probability misperception may be a possible alternative to risk aversion to explain overbidding in independent first-price private-values auctions. The experimental outcomes indicate that subjects underestimate their probability of winning the auction, and indeed overbid. Yet, when provided with feed-back on the precision of their predictions, subjects learn first to predict their probability of winning correctly, and second to curb-down significantly overbidding. The structural estimation of different behavioral models suggests that i) subjects are heterogenous with respect to risk preferences and probability perceptions, ii) subjects tend to bestrespond to their stated beliefs, and iii) although necessary to explain fully behavior, risk aversion appears to play a lesser role than previously believed. Finally, our experimental findings are shown to be consistent with a standard theoretical auction model combining risk aversion and misperception of probabilities. Keywords: auctions, misperception of probabilities, overbidding, risk-aversion Codes JEL : C70, C92, D44, D81 *. We would like to thank Paul Pezanis-Christou, Jordi Brandts, as well as seminar participants at the Institut d’Analisi Economica, the University of Auckland, the 2004 ESEM conference in Madrid, the 2004 ESA conferences in Amsterdam and Tucson, and the 2004 Experimental and Behavioral Economics Workshop in Calgary for helpful discussions. All remaining errors are ours. † Université de Montréal, CIRANO, CIREQ, CRT, Département de sciences économiques, Université de Montréal, C.P. 6128, succursale Centre-ville, Montréal, Québec, H3C 3J7, Canada; [email protected]. ‡ Lerna-Inra, Université de Toulouse, 21 all. de Brienne, 31042 Toulouse, France, [email protected]..
(4) 1. Introduction There is a wealth of evidence indicating that subjects in independent …rst-price private-values auctions tend to bid above the risk neutral bayesian Nash equilibrium (hereafter RNBNE). Although often rationalized by risk aversion, there does not seem to be a consensus in the literature around the cause(s) of overbidding.1 In particular, Goeree, Holt and Palfrey (2002) (hereafter GHP) suggest probability misperception as a possible alternative to risk aversion.2 The object of the present paper is twofold: …rst, we conduct an experiment to establish whether or not subjects perceive correctly their probability of winning the auction; second, we verify whether misperception of probabilities may be considered a driving force behind overbidding. The probability misperception hypothesis may be considered appealing to explain overbidding. Indeed, it has been repeatedly shown in the psychology literature on judgment that individuals have biased perceptions of probabilities. Typically, psychologists have observed a speci…c misperception pattern: individuals overestimate low probabilities, while they underestimate high probabilities.3 Likewise, several individual decision experiments suggest that agents exhibit comparable probability distortion patterns when making risky choices.4 It appears therefore natural to expect that agents may su¤er from similar biases in games where probabilities are involved.5 1. Other potential explanations include a “Joy of winning” (see e.g. Cox, Smith and Walker 1983, 1988), a lack of monetary incentives (the “‡at maximum critique” of Harrison 1989), bidding errors (Kagel and Roth 1992), and asymmetric costs of deviating (Friedman 1992). See also the December 1992 issue of the American Economic Review for a ‡avor of the debate pertaining to the causes of overbidding. 2 Cox, Smith and Walker (1985) were in fact the …rst to propose to study …rst-price auctions with a utility function exhibiting non-linearity in the probabilities. The authors however, only consider a power probability weighting function, and they conclude without further analysis that it is observationally equivalent to a model with risk aversion. 3 See e.g. Sanders (1973), and Murphy and Winkler (1984) for probability forecasting in meteorology; Lichtenstein, Slovic, Fischho¤, Layman and Combs (1978), Viscusi, Hakes and Carlin (1997), and Benjamin, Dougan and Buschena (2001) for predictions of lethal risks; Viscusi and O’Connor (1984), and Gerkins, DeHaan and Schulze (1988) for perception of job related hazards; as well as Hurley and Shogren (2004) for evidence in sterile laboratory experiments. 4 See the numerous references in Camerer (1995) for probability distortion in lottery choices; Ali (1977), and Golec and Tamarkin (1998) for horse track betting evidence; as well as Wakker, Thaler, and Tversky (1997) for probability distortion in insurance decisions. 5 It has been suggested that probability distortion may re‡ect both the misperceptions that agents may have on the probabilities they face, as well as intrinsic preferences over probabilities when making a risky choice (see e.g. Kahneman and Tversky 1979). Following GHP’s suggestion, we concentrate exclusively throughout the paper on probability misperception.. 2.
(5) It is well known however, that the identi…cation of probability perceptions separately from preferences is not trivial. Indeed, di¤erent combinations of beliefs and preferences may generate the same observed behavior. For instance, GHP’s econometric estimation suggests that a model with a sensible constant relative risk aversion parameter, and a model in which risk neutral agents misperceive their probability of winning the auction, both …t bidding choices equally well. GHP therefore conclude that subjects behave “as if ”risk averse, but their auction data do not enable them to establish unambiguously whether this should be attributed to probability misperception or risk aversion.6 Following Manski (2002, 2004), we circumvent this identi…cation problem by simultaneously eliciting choices and subjective probabilities. As a result, we can test directly which of the probability misperception or risk aversion hypothesis, is the most relevant to explain overbidding. The experiment we propose therefore consists in a …rst-price independent private-values auction similar to the one in GHP. In addition, we also ask subjects to predict their probability of winning the auction in order to evaluate the extent of probability misperception. To promote truthful revelation, subjects are rewarded according to the accuracy of their predictions in addition to their auction pro…ts. We conduct two di¤erent treatments di¤erentiated by the feed-back provided to subjects at the end of each round on the precision of their predictions. No information is revealed in treatment 1, while in treatment 2 subjects are informed of the quality of their predictions. The experimental outcomes in treatment 1 indicate that subjects overbid, and underestimate their probability of winning the auction. However, after observing their objective probability of winning, subjects in treatment 2 not only learn to make more accurate predictions, but they also drastically curb-down their tendency to overbid. In fact, bidding above the RNBNE virtually disappears once subjects have learned to predict correctly their probability of winning. To explain the experimental outcomes, we estimate several structural models of noisy behavior. The estimation results suggest that subjects are heterogenous with respect to risk preference and probability perception. In addition, and according with Nyarko and Schotter (2002), we …nd that actions seem to be consistent with beliefs, as subjects appear to “best-respond”to their stated beliefs on their probability of winning. The structural models also suggest that probability 6 Dorsey and Razzolini (2003) face a similar identi…cation problem. Indeed, their experiment suggests the presence of probability misperception in private-values auctions, but they cannot formally con…rm this hypothesis as they do not elicit beliefs.. 3.
(6) misperception is a main source of overbidding, and that risk aversion may play a lesser role than previously believed. In fact, the estimated constant relative risk aversion parameter drops from 0.6 to 0.2 when one accounts for heterogeneity and for the probability misperceptions revealed by subjects. Finally, we con…rm theoretically the link observed in the experiment between probability misperception and overbidding. To do so, we consider a standard independent private-values model combining risk aversion and probability misperception. We show that a class of probability misperception functions, encompassing the distortion identi…ed in our experiment, induces overbidding compared to the RNBNE under perfect perception. The paper is structured as follows: the experimental design is presented in section 2 and discussed in section 3; the experimental outcomes are commented in section 4; di¤erent noisy models of behavior are estimated and compared in section 5; we present in section 6 our theoretical results derived from a standard private-values auction model with probability misperception and risk aversion; …nally section 7 concludes.. 2. The Experimental Design We present in this section the di¤erent experimental treatments. The choices made when designing the experiment are then discussed in a subsequent section. The experiment was conducted with volunteers at the State University of New York at Stony Brook. There were eight experimental sessions, four for each treatment, and each session included 10 subjects and 15 rounds. No subject participated in more than one session. At the beginning of a session, players were assigned to an isolated computer. Subjects were told in advance how many rounds would be played, and they knew that the experiment would not exceed one hour and thirty minutes. Instructions were then read aloud, followed by participants’questions, and a brief training with the computer software.7 As further discussed in section 3, the experimental design is essentially motivated by the following three objectives: …rst, the auction has to be similar to the one in GHP; second, the subjects’behavior in the auction has to be independent from the elicitation of their beliefs about their probability of winning; third, the remuneration scheme must lead subjects to reveal their beliefs as precisely as possible. 7. The complete list of instructions is available in Appendix A.. 4.
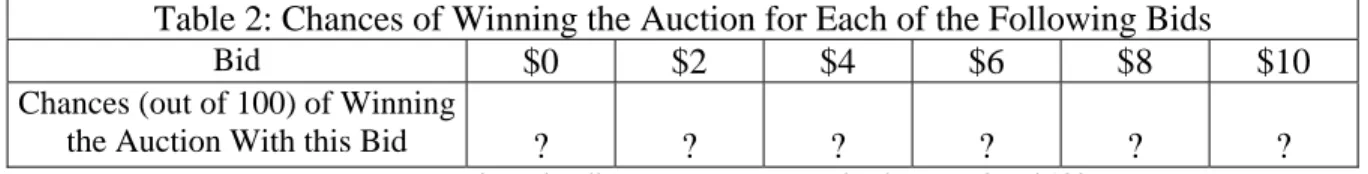
(7) Before describing how the experiment unfolds, we summarize the discrete auction model in GHP. Two players participate in a sealed bid independent privatevalues auction. Each player receives a randomly determined prize-value, which is equally likely to be $0, $2, $4, $6, $8, or $11. The players must simultaneously make a sealed bid, which is constrained to be an integer dollar amount. The prize is awarded to the highest bidder (with ties decided by the ‡ip of a coin), for a price equal to his bid. GHP prove that the unique RNBNE is to bid $0, $1, $2, $3, $4, and $5, for values of respectively $0, $2, $4, $6, $8, and $11. The equilibrium strategy yields subjects an average pro…t of $1.9 per round. In each round, subjects are randomly matched in pairs. To avoid reputation building, the subjects are informed that the assignment is such that it is not possible to identify the other member of the pair. The problem in each round may be decomposed in three phases. In phase 1, the GHP’s auction is implemented in strategy form. In other words, subjects are asked to identify the bid they would make for each possible prize value. They are told that a prize value will be assigned to them at the end of the round, and that their conditional choice in phase 1 corresponding to that value would determine what we called their “e¤ective bid”. Subjects are also informed that the outcome of the auction is decided by comparing the e¤ective bids of the two members of the pair. We emphasized in the instructions that subjects should make careful decisions in phase 1, as their e¤ective bid directly in‡uences their auction payo¤s. In phase 2, subjects are asked to predict their own probability of winning the auction for a given list of bids. A coin ‡ip decides whether all subjects must make their predictions for a list of even bids (i.e. $0, $2, $4, $6, $8 and $10), or uneven bids (i.e. $1, $3, $5, $7, $9 and $11).8 Subjects are asked to express as a frequency (i.e. an integer between 0 and 100) their chances of winning the auction for each of the six bids in the list.9 We carefully explained to participants that their probability of winning with a given bid is equal to the probability that this bid is higher than the e¤ective bid of an average person in the room. We also made them aware that the experiment was designed in such a way that their choices and payo¤s in phase 1 are completely independent of their choices and 8 GHP also conduct a “low cost” treatment with prize values of $0, $2, $4, $6, $8, and $12. Although this “low cost” treatment was likely to generate slightly more overbidding, it would have required to ask predictions for either six uneven bids, or seven even bids. To avoid such asymmetry, we preferred to adopt GHP’s “high cost” treatment. 9 In a series of pilot experiments, we experienced di¤erent mechanisms for subjects to express their beliefs (e.g. a scale, a pie, a comparison with other random events). No substantial di¤erence was identi…ed in the way subjects reported their beliefs (i.e. the distributions of the predictions in the various treatments were not statistically di¤erent).. 5.
(8) payo¤s in phase 2 (and vice-versa). Once every prediction has been submitted, we determine in phase 3 the auction and prediction payo¤s. To do so, we randomly match subjects in pairs. Then, we successively stop by each subject computer station, and roll a 6-sided die to assign a prize value to each participant. As previously mentioned, we determine a subject’s e¤ective bid by matching his prize value with his corresponding conditional choice in phase 1. The e¤ective bids of the member of each pair are then compared, and the auction payo¤s are calculated. To determine the prediction payo¤s, a 6-sided die is …rst rolled once in public. The outcome of the draw determines which of the six integer bids in the list given in phase 2 will be used to measure the accuracy of the subjects’ predictions. The predictions of both members of a pair are compared with an “objective probability” of winning the auction for the bid randomly selected. We carefully explained that this objective probability is calculated precisely by looking at the bid decisions made in phase 1 of that round by all the participants in the room, other than the members of the pair to which the subject belongs. As further discussed in section 3, the objective probability di¤ers across pairs, but it is the same for both members of a pair. The prediction payo¤ is $4 to the member of the pair with the closest prediction to the objective probability for the bid randomly selected. We told subjects that in the event of a tie, the allocation of the $4 would be decided by the ‡ip of a coin. Note that, to promote a similar level of introspection when selecting bids and making predictions, we have arranged so that the number of choices and the expected payo¤s are roughly the same in phases 1 and 2. At the end of the round, the auction outcomes (i.e. the bids of both members and their own payo¤s) are revealed to each member of the pair. This is the only information revealed in treatment 1. In treatment 2, participants are also informed of the quality of their absolute predictions. More precisely, we presented both on a graph and in a table the subject’s predictions along with its objective probabilities of winning for each of the six integer bids in the list given in phase 2. To promote absolute precision, rather than relative precision, we did not reveal to the subjects in treatments 1 and 2 the predictions payo¤s, nor the accuracy of any other participant. In other words, subjects do not know until the end of the session whether their prediction in a given round was more accurate. Following GHP, subjects were paid in cash at the end of the session half of their accumulated earnings. The auction earnings in treatment 1 are comparable to those in GHP (respectively $10.58 versus $10.7 in GHP), but auction payo¤s in treatment 2 are slightly higher ($11.49). The auction pro…ts increase over time in 6.
(9) both treatments (from $9.38 in the …rst three periods to $10.25 in the last three periods of treatment 1, and from $9.00 to $14.06 in treatment 2). Except for the last three periods of treatment 2, auction pro…ts remain signi…cantly smaller than the RNBNE expected pro…t of $14.25.. 3. Comments on the Experimental Design We brie‡y justify in this section some of the choices concerning the experimental design. The …rst objective of the paper is to evaluate whether subjects misperceive their probability of winning the auction. To do so, we compare a player’s predictions with its objective probability, which can only be derived if we observe his (potential) opponents full bidding strategy. Two features of the design allows us to infer the subjects strategies: …rst, the possible private-values are discrete and …nite; second the auction is implemented in its strategic form. As a result, the design allows us to observe the full bidding strategy for any bidder, and therefore we can calculate his opponents’objective probability of winning the auction. In addition, this approach allows us to collect a much larger sample of data in each round than GHP. This additional information will prove helpful in section 5 when we estimate di¤erent behavioral models. Note that it has been argued, that the strategy method may generate di¤erent behaviors in certain experimental games (see e.g. Roth 1995). For instance, it is conceivable that a subject may regret his bid selection in phase 1 when he observes the actual prize value assigned to him. To prevent such a problem, we emphasized to subjects that they had to select their bids carefully in phase 1, as one of them would directly in‡uence their auction payo¤s. Moreover, we shall see in section 4 that a comparison with the experimental outcomes obtained by GHP under the extensive implementation of the game does not indicate any signi…cant treatment e¤ect.10 How to elicit subjective probabilities is a question that has been often debated among psychologists, statisticians and economists. Two desired properties are di¢ cult to reconcile when devising a mechanism: the ease of implementation and the theoretical properties. Most psychologists (and some economists) believe that, if asked, subjects will reveal their best estimates.11 Economists are in general concerned that such a simple approach may not incite subjects to report their 10. Selten and Buchta (1999), as well as Pezanis-Christou and Sadrieh (2003) adopted an essentially comparable strategy method in an auction experiment. According with our results, they did not identify the presence of a signi…cant treatment e¤ect. 11 See e.g. Lichtenstein et al. (1978), Viscusi et al. (1997), as well as Manski (2004) and the references therein.. 7.
(10) true probabilities. Instead, economists often prefer to use “proper” scoring rules for which payo¤s are maximized by truthful revelation (see e.g. De Finetti 1965, Murphy and Winkler 1970, Savage 1971). It is well known however, that this procedure is not incentive compatible when subjects’expected utilities are nonlinear in payo¤s and/or in probabilities, as it will turn out to be the case in our experiment. In addition, scoring rules do not necessarily encourage a subject to assess as precisely as possible his subjective probability since i) most scoring rules are essentially ‡at around the optimum, and ii) untruthful assessments can secure higher minimum payo¤s. Scoring rules however, have been mostly criticized for their complexity to be fully comprehended by non-professional forecasters (Hogarth 1987, Wilcox and Feltovich 2000, or Read 2003).12 More importantly, recent evidence suggest that eliciting beliefs during the course of a repeated game experiment with intrusive procedures such as scoring rules, may alter the way subjects play the game (Croson 2000, Camerer, Ho and Chong 2001, Rutström and Wilcox 2003). Since no conclusive evidence indicates that scoring rules generate signi…cantly more accurate predictions (Camerer and Hogarth 1999, or Sonnemans and O¤erman 2001), some economists have preferred to abandon this approach in favor of simpler methods more transparent to subjects (e.g. Dufwenberg and Gneezy 2000, Croson 2000, Wilcox and Feltovich 2000, Charness and Dufwenberg 2003). Likewise, we adopt a simple method consisting in comparing subjects predictions, and rewarding only the closest to the objective probability. This technique is commonly used in practice to obtain accurate estimates, and it has been shown to be incentive compatible for subjects with uniformed priors (Ottaviani and Sørensen 2003).13 In fact, only 3 out of the 80 participants declared in a post-experiment survey that they did not systematically try to report their best estimates.14 In addition, we will see that our elicitation procedure is further validated by the fact that the probabilities reported by subjects are consistent with their actions.15 12 In fact, several experimental studies based on scoring rules merely ask subjects to trust the experimenter that truthful revelation is their best strategy (see e.g. O¤erman, Sonnemans and Schram 1996, O¤erman 2002, Costa-Gomez and Weizsäcker 2004). 13 Examples of practical implementations of this method include the National Collegiate Weather Forecasting Contest, the Earthquake Prediction Contest, the Federal Forecasters Forecasting Contest, or the Wall Street Journal semi-annual forecasting survey. 14 In addition, 79 out of 80 subjects declared that they perfectly understood the prediction payment mechanism. In contrast, only 28 out of 40 subjects declared that they systematically provided their best estimates, and 18 out of 40 subjects declared that they perfectly understood the prediction payment mechanism, in a comparable experiment conducted with a quadratic scoring rule. 15 For the sake of completeness, we conducted a series of additional sessions with a quadratic scoring rule. The results obtained, although slightly noisier, are not substantially di¤erent from the one presented here. In other words, our conclusions appear to. 8.
(11) Let us now discuss how subjects’predictions are induced independently from their bidding behavior. A possible strategy may consist in comparing every subject’s prediction with a single objective probability of winning, which in this case would be the average probability of winning calculated with the bids of all participants. However, the decisions and payo¤s of a player in phases 1 and 2 are not independent in this situation, since his bidding decisions in phase 1 in‡uence the objective probability of winning. In this context, one could conceivably imagine that a player may submit absurd bids in phase 1, to skew knowingly the probability of winning and improve his chances of winning the prediction reward in phase 2. The payment scheme adopted in our experiment do not su¤er from this drawback. Indeed, a subject’s prediction is compared to an objective probability based on the actions of all participants except the members of the pair to which he belongs. Therefore, the members of a given pair cannot in‡uence with their bidding decision in phase 1 the objective probability to which they will be compared. In other words, an individual’s payo¤s and actions in phase 1 cannot a¤ect his payo¤s and actions in phase 2 (and vice versa). We also strived to …nd an appropriate balance between collecting as much information as possible, and requiring a similar amount of introspection in each of the bidding and prediction phase. As a result, we do not ask subjects to make a prediction for each of the twelve bids between $0 and $11. Instead, we opted to ask subjects to submit six bids in phase 1, and to make a prediction for a list of six even or uneven bids in phase 2. A drawback of this approach is that we do not observe the full probability weighting function (hereafter PWF) for each subject. However, note that in each period, the unobserved predictions (e.g. the list of uneven bids) are equally spaced between the answers provided by subjects (e.g. the list of even bids). Therefore, we can easily infer unobserved predictions in our subsequent analysis by applying simple interpolation techniques. We did not want subjects to infer any information from the questions asked during a round. For instance, we could have asked subjects to predict their probability of winning for a single bid. This approach would have yielded much less information, but more importantly, we were concerned that subjects may interpret this as a signal from the experimenter that they should have selected this bid. Instead, we preferred to ask predictions for either even or uneven bids, which we believed would be less likely to send any signal. be robust to the elicitation method employed. A summary of the experimental outcomes under the quadratic scoring rule may be found on one of the authors’ website at http://www.sceco.umontreal.ca/liste_personnel/armantier/index.htm.. 9.
(12) Finally, the objective of the paper is not only to test for the presence of misperception, but also to compare the explanatory power of the probability misperception and risk aversion hypotheses. When designing treatment 2, our contention was that, given the …nancial incentives, providing feed-back on the accuracy of their predictions should help subjects correct their perception bias (if any). This contention was motivated by experiments in psychology showing that training may signi…cantly reduce judgement errors (see e.g. Fischho¤ 1982). If predictions biases could be totally eradicated, then we could perfectly distinguish between probability misperception and risk aversion. Indeed, the probability misperception hypothesis would have little credit, if overbidding remains prevalent even though subjects have correct estimates of their probability of winning. However, if overbidding is eliminated when perceptions are accurate, then this would indicate that risk aversion may not be the primary source of overbidding as previously believed. Although we did not expect to eradicate totally perception biases, we believed that a partial correction would help us better disentangle risk aversion from probability misperception.. 4. Experimental Outcomes 4.1. Treatment 1 The experimental outcomes observed in treatment 1 are summarized in Tables 1 to 3, as well as Figures 1, 3 and 5. Figure 1 displays on the X-axis a subjects’ objective probabilities of winning the auction, and on the Y-axis the subjects’ predictions in treatment 1 (averaged across periods and subjects). The …gure actually consists of twelve consecutive dots, representing the predictions for integer bids ranging from $0 to $11. For instance, the …rst dot on the left corresponds to the predicted probability of winning with a bid b = 0. The diagonal has also been plotted to guide the eye. If subjects make unbiased predictions, then their stated probabilities should fall around the diagonal. Figure 1 indicates that subjects systematically underestimate their probability of winning for any bid between $0 and $11. The underestimation is in fact quite signi…cant for a large number of bids. For instance subjects believe that their probability of winning with a bid b = 3 and b = 5 (the RNBNE bids for a private-value of v = 6 and v = 11) are respectively 19.66% and 44.86%, while the actual probabilities are 47.38% and 74.08%. It is interesting to note that, although we …nd a slight evidence of overesti10.
(13) mation for the lowest bid (i.e. b = 0) during the …rst three periods, subjects’ predictions did not produce the S-shape pattern of misperception commonly observed in the psychology literature (see e.g., Camerer, 1995). This observation is consistent with GHP whose results also suggest that the PWF may be convex everywhere. In other words, it appears that subjects in our experiment are pessimists, and do not exhibit the traditional bias (i.e. overestimate small probabilities and underestimate large probabilities). Similar evidence has been detected in other experimental studies (e.g. Schotter and Sopher 2001 identify pessimistic beliefs in an ultimatum game experiment), as well as …eld studies (Giordani and Soderlin 2003 show that professional forecasters have been historically pessimistic in their predictions of GDP). Our experimental results may therefore raise the question of the relevance of S-shaped PWF to apply to private-values auctions, and may be more generally to game situations. No evidence of learning may be detected in Figure 1. Indeed, the predictions in the …rst and last three periods appear indistinguishable. This observation is only partially con…rmed by the estimation of an econometric model in which the predictions stated by subjects are assumed to be drawn from a normal distribution truncated on [0; 100].16 The expected predictions are modeled as h i E Pbi;b;t = b 1 + 5b P>5 + 10 ; (4.1) b P>10 + i where Pbi;b;t is the prediction of player i = 1; :::; 10 in period t = 1; :::; 15 regarding his probability of winning the auction with a bid equal to b = $0; :::; $11; (P>5 ; P>10 ) are two dummy variables de…ned such that P>5 (respectively P>10 ) equals one when t > 5 (respectively t > 10), and equals zero otherwise; b ; 5b ; 10 b are parameters to be estimated;17 and i is a normally distributed individual random e¤ect with mean zero and variance 2 .18 Finally, to account for possible heteroskedasticity across predictions for di¤erent bid values and/or di¤erent time periods, we model the standard deviation of the predictions as Std Pbi;b;t =. j. 1. bj 2 t. 3. :. (4.2). 16 The truncation re‡ects the fact that subjects’ predictions must necessarily lay between 0 and 100. 17 The parameter b may be interpreted as the initial average prediction for a bid b, while 5b and 10 b represent the average percentage deviation in the predictions stated for a bid b after respectively 5 and 10 periods. 18 To identify the presence of learning, a non-linear speci…cation of the form (4.1) was preferred to a more traditional linear regression with time trends, because it enables i) to compare the speed of learning between early and late periods, and ii) to compare the speed with which subjects adjust their bids, and the speed with which subjects adjust their predictions.. 11.
(14) This speci…cation of the variance is quite ‡exible and it allows in particular i) for subjects to learn to make more homogenous predictions with time (i.e. 3 < 0); and ii) for predictions to be more homogenous for low and high bids (for which most predictions are likely to be close to 0 and 100) than for intermediate bids (i.e. 1 2 [0; 11] and 2 < 0 in which case the variance has an inverse U shape). The results of the maximum likelihood estimation presented in Table 1 indi5 10 cate no systematic adjustment, as most estimated parameters bb ; bb are not. signi…cantly di¤erent from zero.19 Subjects however appear to learn to lower their 5 predictions for small bids after the …rst …ve periods, since bb is signi…cantly smaller than zero for b = 0; :::; 4. In fact, the reduction in the stated probabilities may be quite consequent. For instance, when asked to predict their probability of winning for a bid b = 0 (respectively b = 1), subjects lower their predictions by 55:1% (respectively 43:9%) after the …rst …ve periods, and an additional 24:7% (respectively 16:5%) after period 10. This decrease is consistent with reinforcement learning, as most subjects did not witness during the experiment any auction won by a bidder submitting a bid of 0 or 1.20 In other words, the only evidence of learning we …nd is that subjects quickly reduce their predictions for small bids. The estimates of the parameters controlling the variance of the predictions are presented in Table 2. We …nd that b1 is almost centrally located in [0; 11] ; while b2 is signi…cantly lower than zero. As expected, this implies that the variance of the predictions has a nearly symmetrical inverse U-shape. In other words, predictions are more homogenous for bids with which bidders are almost certain to loose or to win the auction (i.e. low and high bids). The variance of the predictions, however, does not seem to contract with time, as b3 is found to be insigni…cant. Finally, we identify substantial heterogeneity within the subjects’pool as b2 , the variance of the individual random e¤ect, is found to be signi…cant and relatively large. For instance, a subject with an individual e¤ect equal to one standard deviation ( i = b ) will submit predictions 12:2% larger than the average bidder (for whom i = 0). Let us now turn to the bids submitted in treatment 1. The average bids actually submitted for each possible private-value (red line) may be compared in 19. Throughout the paper the estimates’standard deviations, and the distributions of the test statistics have been evaluated by bootstrap, in order to control for the …niteness of the sample (see Shao and Tu 1995). Note also that the regressions in this section have also been conducted with dummy variables identifying the session in which the subjects participated. No signi…cant session e¤ect has been detected. 20 Out of the 300 auctions conducted during the four sessions of treatment 1, 2 were won by a bidder submitting a bid of 0, and 9 by a bidder submitting a bid of 1.. 12.
(15) Figure 3 with the RNBNE (black line). The …gure con…rms that except for low private-values (i.e. v = 0 and v = 2) subjects tend to bid signi…cantly higher than the RNBNE. This result does not necessarily imply that subjects are either risk averse, or not perfectly rational. Indeed, even though subjects do not submit the RNBNE, it is entirely possible that they best-respond to their opponents actions, or that their choices are consistent with their beliefs. To explore these hypotheses, two additional bid functions are also plotted in Figure 3. The blue line represents a subject’s risk neutral objective best-response. In other words, it represents what a risk neutral agent should bid if he knew or could infer correctly the other participants actions. The orange line represents a subject’s risk neutral subjective best-response. In other words, it represents what a risk neutral agent should bid conditional on her stated beliefs regarding her probability of winning the auction.21 Figure 3 indicates that subjects overbid compared to their objective best-responses. Their actions however, appear to be quite consistent with their beliefs. Indeed, the average bids submitted for the di¤erent private-values are only slightly higher than the subjective best-responses.22 The previous results con…rm that subjects cannot be assimilated to perfectly rational risk neutral agents since they do not comply with either the RNBNE, or their objective risk neutral bestresponses. Subjects however, may not be far from risk neutral utility maximizers, since their actions are close to their subjective risk neutral best-responses. Nevertheless, the slight overbidding remaining may still be explained by risk aversion, although it would suggest that risk aversion may play a lesser role than previously believed. This conjecture will need to be statistically con…rmed in section 5 when we estimate noisy behavioral models. Figure 5 indicates that, if anything, subjects learn to increase slightly their bid over time. This observation is con…rmed by the estimation of an econometric model in which the bids are assumed to follow a normal distribution truncated on [0; 11], and the expected bids are modelled as E [Bi;v;t ] =. v. 1+. 5 v P>5. +. 10 v P>10. +. i. ;. (4.3). where Bi;v;t is the bid submitted by player i = 1; :::; 10 in period t = 1; :::; 15 for a 21 Unlike previous private-values experiments we can compare subjects’ choices with their objective and subjective best-responses. Indeed, two features speci…c to our design enable the calculation of these best-responses: …rst, the auction is implemented in strategic form; second, we elicit subjects’beliefs about their probability of winning. 22 This observation is consistent with Nyarko and Schotter (2002), as well as Bellemare, Kröger and van Soest (2005) who …nd that subjects’actions appear to me more compatible with their subjective rather than their objective best-responses.. 13.
(16) private-value v 2 f0; 2; 4; 6; 8; 11g.23 The remaining parameters and variables are de…ned as in equation (4.1). Finally, the standard deviation of the bids is also modeled as Std (Bi;v;t ) = j 1 vj 2 t 3 : (4.4) The maximum likelihood outcomes in Table 1, indicate that subjects only learn to increase their bids signi…cantly for private-values equal to v = 4 and v = 6. In other words, we cannot …nd conclusive evidence of systematic strategy adjustment. The estimates of the standard deviation parameters in Table 2 indicate that i) the variance of the bids increases with the private-value v (i.e. b1 is insigni…cant and b2 is positive), ii) subjects’behavior does not become more homogenous with time (i.e. b3 is insigni…cant), and iii) there is signi…cant heterogeneity between subjects in their bid selection (i.e. b is signi…cantly larger than zero). In particular, a change of one standard deviation in the random e¤ect results in a 14:8% variation in the bids of an individual across all possible values. The frequency with which subjects submitted the correct RNBNE bid for a given private-value is reported in Table 3. This table shows that although subjects select the RNBNE bid 98:67% and 94:67% of the time for the lowest private-values of v = 0 and v = 2, they very rarely submit the RNBNE bid for the highest privatevalues of v = 8 and v = 11 (respectively 12:17% and 5:67%). These percentages vary only slightly between the …rst and last three periods, which further con…rms that subjects do not learn to play the RNBNE bids. The last column of Table 3 represents the frequency with which subjects submit the entire RNBNE bid function (i.e. B(0) = 0, B(2) = 1, B(4) = 2, B(6) = 3, B(8) = 4 and B(11) = 5). The correct RNBNE strategy has been chosen only 1:00% of the time overall, but there seems to be a slight increase between the …rst and last 3 periods from 0:83% to 4:17%. Finally, note that the auction outcomes in treatment 1 appear to be both qualitatively and quantitatively consistent with those in GHP. In other words, implementing the auction in strategy form, and asking subjects to predict their probability of winning did not appear to introduce any signi…cant treatment effect. This result is consistent with Rutström and Wilcox (2003) who suggest that eliciting beliefs with a non-intrusive procedure does not a¤ect signi…cantly the way subjects play a game (see also Nyarko and Schotter 2002). 23 Note that although bidding is not constrained to [0; 11], we did not observe any bid outside this interval during the experiment.. 14.
(17) 4.2. Treatment 2 The experimental outcomes observed in treatment 2 are summarized in Tables 1 to 3, as well as Figures 2, 4 and 6. Figure 2 shows that providing feed-back has a dramatic e¤ect on the accuracy of subjects predictions. Indeed, although predictions in the …rst three periods are roughly similar to treatment 1, we see in Figure 2 that subjects make nearly unbiased estimates of their probability of winning during the last three periods of treatment 2. This observation is con…rmed by the estimation of an econometric model speci…ed as in (4.1) and (4.2). Indeed, Table 1 indicates that subjects’ predictions for all possible bids increase rapidly after the …rst …ve periods, and keep increasing, although at a slower pace, after period 10. For instance, when asked to predict their probability of winning for a bid b = 2, subjects increase their predictions by 41:2% after the …rst …ve periods, and an additional 12:2% after period 10. In other words, from the feed-back provided, subjects in treatment 2 appear to learn to correct their probability misperception over time.24 This result seems to contrast sharply with the outcomes in treatment 1. To con…rm statistically the presence of a treatment e¤ect, we estimate a model in which the predictions stated by subjects in treatments 1 and 2 are assumed to be drawn from a normal distribution truncated on [0; 100]. The standard deviations of the predictions are speci…ed as in (4.2), while the means are now de…ned as i h i h 5 e10 T2 P>10 + ; + E Pbi;b;t = b + eb T2 1 + 5b + eb T2 P>5 + 10 i b b (4.5) where T2 is a dummy variable equal to 1 when the observation was collected in treatment 2. The model is estimated by maximum likelihood with the joint sample consisting of the data collected in treatments 1 and 2. The estimation results in Table 4 indicate that subjects’ predictions in the early periods of treatments 1 and 2 are nearly indistinguishable. Indeed, except for b = 1 and b = 2, the 24 Although subjects were explicitly warned that the objective probabilities were likely to change in successive rounds as other players modify their bidding behavior, a possible strategy for a subject in treatment 2 could be to report the probabilities revealed to him by the experimenter in the previous round. The plausibility of this hypothesis is in part a¤ected by the fact that subjects have a 50% to make predictions for a di¤erent list of bids (either even or uneven bids) in two consecutive rounds. Inspection of the data also reveals that when a subject has to make predictions for the same list of bids in rounds t and t 1 (respectively, t 2), his prediction for a given bid in round t equals the probability revealed to him by the experimenter in round t 1 (respectively, t 2) only 7:2% (respectively, 3:8%) of the time. In other words, it appears that subjects do not simply copy the feed-back provided by the experimenter, but instead use this information to learn to correct their misperceptions.. 15.
(18) parameters eb are not signi…cantly di¤erent from zero. With time however, subjects in treatment 2 learn to make substantially higher predictions than subjects 5 10 in treatment 1, since most of the parameters eb and eb are signi…cantly greater than zero. Let us now turn to the bidding behavior of subjects in treatment 2. Figure 4 indicates that on average subjects still bid above the RNBNE, although overbidding is slightly less prominent than in treatment 1. Figure 4 however, only tells one part of the story. Indeed, Figure 6 shows a dramatic reduction of overbidding over time. Although the bids submitted during the …rst three periods are comparable in treatments 1 and 2, subjects in treatment 2 learned to reduce drastically their bids. In fact, during the last three periods of treatment 2 only the bids submitted for high private-values exceed slightly (on average) the RNBNE. For instance, for the highest private-value v = 11, subjects submitted instead of the RNBNE b = 5, an average bid of 5.29 during the last three periods of treatment 2, compared to 6.57 in treatment 1. This treatment e¤ect is con…rmed by a maximum likelihood estimation similar to the one conducted in Section 4.1 where the expected bids are now de…ned as i h 5 10 5 10 e e e E [Bi;v;t ] = v + v T2 1 + v + v T2 P>5 + v + v T2 P>10 + i ; (4.6) the standard deviations are speci…ed as in (4.4), and the exogenous variables are de…ned as in (4.5). Table 4 corroborates the fact that subjects in treatment 2 learned to make lower bids than subjects in treatment 1, since most of the 5 10 parameters ev and ev are signi…cantly smaller than zero. The last two columns of Table 1 also indicate that subjects in treatment 2 adjust their strategy at a slower, but more constant pace than their predictions. Indeed, we have just seen that subjects in treatment 2 essentially adjust their predictions within the …rst …ve periods (the average percentage increase in the predictions is 20:8% within the …rst …ve periods and an additional 6:2% during the last 5 periods). In contrast, the magnitude of the strategy adjustment is basically comparable after 5 and 10 periods (the average percentage decrease in the bids submitted is 8:6% within the …rst …ve periods and an additional 6:8% during the last 5 periods). In other words, subjects tend to …rst correct their misperceptions, and then adjust their bidding behavior accordingly. The asymmetry between the prediction and strategy learning speeds may explain why, in contrast with treatment 1, subjects do not appear to best-respond to their beliefs in treatment 2. Indeed, Figure 4 indicates that on average subjects in treatment 16.
(19) 2 bid above their risk neutral subjective best-response. Note however, that after the adjustment period (i.e. by the end of the session) subjects actions, subjective and objective risk neutral best-responses become consistent, since perceptions are almost unbiased, and behavior nearly conforms with the RNBNE. Finally, one of the most striking di¤erence between treatments 1 and 2 may be found in Table 3. Indeed, we can see that during the last three periods of treatment 2, subjects submitted much more frequently the RNBNE bids for each possible private-value. For instance, subjects submitted the RNBNE bid b = 3 for a private-value v = 6, 88:33% of the time in treatment 2, versus only 13:33% of the time in treatment 1. Even more remarkable, subjects precisely complied with the RNBNE bid function 41:67% of the time in the last three periods of treatment 2, versus 4:17% of the time in treatment 1. To summarize, subjects overbid and underestimate their probability of winning in treatment 1. From the feed-back provided in treatment 2, subjects …rst learn to correct their misperceptions, and then nearly eliminate their tendency to overbid. This treatment e¤ect is not as surprising as it may …rst appear. Indeed, it seems natural that the feed-back and the …nancial stimulus lead subjects to correct their misperceptions. Then, we can reasonably expect a subject to lower his bids, once he realizes that his probability of winning with any given bid is higher than he previously believed. For instance, when a subject realizes that he is virtually guaranteed to win the auction with a bid of b = 5 or b = 6, he should be very unlikely to submit a higher bid.. 5. Noisy Behavioral Models Although the experimental outcomes just presented suggest that risk aversion may play a lesser role than previously believed, we can only con…rm this conjecture statistically by estimating a behavioral model. We adopt the Quantal Response Equilibrium concept (QRE hereafter) developed by McKelvey and Palfrey (1995) to model “noisy” decision making. This equilibrium concept has been shown to be powerful to organize behavior in numerous experimental settings.25 The QRE approach is based on two key principles: behavior is random, and the probability to choose an action increases with the expected utility this action may yield. In other words, agents are not expected to select systematically their best-responses, but they play these strategies with a higher frequency. A Nash-like condition on 25 See e.g. McKelvey and Palfrey (1995, 1998), Yi (2001), Capra, Goeree, Gomez, and Holt (2002), Anderson, Goeree and Holt (2002), as well as GHP.. 17.
(20) the consistency of actions and beliefs is then imposed to determine the QRE choice probabilities. We present in the following two versions of the model adapted to our auction experiment. The …rst version assumes that agents are homogenous, while the second takes into consideration the possibility that agents may be heterogenous with respect to risk preference and probability perception. 5.1. Quantal Response Models with Homogenous Agents Consider the power function probabilistic choice rule adopted by GHP. Under the assumption that weakly dominated strategies (e.g. bidding above one’s own private-value) are excluded, the probability that an agent i with a private-value v selects a bid b 2 f0; 1; :::; vg when facing an opponent j may be written fE [U (b; v) j Pj ]g1= Pi (b j v) = v 1 io1= Xn h e E U b; v j Pj. (5.1). ;. e b=0. where U (:) denotes the individual indirect utility function, Pj is the vector of choice probabilities selected by agent i’s opponent, and > 0 is a “noise parameter” re‡ecting the sensitivity of the choice probabilities to expected utilities. A large yields essentially random behavior, while close to zero implies Nash-like behavior since best-response strategies are chosen with a probability close to one. Following GHP, we assume that subjects are homogenous and exhibit constant relative risk aversion: (v b)1 r U (b; v) = ; 1 r where r 2 [0; 1[ is the Arrow-Pratt coe¢ cient of relative risk aversion common to all subjects.26 In this model the actual probability that bidder i wins the auction with a bid b against an opponent j may be written PiW (b) =. 1 6. X. X. v2f0;2;4;6;8;11g e b<b. 1 Pj eb j v + 12. X. v2f0;2;4;6;8;11g. Pj (b j v). ;. 26 The GHP discrete auction model does not have a bayesian Nash equilibrium in pure strategy for every possible value of the risk aversion parameter r. Therefore, it will not be possible to estimate a bayesian Nash equilibrium model under risk aversion, as a possible alternative to the QRE.. 18.
(21) where the …rst term represents the probability that agent j bids below b when receiving one of the six possible private-values, and the second term represents a favorable coin ‡ip in the event of a tie. Following GHP, we also assume that subjects misperceive their probability of winning the auction homogeneously according to the PWF proposed by Prelec (1998): PiW (b) = exp ln PiW (b) ; (5.2) where > 0 and > 0 are parameters to be estimated. Note that this PWF can display the typical S-shape pattern for speci…c values of ( ; ), and agents have perfect perceptions when ( ; ) = (1; 1). Agent i expected utility when bidding b for a private-value v is then de…ned as : E [U (b; v) j Pj ] = U (b; v) PiW (b) The symmetric QRE choice probabilities are then such that Pi (b j v) = Pj (b j v) = P (b j v). 8v 2 f0; 2; 4; 6; 8; 11g ; 8b. v:. Since the private-values and bids are discrete and …nite, we can …nd the QRE choice probabilities for any combination of ( ; r; ; ) by replacing Pi and Pj by P in (5.1), and solving numerically the resulting …xed-point problem. The di¤erent structural parameters may then be estimated by standard maximum likelihood techniques, in which a subject’s actions are compared with their corresponding QRE probabilities of choice: L ( ; r; ; ) =. Y. i;v;t;b. I. [P (b j v)] [Bi;v;t =b]. ;. where Bi;v;t is the bid actually submitted by bidder i for the private-value v at period t, and I[Bi;v;t =b] is the indicator function verifying I[Bi;v;t =b] = 1 when Bi;v;t = b, and I[Bi;v;t =b] = 0 otherwise. To compare our results with those of GHP, we start by estimating the QRE model using only the data collected in the auction phase. In other words, we ignore for the moment the predictions made by subjects about their probability of winning. Table 6 reports the estimates of the three models considered by GHP. Namely, we estimate a QRE model with risk aversion and perfect perception, a QRE model with risk neutrality and perfect perception, and a QRE model with probability misperception and risk neutrality. As noted in the introduction, the 19.
(22) risk aversion parameter r cannot be identi…ed separately from the parameters of the PWF ( ; ) when one relies only on the auction data.27 At this point, this prevents us from estimating a more general QRE model including simultaneously probability misperception and risk aversion. Such a model will be estimated next when we utilize the subjects’predictions in addition to the auction data. Let us …rst concentrate on the estimation results for treatment 1. Table 6 indicates that the estimation of the QRE model with risk aversion is consistent with GHP’s results. Indeed, we estimate the noise and risk aversion parameters to be (b; rb) = (0:067; 0:611), versus (0:08; 0:55) in GHP. Our results are also compatible with recent estimates of the relative risk aversion parameter in privatevalue auctions.28 According with GHP, we …nd that a QRE model under risk aversion generates a considerably higher log-likelihood (-2,856 versus -5,017 under risk neutrality), thereby clearly rejecting the risk neutrality hypothesis.29 Finally, the estimation of a risk neutral QRE model with probability misperception yields a PWF of the form (P ) = P 2:45 , closely matching the quadratic PWF obtained by GHP. The similitude between the estimates in Table 6 and in GHP reinforces the conjecture that implementing the auction in strategy form, and asking subjects to make predictions did not introduce any signi…cant treatment e¤ect. It also con…rms the ability of the QRE to explain behavior with a parsimonious model in two di¤erent experimental analyses. The estimated results in treatment 2 vary slightly compared to treatment 1, but remain within the same order of magnitude. For instance, the noise parameter in the risk averse QRE model increases slightly in treatment 2 (0:117), while the risk aversion parameter becomes lower (0:497). These di¤erences may be partially explained by the dual adjustment process taking place in treatment 2, as subjects …rst learned to correct their predictions, and then to adjust their strategies. We now turn to the estimation of a QRE model combining probability misperception and risk aversion. The econometric analysis proceeds in two steps. In step 1, we use the probabilities of winning predicted by the subjects during the experiment to estimate by maximum likelihood the PWF parameters ( ; ) in the 27 Indeed, observe that the two sets of parameters ( ; r; ; ) and (k ; k (r 1) + 1; ; k ), where k > 0, yield the same choice probability in (5.1). 28 See e.g. Cox and Oaxaca (1996), Chen and Plott (1998), Campo, Perrigne and Vuong (2000), as well as Pezanis-Christou and Romeu (2003) who structurally re-estimate the risk aversion parameters from several published experimental studies. 29 A formal likelihood ratio test for nested hypotheses yields a test statistics of 4,321.653, much larger than 3.841, the asymptotic critical value corresponding to the signi…cance level 0.05. In fact, any test of the risk neutrality hypothesis in Tables 6 to 10 yields P -values inferior to 10 50 . Therefore, these P -values and the corresponding test statistics will not be reported in the text.. 20.
(23) model. Pbi;b;t = exp. W ln Pi;t (b). +. i;b;t. ;. (5.3). where Pbi;b;t is the prediction of player i in period t regarding his probability of W winning the auction with a bid equal to b, Pi;t (b) is the actual probability that bidder i wins the auction given the bids submitted by the other subjects in round t, and i;b;t is a normal error term with variance 2 . In step 2, using the PWF estimated in step 1, we estimate the structural parameters ( ; r) in a QRE model with probability distortion. As previously shown however, subjects in treatment 2 learned to correct their misperceptions over time.30 Therefore, the shape of the PWF is likely to di¤er signi…cantly between the …rst and last periods. To account for this possibility, the PWF has been successively estimated in step 1 with data collected during the entire experiment (i.e. 15 periods), and with the data collected during the last …ve periods only. The estimation results in step 1 are presented in Table 7. The parameters ( ; ) are signi…cantly lower than (1; 2), which implies that, although of similar shape, the PWF is di¤erent from the one suggested by GHP. As expected, the PWF estimated with the last …ve periods of treatment 2 is ‡atter, re‡ecting the fact that subjects make nearly unbiased estimates. The estimated parameters however, are signi…cantly di¤erent from ( ; ) = (1; 1) which corresponds to the absence of probability distortion. In other words, although nearly unbiased, subjects’ predictions in the last …ve periods of treatment 2 remain imperfect. The parameters estimated in step 2 are summarized in Table 8.31 The …rst element to note is that the log-likelihoods of the QRE models with risk aversion and risk neutrality are smaller in Table 8 than in Table 6. To test formally which of these models prevail we adopt the speci…cation test proposed by Vuong (1989) for non-nested hypotheses. A test therefore consists in comparing the speci…cation of one of the models estimated with the data collected during all 15 periods in Table 8, against the speci…cation of its analog in Table 6. For the risk aversion models in treatments 1 and 2, the adjusted test statistics are respectively 3:929 30 Although the estimated values of ( ; ) may change signi…cantly between the early and late periods, the distribution of i;b;t appears to remain roughly constant over time. In particular, a model in which the variance is speci…ed as in (4.2) is rejected in favor of the homoscedastic speci…cation proposed in (5.3) on the basis of a likelihood ratio test (the P -value is 0:256 in treatment 1 and 0:146 in treatment 2). The data, however, provide evidence of heterogeneity across subjects which we will account for in the next sub-section. 31 Note that the standard deviations in table 8, as well as the test statistics, are robust to the errors generated by the estimation of the PWF in step 1.. 21.
(24) and 4:260, which correspond to P-values of 1:36E 5 and 6:83E 6.32 For the risk neutral models in treatments 1 and 2, the adjusted test statistics are respectively 18:322 and 6:057, which correspond to P-values of 2:39E 32 and 6:71E 10. Therefore, one can clearly reject at the usual signi…cance level the pure QRE speci…cations in Table 6, in favor of the corresponding QRE models with probability misperception in Table 8. In other words, taking into consideration the subjects’ predictions improves signi…cantly the …t of the QRE model. Next, observe that the estimations of the risk aversion parameter decrease sharply compared to Table 6. For instance, the risk aversion parameter estimated with the entire sample collected in treatment 1 drops from 0:611 to 0:375 when accounting for the stated predictions. Even more remarkably, this parameter is estimated at 0:234 during the last …ve periods of treatment 2. This does not imply, however, that agents behaved as if risk neutral. Indeed, a comparison of the log-likelihoods in Table 8 indicates that the data still strongly reject risk neutrality. In contrast with the risk aversion coe¢ cients, the estimated “noise parameter” is comparable in Tables 6 and 8, except for the last …ve periods of treatment 2 where it becomes closer to zero. This result re‡ects the fact that, as previously mentioned, subjects behavior nearly conforms with the RNBNE during the last periods of treatment 2. Finally, we relax the assumption of equilibrium behavior to estimate the risk aversion parameter. Instead, inspired by the results in section 4, we assume that subjects best-respond to their stated beliefs about their probability of winning. In other words, we compare the subjects’ actions in the experiment, with their subjective best-responses. To account for noisy behavior, we consider a Quantal Best-Response approach in which subjects do not necessarily select their bestresponses with probability one. Instead, according with the basic principles underlying the QRE approach, we assume that the probability that subject i selects a bid b = 0; :::; v when receiving a private-value v at period t is. Pi;t (b j v) =. n o1= b Ei;t [U (b; v)]. v 1n h io1= X e b Ei;t U b; v e b=0. bi;t [U (b; v)] = (v where E. b)1 1 r. r. Pbi;b;t ,. where Pbi;b;t is subject i’s stated probability of winning with a bid b in period 32 Recall that the P -values are estimated by Bootstrap, and therefore they di¤er slightly from the asymptotic P -values.. 22.
(25) t. Recall that we observe Pbi;b;t for each agent and each period. Therefore, the only parameters to estimate in this model are ( ; r). Table 9 indicates that the Quantal Best-Response model generates signi…cantly lower log-likelihoods than the QRE models in Tables 6 and 8. In fact, pairwise comparisons on the basis of the Vuong speci…cation test systematically lead to reject the models in Tables 6 and 8 in favor of the corresponding models in Table 9 (the P-values range from 1:06E 3 to 8:39E 128). These tests therefore con…rm that subjects’ behavior may be best explained by the fact that they tend to best-respond to their beliefs. The likelihoods reported in Table 9 also shows that the risk neutrality hypothesis is still strongly rejected in favor of risk aversion. Moreover, note that, unlike the models estimated in Tables 6 and 8, the parameters (b; rb) estimated in treatment 1, and in the last …ve periods of treatment 2, are now quite similar. This result further con…rms the ability of the Quantal Best-Response approach to capture behavior equally well in the two di¤erent treatments. The di¤erence observed when estimating the risk aversion parameter with the entire sample of data collected in treatment 2 may again be attributed to the fact that subjects in treatment 2 learned to adjust their strategies and predictions at a slightly di¤erent rate. Finally, observe that the risk aversion parameter is signi…cantly lower than previously estimated. Indeed, we now …nd that r lays between 0.24 and 0.27, instead of the 0.5 to 0.6 range suggested by Table 6, as well as GHP and other studies. 5.2. Quantal Response Models with Heterogenous Agents To explain overbidding, the leading risk aversion model, the so-called CRRAM (see e.g. Cox et al. 1988), assumes that agents may have heterogenous preferences. To give the risk aversion hypothesis its best chance to organize the data collected in the experiment, we explore in this section the possibility that agents may be heterogenous with respect to risk preference and/or probability misperception. This approach is also consistent with Section 4 where we detected signi…cant heterogeneity across subjects in the way they bid and predict probabilities. Following Cox et al. (1988), we assume that heterogenous risk preferences may be represented by a utility function of the form: Ui (b; v) =. (v. b)1 1 ri. ri. :. In addition, to model heterogenous probability perception, we generalize the PWF 23.
(26) proposed by Prelec (1998): i. (P ) = exp (. i. ( ln (P )) i ). (5.4). :. Following Cox et al. (1988), we assume that an agent faces uncertainty about the risk preferences and probability perceptions of others. In other words, agent i observes i = (ri ; i ; i ), but he only knows the distribution from which the speci…c risk aversion and the probability perception parameters of his opponents are generated. Since ( i ; i ) must be strictly positive, we assume that the vectors (ri ; ln( i ); ln( i )) are identically and independently distributed across agents from a multi-normal distribution with mean r; e ; e , and variance-covariance matrix. .33 The analysis of the model is somewhat similar to the homogenous case, except that we must now distinguish the choice probability of agent i conditional on i , Pi (b j v; i ) =. fE [Ui (b; v) j Pj ; i ]g1= v 1n h io1= X E Ui eb; v j Pj ; i. (5.5). ;. e b. from the unconditional (or average) choice probability of agent i, P ;i (b j v) = E [Pi (b j v; i )]. Agent i’s probability of winning and expected utility may now be written PiW (b) =. 1 6. X. X. v2f0;2;4;6;8;11g e b<b. P. ;j. eb j v + 1 12. X. P. ;j. v2f0;2;4;6;8;11g. and E [Ui (b; v) j Pj ; i ] = Ui (b; v). i. PiW (b). (b j v). ;. :. Although agents are endowed with di¤erent i , the model is ex-ante symmetric, and therefore, the QRE choice probabilities P (b j v; ) are also symmetric across agents. Note however, that unlike the homogenous case, the QRE choice probabilities are now a function of a multi-dimensional continuous variable . Consequently, unless one imposes arbitrary parametric restrictions on the shape 33 Although the distribution of the parameters has been speci…ed in terms of (ln( i ); ln( i )), we will report in the remainder the descriptive statistics for ( i ; i ). In particular, ( ; ) will denote the expectation of ( i ; i ), 2 and 2 will denote the variance of i and i , and ; will denote the coe¢ cient of correlation between i and i .. 24.
(27) of the choice probabilities as a function of , the heterogenous QRE model cannot be solved even numerically. In contrast, the set of unconditional QRE choice probabilities P (b j v) is discrete and …nite, and it may be determined with the same …xed-point approach as in the homogenous case. Indeed, observe that 2 3 6 6 fE [U (b; v) j P ; ]g1= 6 i j i P ;i (b j v) = E 6 v 1 io1= 6X n h 4 E U eb; v j P ; i. j. i. e b. 7 7 7 7 7 5. ;. (5.6). only involves the unconditional choice probabilities P ;i and P ;j , which in equilibrium are both equal to P (b j v).34 The Likelihood associated with the heterogenous model may then be written: L ( ; r; ; ; ) =. Y. i;v;t;b. I. [P (b j v)] [Bi;v;t =b]. :. The heterogenous analogs to the various homogenous models estimated in Tables 6 to 9, are reported in table 10. Four points are particularly worth noting. First, the average values of the noise, risk aversion and probability misperception parameters ( ; r; ; ), change slightly compared to the homogenous case (Tables 6 to 9), but they remain of comparable magnitude. Observe however, that the risk aversion parameter is in general lower in Table 10. In particular, the coef…cient of relative risk aversion is found to be slightly below 0:2 when the Quantal Best-Response model accounting for the subjects’stated beliefs is estimated with the data collected during the last …ve periods of treatments 1 and 2. Second, most of the standard deviation parameters ( r ; ; ) are signi…cantly larger than zero, and relatively substantial compared to their respective means. In other words, our estimates suggest signi…cant heterogeneity across subjects both in terms of risk aversion and probability perception. The …rst part of this result is consistent with a number of experimental analyses of …rst-price auctions, in which heterogeneity in risk preference is often identi…ed (see e.g. Cox et al. 1988, Cox and Oaxaca 1996, or Chen and Plott 1998). To the best of our knowledge, 34 The expectation in (5.6) does not have a closed form, and it must be evaluated numerically. To speed-up the numerical integration we rely on a quasi Monte Carlo sampling method consisting in generating extensible lattice points modi…ed by the “baker’s transformation” (see Hikernell et al. 2000).. 25.
(28) however, the presence of heterogeneity in probability perception has never been previously detected in experimental economics. Third, there appears to be a strong correlation between risk preference and probability misperception. Indeed, r; , the coe¢ cient of correlation between an individual risk aversion parameter ri and his probability perception parameter i , is signi…cantly greater than zero. Therefore, although observationally equivalent, probability distortion and risk aversion do not appear to act as substitutes for an individual. Instead, our estimation results suggest that they complement each other, as highly risk averse subjects also appear to be more pessimistic and/or less accurate when predicting probabilities.35 This result is somewhat consistent with Bellemare et al. (2005) who also identify a correlation between preferences and beliefs.36 Four, a series of statistical tests indicate that i) models accounting for heterogeneity systematically dominate their homogenous analogs in Tables 6 to 9; ii) within the class of heterogenous models, the risk neutrality hypothesis is rejected in favor of risk aversion; iii) the experimental data are best described by the heterogenous Quantal Best-Response model in which agents play with a probability close to one their best-response conditional on their stated beliefs. To summarize, the structural estimations suggest that subjects in our experiment may be best characterized as utility maximizers with heterogenous levels of risk aversion and probability misperception. Moreover, the risk aversion parameters estimated, although non-negligible, are far too low to explain alone the subjects’tendency to bid above the RNBNE. Instead, the structural estimations con…rm that probability misperception is one of the main determinant of overbidding in our experiment.. 6. Probability Misperceptions in a Private Values Auction Model Our experimental results suggest that probability misperception may complement risk aversion to explain overbidding in an independent private values auction. The theoretical e¤ect of risk-aversion on the bayesian Nash equilibrium bid function 35 Given the estimated values of ( ; ), i essentially controls the degree of convexity of the PWF. Therefore, an individual with a high level of risk aversion ri is more likely to have a large i which corresponds to a more severely convex PWF. 36 In an analysis of the ultimatum game, Bellemare et al. (2005) …nd that proposers who are optimistic about the acceptance rates of responders also tend to have signi…cantly higher levels of inequity aversion.. 26.
Figure
Documents relatifs
We proposed statistical tests to decide whether an observed random field is heterogeneous or not, the heterogeneity resulting from spatial variations of the regularity of the field,
The new dialogue we advocate between conservation scientists and accounting researchers can build on a small but growing body of work in accounting research, cen- tered
successive events vs. the peak luminosity of simulated events. Scatter plots refer to a) the entire peak-luminosity distribution function and b) only the hard (flat) part of
The takeover offer is an altemative mechanism that is widely used by private equity bidders in order to complete public-to-private deals in Europe. In a private equity transaction,
16 To check the “wishful thinking” hypothesis, we test whether initial individual beliefs depend on the initial (random) endowment of shares. The GLS regression of ranked
On the basis of the data from Genova and Macerata, it results that the mean value of hourly solar radiation intensity normalized to extraatmospheric intensity. can
Taken together, these results suggest the following architecture for the integration of beliefs and affective values in human decision-making (Figure 8.29). Before decision, vmPFC
Our results show that heterogeneity significantly matters in agricultural production choice models and that ignoring the heterogeneous determinants of farmers’ choices can
