Lefebvre: Université du Québec à Montréal and CIRPÉE Merrigan: Université du Québec à Montréal and CIRPÉE Roy-Desrosiers: Université du Québec à Montréal
Corresponding authors: Pierre Lefebvre/Philip Merrigan, Economics, UQAM, CP 8888, Succ. Centre-Ville, Montréal, QC, Canada H3C 3P8
lefebvre.pierre@uqam.ca; merrigan.philip@uqam.ca
The analysis is based on Statistics Canada’s National Longitudinal Survey of Children and Youth (NLSCY) and Survey on Labour and Income Dynamics (SLID) restricted-access Micro Data Files, which contain anonymized data collected in the NLSCY and the SLID and are available at the Québec Inter-university Centre for Social Statistics (QICSS), one of the Canadian Research Data Centres network. All computations on these micro-data were prepared by the authors who assume the responsibility for the use and interpretation of these data. This research was funded by the Fonds québécois de la recherche sur la société et la culture.
Cahier de recherche/Working Paper 11-01
Québec’s Childcare Universal Low Fees Policy 10 Years After : Effects, Costs and Benefits
Pierre Lefebvre Philip Merrigan
Francis Roy-Desrosiers
Abstract:
More than ten years ago the province of Québec implemented a universal early childhood education and care policy. This paper examines if the two objectives pursued, to increase mothers’ participation in the labour market (balance the needs of workplace and home) and to enhance child development and equality of opportunity for children, were reasonable meet. A non-experimental evaluation framework based on multiple pre- and post-treatment periods is used to estimate the policy effects. First, year after year the number of children and their weekly of hours in childcare have increased. More preschool children are in non-parental childcare at a younger age and the intensity of childcare has increased over the years. Second, the policy has significantly increased the labour force participation and annual weeks worked for mothers with at least a child aged 1 to 4 years compared to mothers in the same situation in the Rest of Canada. Third, the evidence presented show that the policy has not enhanced school readiness or child early literacy skills in general, with negative significant effects on the PPVT scores of children aged 5 and possibly negative for children of age 4. Simulations show the bounds of the public benefits in terms of additional net taxes (income taxes less refundable credits and transfers based on household’s “net” income). Unless one suppose that mothers in the upper part of the earnings distribution are those who returned early to the labour market after giving birth or a maternity leave, and who have worked more weeks, the effect on governments revenues are modest. The main beneficiary of the larger tax base of a higher labour supply of mothers with young children is the federal government which do not support the significant public funding of the program. The policy has some drawbacks in terms of social efficiency and equity. The structure of the program with its very low $7/day fee before taxes creates strong incentives for families to use long hours of daycare for children at a very young age, which may not be the best mechanism for children development. The high transfers in-kind (1.9 billion in 2009) to families using subsidized childcare raise the question of their horizontal and vertical equity. The paper concludes on three modifications to the program that could correct some of its weaknesses.
Keywords: Childcare policy, mother’s labour supply, preschool children and school readiness, treatment effects, natural experiment
1
1. Introduction
Early childhood education and care (ECEC) has become a major concern for policy makers across the world. More than ten years ago the province of Québec embarked on the development of a universal ECEC program with some particularities.
On September 1st 1997, the government of Québec implemented a new childcare policy. From that day on, accredited and regulated childcare facilities offered subsidized daycare ($5 per child per full-day fee policy) for children who were 4 years of age on September 30th 1997. The government also promised to progressively decrease (every year) the age requirement for subsidies and increase the number of subsidized $5/per day daycare spaces, targeting a number of 200,000 for 2006. By September 2000, the low-fee policy applied to all children aged 0 to 59 months (not eligible for kindergarten) and the number of (partly subsidized) regulated spaces increased from 77,000 (available in late 1997) to 210,000 totally subsidized spaces, by end of March 2010 (see Table 1 for these figures).
Families‟ childcare arrangements changed dramatically over time as the policy favoured regulated subsidized centre-based care (as well as for family-based care under the supervision of not-for-profit centres). This new childcare policy was integrated with other major changes in education policy including full-time publicly-provided kindergarten in a school setting replacing half-day school-based kindergarten with $5 per day before- and after-school daycare for kindergarten-age and elementary-school children. No such important policy changes for preelementary-school (including kindergarten) children were enacted in the other Canadian provinces over the years 1997 to 2009.
The policy pursued three major objectives: to increase mothers‟ participation in the labour market, balance the needs of workplace and home and to enhance child development and equality of opportunity for children. These goals are not particular to Québec and have been pursued in several countries since the eighties as ECEC public policies have spearheaded family policy.1
Despite the large amount of public funds dedicated to this program (see Table 2) – direct public subsidies to childcare providers increased from $288 million in fiscal year 1996-1997 to $2.0 billion for fiscal year 2010-20112 – very few studies (reviewed below) have examined whether the objectives have been reasonably met.
It is important to use the Québec experiment as a beacon to form expectations about the longer term effects of such an ECEC policy (as well as anticipate problems that could emerge from a
1 The approach is similar to the ones adopted by several European countries. See OECD (2001, 2006) for a review of ECEC policies.
2 The initial expenditures (school infrastructure, equipment, materials and hiring of new teachers) associated with the passage to full-time kindergarten has been estimated for the first year at 200 million dollars by the Department of Education.
2 universal low-fees childcare policy if it becomes effective across Canada) as some aspects may ripple to other provinces. For examples, British Columbia has adopted to phased-in over two years a full-day kindergarten for the 5-year-olds beginning with the 2010-11 academic year.3 Ontario has partly adopted a grand plan on early learning (Pascal, 2009): for the academic year 2010-11 nearly 600 schools currently offer day kindergarten, and by 2015-16 all elementary schools should have full-day kindergarten for all 4- and 5-year-olds. Full-full-day kindergarten will include optional integrated before- and after-school programs (providing a seamless day with fewer transitions for children and families) in which parents can choose to enrol their child for a reasonable fee.4 The Web site of the Department of Education of these two provinces are convinced that full-day kindergarten will help kids prepare for grade 1 and that they stand a better chance of graduating from both grade 12 and a post-secondary institution. In Ontario the full-day learning is part of the province‟s plan to reduce poverty.5
This study presents estimates of the economic payoffs from this unique large scale “natural” policy experiment in Canada potentially affecting children from all income groups and with a particular relevance for the school readiness of older preschool children. Given that most ECEC policies in the United States are targeted towards disadvantaged children, the results can be very useful to policy makers more interested in universal ECEC programs.
This paper use data from the seven available cycles of Statistics Canada‟s National Longitudinal Survey of Children and Youth (NLSCY) and difference-in-differences methods to tease out the effects of the childcare program This paper answers the following questions on labour supply and use of daycare: what are the effects of the policy on hours in daycare by children‟s age, mothers‟ level of education, and year? What are the impacts on mother‟s labour force participation and annual weeks worked by age of children, mothers‟ level of education, and year? Because the NLSCY provides a much larger sample than the Survey on Labour Income and Dynamic (SLID), we can estimate the impact of the policy by sub-groups (age of children, mother‟s education levels), an exercise rarely undertaken, and also observe whether the positive impacts of the policy on labour supply in the earlier studies (see section 3 below) are persisting in the province of Québec. There are several reasons to pursue research on this policy in detail for several sub-groups. First, it is of interest to observe whether the impacts differ by age, particularly for the very young as the policy interacts with parental leave and kindergarten policies. Second, it is important to ask whether the policy of passing
3 Provincial funding of $280 million over three years is being provided, while $144 million for related construction needs and provision of space was announced in June 2010.
4
Ontario's full day learning program is projected to cost 1.5 billion dollars at full implementation. 5 For an ex-ante evaluation of the Ontario plan see Fairholm and Davies (2010).
3 from publicly financed half-day kindergarten to full-day and pre- and after-school publicly subsidized daycare in 1997 had an impact on the labour supply of mothers with 5-year-olds, in particular; because the government of Ontario is implementing a full-day program (instead of a part-day) for the 4- and 5-year-olds. Finally, it is of interest to observe whether the impacts differ by the mother‟s level of education. The objective of motivating low-educated mothers to return to the labour market is a long-standing concern of policy makers, because attaching them to the labour market reduces public costs in many areas (welfare, poverty, family security, etc.). Also, there are equity issues around universal type policies (in Québec all families pay the same price, except welfare mothers returning in the labour market who pay reduce fees). Are skilled mothers, who generally in higher income families, more sensitive to the subsidies than low-skilled mothers?
There is a growing body of evidence that some ECEC interventions can lead to both short and long term gains for young children be they cognitive or non-cognitive (emotional outcomes or social skills). However, Baker, Gruber and Milligan (2008) produced quite substantive evidence that Québec policy had a negative impact on diverse behavioral measures of the “well-being” and health of both children (0 to 4 year olds) and parents. In this paper, we focus on the impacts of the policy on cognitive development. Has the policy improved children‟s school cognitive readiness in Québec? Has the policy diminished “social” gaps (e.g. between children with a low-education mother and those with a high-education mother) in school readiness? How does half-day pre/kindergarten in a public school setting (the policy chosen by the Province of Ontario for 4- and 5-year-olds before 2010) compare with Québec‟s childcare policy?
Our results show that the large increases in hours of childcare and labour market outcomes (participation and weeks) found in earlier papers until 2002 are also found until 2006-2007. However, we find that there is considerable heterogeneity of the effects across age groups of the children and across the education levels of the mother. For our cognitive measure, the Peabody Picture and Vocabulary Test (PPVT),6 our evidence does not reveal positive effects of the policy on cognitive development for both 4- and 5-year-olds. For 4-year-olds, we find that the policy decreased the standardized PPVT scores but the effects are not significant except for raw scores; for the 5-year-olds, the decreases are significant, on average approximately by one fourth of a standard deviation. Furthermore, the results for two sub-samples of children based on the mother‟s education (mothers with a high school education or less, and mothers with a university degree) suggest that the policy did not reduce “social” gaps in school readiness and that the policy effects are sensitive to the mother‟s education level.
6
A receptive vocabulary test (on early literacy skills), an outcome often use as an appropriate measure of cognitive development.
4 In the last part of the paper, we seek to address the question of the public costs and benefits of the policy. The monetary costs are given by the public funds dedicated to the program. The public benefits are estimated by a simulation, using data drawn from Statistics Canada‟s Survey of Labour and Income Dynamics (SLID), of the household‟s changes in their income taxes and transfers by level of government associated to the higher labour supply of mothers. Because of data limitations, (child care expenditures for example are available only from 1999 in the SLID), and other minor policies that may impact taxes and transfers, we do not use a difference in difference approach to estimate the benefits of the policy. We rather assume, (based on the results in this paper and Lefebvre, Merrigan and Verstraete, 2009) that the policy increased the labour supply of mothers with children aged from 1 to 11 years by ten percentage points in 2004 and then proceed to estimate by how much the increased labour supply increased the tax returns and lowered the tax credits of both the federal and Québec provincial government. Because, the estimation methods cannot identify which mothers would leave the labour market in Québec without the policy, the tax-transfers benefits of the policy can only be bounded. We find that even in the best of scenarios, the benefits from increased labour supply for the government of Québec of the childcare policy fall very short of the public costs. Moreover the benefits favour more the federal government.
The rest of the paper proceeds as follows: Section 2 presents the low-fee childcare policy, childcare use and arrangements over its inception and traces the unique evolution of Québec among Canadian provinces in this regard. Section 3 reviews prior research evidence. Section 4 identifies the conceptual issues and lays the framework for the analysis. Section 5 presents results on hours of care. Section 6 contains the empirical results on labour force participation and weeks of work. Section 7 discusses the results of the policy on cognitive scores of the 4- and 5-year-olds. Section 8 presents the estimated impacts of the policy on the changes in household incomes taxes and transfers for both levels of government. Section 9 concludes on the benefits and costs of Québec‟s childcare policy.
2. Québec’s low-fee childcare policy, childcare use and arrangements
On September 1st 1997, licensed and regulated childcare facilities under agreement with Québec‟s Department of the Family (not-for-profit centres, family-based daycare and for-profit centres) started offering spaces at the reduced contribution of $5 per day per child, for children aged 4 on September 30th. On September 1st 1998 and on September 1st 1999 respectively, the 3-year-olds and 2-year-olds (on September 30th) were eligible for the low-fee spaces. On September 1st 2000, all children all children aged less than 59 months (not entitled to kindergarten because their fifth birthday is after September 30) became eligible for the low-fee spaces.
5 For children aged 5 on September 30 1997, full-day instead of part-day kindergarten was offered by all School Boards (some private schools already offered this option). Kindergarten is not compulsory but if a child is enrolled in a public school, he or she must attend class for the full school day and school week. All provinces offer publicly provided free kindergarten for 5-year-olds in a school setting under the auspices of the Department of Education. All programs are for a half-day (2 hours and 30 minutes) during the school year, except in Québec (which is for a full day since the fall of 1997), New-Brunswick, and Nova-Scotia (for British Columbia and Ontario see above). In almost all provinces parents are free to register their child in kindergarten as it is not compulsory; but a very large majority of eligible children do attend kindergarten. In Ontario, most School Boards offer a half-day junior kindergarten for the 4-year-olds. Again, most eligible children attend these kindergartens. In Québec, since the fall of 1997, almost all 5-year-olds attend full-time kindergarten (98% compared to 85% before the policy change) while a large number attend before- after-school subsidized daycare settings (53% according to administrative data for the school year 2003-2004). Although there are differences in policies for kindergarten, the only major change in kindergarten policy over the period of our study occurred in Québec. Furthermore, the fact that in Ontario most 4- and 5-year-olds are enrolled in public (pre)kindergarten suggests that this province offers an interesting control group as an alternative to the nine provinces for cognitive scores.
Table 1 presents the evolution of the number of spaces partly or totally subsidized by the government from 1993-1994 to 2009-2010 by type of childcare setting as well as the total number of Québec‟s children in different age groups by year. We observe that non-profit services are the main beneficiaries of the policy. The yearly increases from 1998 (although low-fee spaces were only for the 4-year-olds) are substantial. The rate of growth of subsidized spaces increased in the second year of the program (childcare facilities and spaces are created throughout the year). Regulated spaces in the network increased from 76,715 (partly at the low-fee) in 1998 to 132,545 (all at low-fee) in 2001; and to 210,019 in 2009, a 173 percentage raises.
Since the introduction of the policy, it is well known that the program has not been able to satisfy all of the increased demand for low-fee spaces. It is difficult to obtain data on the number of children on waiting lists with no access to a subsidized space. Families can turn to private providers of childcare services (non-subsidized and non regulated spaces) and obtain a refundable tax credit for their childcare expenses.7 To decrease the demand pressure on subsidized spaces, the tax credit was improved two times (2008 and 2009). Since 2009, the maximum expense is $9,000 per child aged
7 In 1994, the Québec‟s childcare deduction was transformed into a refundable tax credit. The tax credit varied from 75% to 26%, based on family income (26% for household earnings of $84,040 or over in 2008) and eligible childcare expenses subjected to certain limits.
6 less than 7 years of age, the credit rate table changed (75% to 44%) and family income enhanced to $125,000 or over for the lowest rate, to reduce the net-cost8 difference between private and reduced-contribution childcare services.
In Québec, before September 1997, some subsidies partially covering fixed costs were directed to all licensed and regulated childcare facilities; and low-income families received a fee-subsidy according to eligibility criteria. Table 2 displays the evolution and targeting of spending from 1996 onwards. In 1996-1997, these subsidies amounted to 288 million dollars. Table 2 also shows the budgetary credits for the childcare program by settings as well its transformation from a parent fee-subsidy program to a childcare providers subsidies program. In 2009-2010, subsidies had reached 2 billion dollars practically all directed towards daycare providers. Since January 1 2004, the fee per day has been fixed at $7 instead of $59 (the raises applied also to services offered within public schools). Nonetheless, the subsidy per space continued soaring because childcare educators obtained much better working conditions. In the first year of the policy (covering only the 4-year-olds and parent fee-subsidy for the other children), the mean subsidy per space was $3,832. For fiscal year 2009-2010, the subsidy amounts to $9,061 per space. The mean masks important differences by setting and age of children: not-for-profit centres receive the highest average subsidy per space ($12,810), followed by for-profit centres ($11,260$), and family-based spaces the lowest ($5,447); the subsidy is higher for children aged less than 18 months as the children/educator ratio is lower).
The National longitudinal survey on children and youth (NLSCY), conducted every two years by Statistics Canada since 1994-1995, asks parents if they use childcare services for the purpose of studying or work and for each mode of childcare used the number of hours per week. Figure 1 presents graphs, for Québec and the Rest of Canada (RofC - for the other nine provinces), of the four principal care arrangements used by parents for children from 1 to 4 years of age for the 7 cycles of the NLSCY. A reference line indicates the third wave of the survey (1998-1999), which correspond to the second and third year of the policy implementation. It appears that a larger percentage of children in Québec are in daycare relatively to other provinces since the policy was initiated (1997). Family-based daycare outside of the child‟s own home is the most widely used mode of daycare across Canada. Daycare is growing rapidly in Québec relatively to other provinces since 1998. Daycare in the household (by relatives or non-relatives) is slightly higher outside of Québec. Centre-based care,
8
In fact, after federal taxes and family transfers, the net cost for a subsidized space for a child under age 5 is $2.87 per day for a family income up to $150,000. The enhanced refundable tax credit reduces the net-cost to $3.31 per day up to a family income of $125,000, on the hypothesis of child care expenses of $25 per day per child for 260 days ($6,500).
9
After the raises, roughly 85% of total costs were covered by the government subsidy. Since, the percentage has decreased because new spaces have been added and operating cost of subsidized spaces has increased steeply.
7 including before- and after-school care increases rapidly in Québec compared to the other provinces where this arrangement ranks third. Parental care has decreased considerably over the years in Québec. In the RofC, parental care of the 1-4 years has remained the same at approximately 50% since 1998. To summarize, the figures shows an important shift in daycare use occurring in Québec after the introduction of the daycare policy in 1997 but not in the RofC.
In Canada an important changes in parental leave policy had an impact on childcare used for children under age 1. Since December 2000, the maximum number of parental weeks leave paid by the Employment Insurance program to eligible mothers (and spouses) was increased from 25 to 50. From January 2006, Québec opted-out of this program and created its own enhanced (in terms of earnings maximum and replacement ratios) parental leave program.
Figure 2 graphs the mean hours (non conditional on the use of childcare) children spend in the primary care arrangement by age of the children for Québec and the RofC. From the third wave of the survey, there is a large increase in the average hours children spend in daycare for each age group (1 to 4 years) in Québec compared to the RofC. The drop for children under age 1 after 2000 is related to the new parental leave policies. The 5-year-olds, as expected, spend much less time in childcare than 1-4 years and the rise of hours in daycare is much smaller than for younger children. Before 1998 approximately 15% of 5-year-olds were at home and their hours in daycare were 0. From 1998, practically all 5-year-olds are in kindergarten. However, this does not affect hours in daycare. The slight increase is explained by the $5 per day before- and after-school daycare policy introduced in 1998. Since year 2000, the 1-4 years have spent much more hours in childcare than the same age‟s children in the RofC.
Table 3 presents the breakdown of children benefiting from the low-fee childcare by age from year 2000 to 2008, and shows the number of children that have been exposed to those childcare services over the years.10 The first four columns of the Table 3 indicate a significant regression of entry age in child care and a large progression of the proportion of children having experienced childcare by age four. In 2000, 34% of all children aged 0 to 4 years were in low-fee childcare services, 42% in 2002, 49% in 2004, and 53% in 2006. In 2008 a little more than 50% of the 1 year-olds are in child care and more than 60% of the 2-, 3- and 4-year-year-olds, compared respectively to 26% and 40% in 2000. To summarize, the Tables and Figures presented so far show important shifts in daycare use, modes, and intensity occurring in Québec after the introduction of the childcare policy in 1997 but not in the RofC.
We cannot trace any such elaborate picture relative to the evolution of childcare services for other
8 provinces in Canada. Table 4 presents the number of regulated spaces by province for years 2001 and 2006 as well as the number of children receiving subsidies. In 2006, 38% of regulated daycare spaces across Canada are in Québec (200,005 versus 325,753 spaces in the other provinces) where 196,813 children are in a totally subsidized space compared to 155,886 children receiving a total or partial subsidy in the RofC. Table 4 also stresses that Québec has a unique child care regime compared to those existing in the other provinces in terms of provincial funding,11 monthly (daily) fees and eligibility.
3. Prior research evidence early childhood education and care
On mother‟s labour and use of childcare
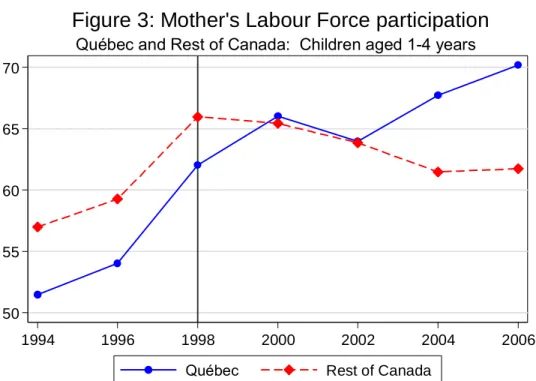
Earlier studies find that the Québec experiment of substantial childcare subsidies offered to families with preschool children produced an important increase in the labour supply of the mothers of these children. Lefebvre and Merrigan (2008) use annual data from 1993 to 2002, drawn from Statistics Canada‟s Survey of Labour and Income Dynamics (SLID), with a sample of all Canadian mothers with at least a child aged 1 to 5, and estimate a substantial effect of the policy on a diversity of labour supply indicators (participation, labour earnings, annual weeks and hours worked). In 2002, the effects on participation, earnings, annual hours and weeks worked of the childcare policy are respectively between 8.1 and 12 percentage points, $5,000-$6,000 (2001 dollars), 231 to 270 annual hours at work, and 5 to 6 annual weeks at work.
Baker et al. (2008) using the first two cycles (1994-1995 and 1996-1997) and the last two cycles (2000-2001 and 2002-2003) then available of the NLSCY12, analyze the impact of Québec‟s childcare policy on childcare use and maternal work (mothers in two-parent families only), of preschool children (0- to 4-year-olds or sub-samples of those children). They also produce estimates showing substantial mother’s employment effect of the policy and a large increase in non-parental childcare use.
In order to evaluate the potential long-term or life-cycle effects of Québec‟s universal childcare policy, Lefebvre et al. (2009) estimate both a differences (DD) and difference-in-difference-in-differences (DDD) models computed with annual data from the SLID (1996 to 2004) for two groups of Québec‟s mothers: those with at least a child aged 6 to 11 and no children less than 6, and those with at least a child aged 12 to 17 and no children less than 12; and comparative groups
11 In the other provinces, licensed childcare providers may receive one time funding (for the expansion of spaces) or recurring funding (for equipment, infrastructure, administration, salary enhancement grants).
12
They do not consider the third cycle participants (1998-1999) surveyed during the two years immediately following the phasing-in of Québec‟s low-fee childcare policy.
9 of mothers from the RofC and Ontario. They find that the program had substantial dynamic labour supply effects on mothers in Québec, in particular for cohorts of mothers who had a high probability of receiving subsidies from the child‟s birth to his/her fifth birthday. For example, the results show that the policy increased annual hours worked in 2004 for mothers with at least one child aged 6 to 11 years-old in Québec by 217 hours. Interestingly, Lefebvre and Merrigan (2008) find that the impact of the policy on all mothers with at least one child 1 to 5 years old to be 231 hours in 2002. A striking feature of the results is that they are driven by changes in the labour supply of less educated mothers. On ECEC and child development
There are several observational studies on the effects of maternal employment or early childcare and education on child development (cognitive, behavioural, socio-emotional, and health related). Given our approach, we focus on those using large data sets with a large set of control variables in regression analyses.
First, for studies on early childcare and maternal employment of children aged 0 to 2, there is a growing body of empirical results indicating that maternal employment and time spent in childcare during the first year of life can have adverse effects on a child‟s developmental outcomes (such as verbal, reading and math scores, and indexes of behavioural problems) observed at a later ages (Ruhm, 2004; Waldfogel et al., 2002; Hill et al. 2005). In some articles, early full-time employment is found to be harmful, even after controlling for childcare quality, the quality of the home environment, and maternal sensitivity (Brooks-Gunn et al., 2002; Hill et al., 2002; and for United Kingdom, Gregg et al. 2005).
Second, several studies (Gormley and Gayer, 2005; Gormley et al., 2005; Magnuson et al., 2004, 2005) examine the effect of preschool programs on outcomes prior to or at kindergarten entry or later
for children aged 3 to 5 and find significant positive effects on cognitive outcomes (letter-word
identification, spelling and applied problems) and measures of school readiness. Longer hours in all types of preschool are associated with more behavioural problems that persist over time. Nonetheless, the cognitive gains for disadvantaged children (whether defined by poverty status, low maternal education, single parent headship, or mothers who do not speak English) are larger and longer lasting. A large-scale UK study following children aged 2 or more who attend center-based preschool shows similar results (Sammons et al., 2002, 2003).
Third, there appears to be an “optimal” minimum age “requirement” before one‟s child is placed in daycare (O‟Brien Caughy et al., 1994; Loeb et al., 2007). The aforementioned studies suggest that this minimum age “requirement” varies between one and two years of age and those long hours children spend in daycare will matter for future outcomes. For disadvantaged children (ages 2-3), 30
10 hours per week of care for at least 9 months per year (more intensive care) has little detrimental effects on their behaviour, while producing positive effects on their cognitive outcomes. In contrast, the cognitive development of children from wealthier households appears to benefit from daycare outside the home only if it is part-time (between 15 to 30 hours per week for at least 9 months per year). The findings of international evidence (Burger, 2010) indicate that the vast majority of recent early education and care programs had considerable positive short-term effects and somewhat smaller long-term effects on cognitive development; and that in relative terms children from socioeconomically disadvantaged families made as much or slightly more progress than their more advantaged peers.
Fourth, on the question do children learn more in full-day kindergartens than half-day programs,13 the existing American studies suggests that full-day kindergarten‟s impact on academic and social outcomes is somewhat mixed, but taken as a whole tends to imply that full-day kindergarten‟s pros outweigh its cons. One weakness of some studies is their lack of control over student assignment to kindergarten programs14 and window of observation. Using American longitudinal data (the Early Childhood Longitudinal Study – Kindergarten cohort (ECLSK), a nationally representative sample of over 8,000 kindergarteners), Lee et al. (2006) found that the full-day kindergarten children learn more in literacy and mathematics over the kindergarten year than those in half-day programs, and that the program is equally effective for children of different social backgrounds (note: this is contrary to findings in most other full-day kindergarten studies, which have found that low-income/at-risk students benefit more from full-day kindergarten than more advantaged peers). Using data from the same survey, DeCicca (2007) find that full-day kindergarten has sizeable impacts on academic achievement during the first year of a program implementation, but the estimated gains are short-lived, particularly for minority children. However, the efficacy of the full-day kindergarten intervention may be contingent upon class size as students in smaller full-day classes benefit more (Zvoch et al, 2008).
Fifth, the quality and effectiveness of care (sensitivity and affective quality of caregiver-child interactions) seems to have positive, but small, effects on cognitive outcomes (Blau, 1999; Duncan, 2003). Of particular interest is Duncan‟s remark that, when effects of daycare are negative, they are
13
The central mechanism of change in the full-day kindergarten environment is the greater instructional window (generally 6 h as opposed to 3 h of daily instruction) that allows teachers more time to use diverse pedagogical approaches (e.g., teacher-directed whole and small group instruction, child-initiated activity) and to present a more comprehensive and challenging curriculum.
14 White children are more likely to be in half-day programs than full-day ones. Black children are more likely to be in full-day programs than half-day ones; and children in full-day kindergarten are generally less advantaged (lower SES, more likely to be black than white, less proficient in math at start of year) than those in half-day programs.
11 more pronounced for children who spent all, versus none, of their third and fourth years of life in centre-based care. Moreover, centre-based care is not found to have any significant impact on cognitive outcomes if it was initiated in the early stages of childhood. Finally, this study suggests that children with low initial cognitive skills may benefit most from quality care. Using the same data set as Duncan, Belsky et al. (2007) show that children, whose hours spent in childcare increased between 3 and 54 months of age, scored significantly lower on a vocabulary test in fifth grade. It is the first study with NICHD data that detects such long-term links between experiences in childcare and achievement in school. The authors summarize prior NICHD published work showing that, before the transition to school (at age 4 1/2 years), higher quality childcare was associated with higher levels of pre-academic skills and language scores, whereas more hours in care and increasing hours in care were associated with higher levels of behaviour problems, but not academic skills or language functioning. Thus an important increase in hours spent by children in care may have long-term negative effects on their vocabulary test scores.
There are few Canadian studies on the same topic. Using cycle 1 (1994-1995) of the NLSCY, Lefebvre and Merrigan (2002) show that non-parental care (centre- or family-based), compared to parental care, has no effect on the cognitive development of children, as measured by an index of their social and motor development (for children aged less than 48 months) or by PPVT scores (4- and 5-year-olds). The estimates show that some observable family characteristics such as the mother‟s education and immigration status have very strong effects on a child‟s score. Using six cycles of the NLSCY and quasi-experimental estimation methods, Lefebvre, Merrigan and Verstraete (1998) provide evidence that the policy had substantial negative effects on preschool children‟s (aged 4 and 5 years) Peabody Picture Vocabulary Test scores. The negative effects are found to be stronger for children with mothers who have lower levels of education. This paper updates the 1998 study. We remind the reader that Baker et al. produced quite substantive evidence that the Québec policy had a negative impact on diverse behavioural and health measures of 0 to 4 year-olds and their parents.
4. Econometric modeling
We investigate the effect of the program on hours in daycare for children of different age groups, and the impact of the policy on the following two labour supply outcomes that are available in the NLSCY: labour force participation and annual number of weeks. A non-experimental evaluation framework based on multiple pre- and post-treatment periods is used to estimate the policy effects. The econometric approach is based on a “difference-in-differences” procedure which is now well established to evaluate natural experiments (Blundell and Costa Dias, 2009; Angrist and Krueger,
12 1999). The modeling uses a double difference (DD) estimation technique, where treatment groups are Québec‟s children and children of the same age in the Rest of Canada (RofC) are the control groups over several years.
The data used for our empirical analysis are provided by the NLSCY which is a probability survey designed to provide information about children and youth in Canada. The survey covers a comprehensive range of topics (family characteristics and total income) including childcare as well as data on parent(s) labour force activities.15 The NLSCY began in 1994-1995 and data collection occurs biennially. The unit of analysis for the NLSCY is the child or youth. Since the NLSCY objectives are to produce longitudinal and cross-sectional estimates, several populations are targeted. Supplementary Table A1 presents some particularities of the NLSCY that must be emphasized to understand the type of analysis that can be undertaken.
The “post-treatment period” 1998-1999 (cycle 3) will be considered as the first year of the program even though it was originally implemented in late 1997. It is during the cycle 4 (2000-2001) that all children under age 5 years became eligible and that the “constraint” on the number of subsidized spaces was largely loosened.
To estimate the model, we turn to a DD specification, differentiated by period, presented by Francesconi and Van der Klaauw (2007):
Yit = α + θQit + γ*I(t≥s) + β3D3Qi3 + β4D4Qi4 + β5D5Qi5 + β6D6Qi6 + β7D7Qi7 + ΦXit + εit (1)
Where i indexes children and t years, Yit represents the outcome (in our case, weekly hours in childcare, mother‟s labour force participation and weeks worked, and children aged 4-5 years cognitive scores). εit is an error term. Xit is a vector of socioeconomic control variables and Φ is a
vector of parameters. Qit takes the value of 1 if the child lives in Québec, 0 otherwise. I() is an
indicator function, γrepresents the effect of a post-policy aggregate (common to both regions) change in the intercept, and s is the period the policy is “implemented”. D3, D4, D5, D6 and D7 are dummy
variables taking the value 1 if the observation is from cycle j and 0 otherwise, j=3, 4, 5, 6, 7. When interacted with Q, they represent post-policy periods in Québec. It is important to include a specification where the effects of the policy vary for each post-policy cycle in order to test the hypothesis that each cohort of children was treated differently, bearing in mind that between each time period, from cycle 3 (1998-2000) to cycle 7 (2006-2007) more than 110,000 new spaces were created (an average of 14,000 per year). Furthermore, the total number of hours spent in care varies
15 The NLSCY has much larger samples of young children than the SLID, but only two labour supply variables measured identically over the cycles (number of weeks worked in the year preceding the survey and labour participation at the times of the survey).
13 quite importantly with each cohort, as can be seen in Figure 2. These remarks justify equation (1), where βj, for j=3, 4, 5, 6, 7 represents a time or cycle-specific effect of the policy.
Different samples are used for the analysis. First, from the data sets of the 7 cycles, we sampled all children aged 0 to 5 years. Children living in foster families are excluded as well as those (very few) with a mother having missing information on the socioeconomic control variables (see supplementary Table A2). Secondly, for labour supply we constructed two sub-samples by level of education of the mothers (with a high school diploma or less, and with a university degree or more). Thirdly, the estimations are conducted for different age groups, for all mothers and single mothers. All estimations were performed with “bootstrap weights” as computed by Statistics Canada for the NLSCY, which take into account the complex survey scheme.
5. Results on hours in non-parental child care
We start by providing evidence on the effect of the program on hours in daycare for children of different age groups. The program could have different effects on hours in daycare for different cohorts because of the gradual way it was implemented. In order to evaluate this program effect, we estimated a DD model as in equation (1) with different policy effects for different cycles. The socioeconomic controls include the sex of the child, the age group of the mothers at child birth (25-29, 30-34, 35 or more with 14-24 the omitted group), family type (step family, single parent with two-parent the omitted group), whether the mother is born in Canada or not, the mother‟s highest level of education (less than high school diploma, high school diploma, some postsecondary education, with university diploma or more the omitted group), the presence and number of older or younger siblings or child of the same age, size of community (five groups from rural to 500,000 or more the omitted group), and family income (other than the mother‟s earnings) in 2001 dollars.
Table 5 displays, in panel 1 for the full sample, the policy effects on weekly hours in childcare by age (from under 1 to 5 years and for the 1-4 years age group) and children living with a single mother (last column of the Table), for cycles 3, 4, 5, 6 and 7. These groups are then split by education of the mothers and results are found in panels 2 and 3. For children under 1 and for cycles 4 and 5, the effect of the subsidized daycare program is to raise hours in daycare by respectively, 6.1 and 7.6 hours, in both cases significant (p<.01). The not significant effects for cycles 6-7 reflects the increasing number of families using the paid 50 weeks maternity-parental leave federal program or the new Québec program implemented since 2006. For ages 1, 2, 3 and 4, the effects increase substantially from cycle 3 to 7, reaching for the 1-4 age group 2.5, 5.9, 8.7 10,4 and 10.7 hours respectively. In research in this area, such effects much be considered very large and represent a sea change in the lives of children. It
14 is important to note that cycle 3 effects are all smaller than cycles 5 to7 effects as new spaces were created every year during that time period. It is quite clear then that the cycles 6 and 7 children were exposed to the longest hours in daycare considering the time since birth. As expected there are no significant positive effects for children age 5 years since almost all are enrolled in kindergarten. The two other panels of Table 5 demonstrate that the “cumulative” effect is substantially larger for women in the higher education group. The effects are clearly positive in the later cycles for both groups when children are aged 1 to 4. The results “bounce around” more, probably due to smaller samples, in particular the later samples for the low-education mothers. The effects are large for both education levels in cycle 7, and are very large for single mothers with a university degree and at a very stage in the implementation of the policy in cycles 3 and 4. The same patterns can be observed for children living with a single parent (last column of Table 5). Clearly, the children from cycles 6 and 7, the last in the data set, were more intensely affected by the program than the earlier cycles. The significance of the results for well educated mothers (starting in cycle 4) also suggests these women took an “early advantage” of the policy, probably for career reasons, compared to women in the lower education group. Another way to put it is that high-education women stand the most to lose, in terms of career advancements, from a prolonged absence from the job market.
6. Results on labour force participation and weeks worked
The same DD specification based on (1) as well as the same socioeconomic controls are included to estimate the effects of the program on mother‟s labour participation and week worked in the reference year for the same samples (by ages and mother‟s education levels). The econometric results are found in Tables 6 and 7.
Labour Force Participation
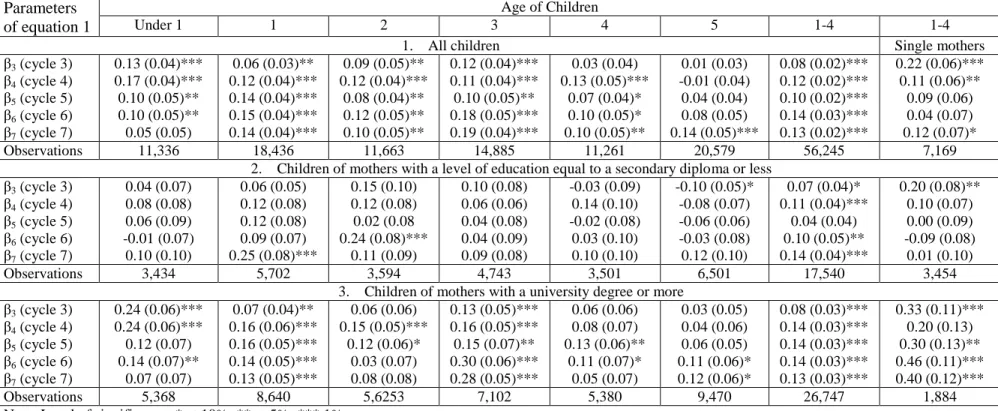
The first panel (all mothers) of Table 6 shows that for the 1-4 years group (column 7), all the effects are significant, large and increasing over the cycles, except for cycle 4 (years of an economic downturn). The smallest effect, 0.08, which is 8 points in the participation rate, is in cycle 3. The effect is higher, 0.09, for mothers with very young children (0-1 year). In general, the estimation shows that the effect increases from cycles 4 to 6 reflecting the subsidisation of new places, and in particular between cycles 5 and 6 where the increase is almost more than 5 percentage points for all age groups except the very young children (0-1) for which the effect decreases substantially between cycles 4 and 5 and then increases. The results are consistent with the hypothesis of a positive effect of the policy on participation of mothers with children less than 5. There is also evidence that this effect has been increasing over time.
15 The case of 5-year-olds is interesting as the effects are generally positive and large in the later cycles but not significant until cycle 7. What is particular of the children from the later cycles is that the number of childcare spaces available is substantially high since birth. Therefore, the significant effects at age five could be due to the availability of subsidized spaces since birth (see Lefebvre et al., 2009). Therefore, simply changing kindergarten policy from a part-time to a full-time system may not be enough to increase labour supply of mothers with 5-year-olds if it is not accompanied with a daycare policy for the very young.
The larger effects are for the mothers with a child aged 1, 2 and 3 years. It is surprising that the strongest effect is for mothers with very young children as the policy included children aged one year or less only by September 2000 (cycle 4). In fact, estimation for cycle 3 shows that the policy has the strongest effect on mothers with the youngest children (0.13 or 13 points). Since the policy provided spaces for the 0-1 year old children in 2000, we expected a smaller effect for this group in cycle 3. It is possible that parents knew that caregivers could eventually provide a subsidized place when the child got older and simply rushed into the labour market after the birth of the child to be in a position to eventually obtain a subsidized space. The fact that new subsidized spaces would eventually open up was well advertised by the government in the early years of the program. The government also publicized the need to get a child in a subsidized daycare setting as early as possible.16 There was a very strong incentive to assure a place early on to reap benefits from the policy for as many years as possible. This incentive was lower for mothers with children of four or five as the benefits of the new policy lasted for a much shorter time.
For a child under 1 the effects are decreasing over time. This could be due to the new more generous parental leave (50 instead of 25 weeks) federal policy introduced in the years of cycle 4 (from December 2000) and reflecting the changes in Québec‟ new parental leave policy (cycle 7). The effects for mothers with a child aged 5 years are not significant, except curiously for cycle 7. This is not surprising giving that most mothers with an attachment to the labour market have returned before their youngest child is of kindergarten age.
The last column of the first panel presents the results for single mothers and the 1-4 years age group. The effects are not all significant, smaller than for the complete sample, and more erratic from
16 The web site of the Department in charge of family policy offers the following advice: “First of all, you must decide whether you want childcare in a facility (childcare centre) or in a home environment. Then find out which childcare establishments are located near your home or place of work. In order to have a wide choice, it is best to start looking ahead of time, even as much as a year in advance. Otherwise, there may not be room in the childcare establishment that suits you best when you need it. If you put your child on a waiting list, it is more likely that she/he will be accepted when the time comes for you to use childcare. Establishments regulated by the Department of the Family generally fill up quickly. This is explained by the establishment‟s good reputation and the possibility of obtaining places for a reduced monetary contribution or with other forms of financial assistance.”
16 cycle 3 to cycle 7. For the 1 to 5 years group (results not shown here), the estimation shows increasing but less pronounced effects over the years.
Panels two and three present the results for samples based on years of education. The first sample, panel two, considers mothers with a secondary diploma or less education. The estimated effects, as for hours in daycare, bounce around more than in the full sample. A steady increase in the impacts is not as clear as for hours in daycare, but the effects are in general larger for in the later cycles (6-7) and are very strong in particular for university educated mothers with children who are 3 years of age and for university educated single mothers with children who are aged 1 to 4 years; they are, however, a rather small group of mothers. Clearly, the positive effects of the policy, found in former papers, are persisting right up to 2006-2007, which in some sense is not surprising as very little new childcare policies have been implemented across the country, except for very targeted groups.
Weeks worked
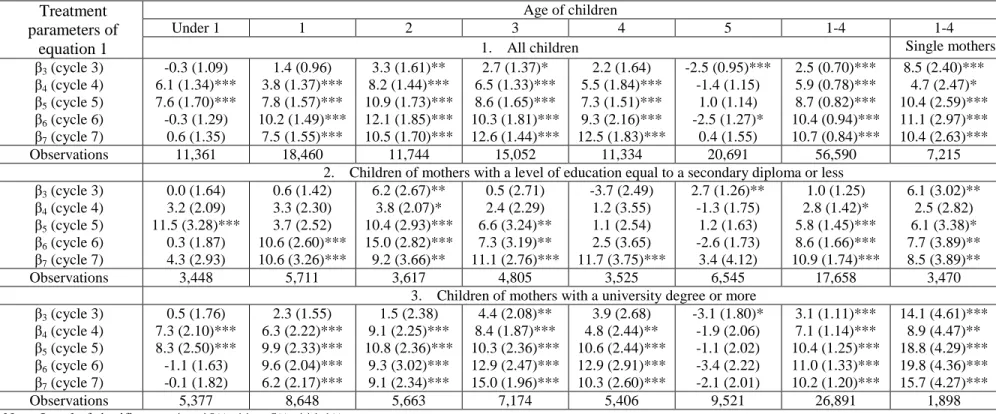
Table 7 presents the results for annual weeks worked. Weeks worked are particular as the standard labour supply model does not predict a positive effect. An income effect of the policy can decrease weeks worked for those who would work a positive amount of weeks without the childcare policy. For the full sample (first panel), we observe that for the 1-4 year-olds there is a sustained policy effect from cycle 4 to cycle 7. The strongest effects are for mothers with very young children 0 to 3 years, mirroring the effects for participation. As expected, for mothers with a child under the age of 1 the effect decreases over time, with a U-shaped pattern, reflecting the changes in the parental leave policies. For the 2- and 3-year-olds we find a monotone increase from cycles 3 to 7. Curiously for 4-year-olds, the effects are all substantially large and positive but with relatively large standard errors making the coefficients not significant. Finally for the 5-year-olds who are almost all in kindergarten, there are no effects except surprisingly in cycle 7. However, the effects in cycle 7 show that the participation effects were not translated into effects on weeks. It is probable that some income effects reduced work weeks for mothers already in the work force when the policy was implemented. The strongest effects are for the 1- and 3-year-olds as the estimated policy effects are less than 2 weeks in cycle 3 and 7 weeks in cycle 6. The explanation for this is the same as for participation. The results by education and type of household mimic quite closely those found on participation. However, overall for low-education mothers, very few coefficients are statistically significant and in general coefficients change much more from one cycle to another in more haphazardly way. For mothers with a high school diploma or less (second panel) and children aged 1-4 years, the policy also has positive effects but smaller than for the well educated and support for the effects is less
17 strong for the smaller sub-groups. A clearer picture emerges for this group in cycles 6 and 7, with an increase of respectively 4.3 and 5.3 weeks compared to 0.0 week in cycle 3 and 3.7 weeks in cycle 4.
7. Child development
The PPVT test was designed to measure receptive or hearing vocabulary. For the NLSCY, it was used to measure school readiness for children in the 4- and 5-year-olds age groups. The master files present both the PPVT raw (PPVT-Raw) and the PPVT standardized (PPVR-SD) scores. However, Statistics Canada has used different methodologies to standardize the scores.17 The released measurements for cycles 1 to 3 were standardized within cycle (with slight variations in the methodology), while in cycles 4 to 7 scores were standardized over the grand population of all tests over the first 5 cycles of data. Cycles 1 to 3 would in essence look similar from one time to the next as they are standardized by age groups to have the same mean of 100 and standard deviation of 15. This type of standardization is common for analysis of domains within a cycle; however it provides limited insight for in-between cycle analysis. Realizing this limitation, Statistics Canada introduced in cycle 5 a less restrictive normalization technique where the expected age performance is benchmarked against all children of that age over time versus those measured at the same time. The scores are still adjusted by age group to have a mean of 100 and a standard deviation of 15 but computed over 5 cycles, and they are less susceptible to sampling variation as 5 samples have been used to determine the norm. For robustness and to facilitate analysis of changes through time (to capture true population differences over time and not simply differences resulting from sampling error), we have re-standardized (using Statistics Canada smoothing routine) the PPVT-Raw scores using all the 7 cycles in the NLSCY. It should be noted that the standardization was done separately for the PPVT and the EVIP (the acronym for the French adaptation of the test). This should be of no concern as our estimates are based on differences in changes of scores over time between the children of Québec, more than 80% French speaking, and those from the RofC or Ontario. We also perform regression analysis with PPVT-Raw scores. In all estimations, there are controls for children taking the test in French (English) in the other provinces (Québec). Only children who understood English or French well enough to follow instructions were given the test.
We sampled all children aged 4 and 5 from the data sets of all 7 cycles. Children living in foster families are excluded as well as those (very few) with a mother with missing information on the socioeconomic control variables (see supplementary Tables A4 and A5). Children with a missing PPVT score are also excluded. Secondly, we constructed two sub-samples by the level of education
17
The score is adjusted for the age (the smoothing technique is applied by 2-month age groups) and the language in which the children passed the test (English or French).
18 of the mothers: low-education (with a high school diploma or less) and high-education (with a university degree or more). Supplementary Table A4 for Québec and Table A5 for the RofC present the mean values of variables used in the regressions. These statistics show that mothers in both regions are very similar except for education in Québec in cycle 2, where better educated mothers are over-sampled, and immigration status (there are less immigrant mothers in Québec) for all cycles. Estimation results
We must point out that this paper is not about the evaluation of the effects of childcare on the development of children but an evaluation of the effects of a low-fee for long-hours in daycare policy on development. Non-experimental studies that attempt to estimate the effects of childcare on outcomes are plagued by problems of identification and spurious correlation. First, because most children who are in daycare have working mothers, regression methods have difficulty disentangling the effects of non-parental daycare relative to parental daycare from the effects of a working mother relative to a mother staying at home. Second, because using childcare is a choice, it is a function of unobservable preferences that can also determine the cognitive performance of children. For example, mothers who stay home with their child may in general prefer spending long hours with their child which could be beneficial to the child. On the other hand, some mothers with very low levels of human capital do not work and do not use childcare and it is well-known that on average, children with low-skilled mothers score poorly on cognitive tests. Panel data can alleviate the bias due to spurious correlation but the identification problems remain. The program could have different effects on hours in daycare for different cohorts because of the gradual way it was implemented. In order to evaluate this program effect, we estimated a DD model as in equation (1) with different policy effects for different cycles.
We first discuss the results of the policy on PPVT scores for the 4-year-olds. The estimates of equation (1), by Ordinary Least Squares with standardized or raw scores, without and with covariates, are found in Table 8A (first panel 1).18 The results show very small and non significant effects with covariates; and for cycles 6 and 7, larger significant effects for the raw scores (column 5) and for both measures with non covariates. The cycle 7 estimate is rather large and negative, but not significant. When we separate the sample by the education level of the mothers, the negative effects become much larger for children with low-educated mothers, reaching a level of -6.0 and significant in cycle 6; strangely the cycle 7 estimate for this group is positive at 1.03, however the sample size for children drops from 87 in cycle 6 to 50 in cycle 7. The coefficients for children with university educated mothers (column 3) is usually small, positive or negative, and never significant. Using
18
Table 8B supposes that the post policy period begins with cycle 4 (2000-2001) of the survey. The results are similar.
19 year-olds Ontarians as a control group does not alter the test results, even if it does alter the sign and/or size of the effects (column4). Therefore, clearly the policy has no positive effect on these children, and if there is one, it would be negative and for children with low-education mothers large enough for policy makers to worry about.
Turning to 5-year-olds, in the second panel of table 8, we find sizable negative and significant effects for models with and without covariates, and with the raw and standardized scores. The same is true when we separate the samples by the level of education of the children‟s mothers.
We find a negative effect of the policy with a parameter estimate of -4.90 (p<.01) for cycle 4 (2002-2003). This is a very large effect (almost one third of a standard deviation of the dependent variable). As a comparison, the ceteris paribus “effect” of a mother moving from a high school degree to a university degree is approximately 3. For the other cycles, the estimated parameters are smaller and statistically significant, although, there is not a clear downward trend over time. Results for the raw scores with covariates as well as those without covariates for both measures are similar but higher to the results with the standardized scores and covariates (Table 8, columns 5-7). For cycle 7 (2006-2007) and the full sample, the estimation with covariates provides us with estimates of -3.60 (p<.05) for the standardized scores and -6.14 (p<.01) for the raw scores. The negative effects are observed for both high- and low-education mothers (columns 2 and 3), but are slightly higher for the sample of children with mothers low-education, although they are less precisely estimated. The specification with only Ontario (Table 8A, column 4) as the control group gives almost the same results as with all nine provinces. Therefore, the picture is not quite what it should be for a policy that seeks to increase early literacy skills and better prepare children for school.
“Who Am I?” and Age equivalent number knowledge tests scores
From cycle 4, the NLSCY has introduced two new tests for the 4- and 5 year-olds. The “Who Am I” scale represents the overall score for two direct measures. The assessments measure the child's understanding and use of conventional symbols and relevant early learning skills (nonverbal language). The tasks in the copying scale access the development of ability to conceptualize a given figure; the symbol scale tasks focus on the understanding that symbols have particular meanings. For cycles 6 and 7, the NLSCY has standardized the raw score by age within cycle (the norm being the respondents from cycles 4 and 5) and cannot be compared over time. Moreover the take-up rate is lower than for the PPVT (response rate of 90% in all cycles): 79% for 4-5 years longitudinal children and 76% for cross-sectional 5 year-olds.19 Table 9 presents in the first panel the scores (raw and age
19
Nonetheless the NLSCY User Guide states: “All the evidence indicates that the test has good validity and should provide data users with information about the child‟s developmental level. This assessment is not free of
non-20 standardized) for four samples (Canada, RofC here excludes Ontario, Québec and Ontario). On a cycle basis the scores indicate that Québec‟s children of both ages generally lag compared to their peers in the other provinces.20
The age equivalent number knowledge assessment (response rate of 90-91% in all cycles) measures the child's intuitive knowledge of numbers by assessing their understanding of the system of whole numbers. Panel two of Table 9 presents the distribution of levels for cycles 4 and 7, and the standardized scores for cycles 6 and 7. Again, the scores suggest that Québec‟s children have lower test scores than their peers in the other provinces.21
Discussion
In summary, the effects of the program are found to be negative for 5-year-olds and less convincingly negative for 4-year-olds. The results for sub-samples of children (mothers‟ level of education) suggest that the policy did not reduce “social” gaps in school readiness. In fact, the estimates show the negative estimated impacts of the policy are larger for children with a less educated mother.
We propose three major explanations for our results when compared to former studies on the impact of ECEC on preschool cognitive achievement. First, most studies that attempt to evaluate the impact of additional daycare are plagued by endogeneity or spurious correlation problems which is not the case in our study.
Second, rarely can we observe variations in hours of non-parental care for young children of the magnitude observed after the implementation of the program. For example and according to the NLSCY data for primary childcare, in 1994, 45% of all children aged 1 to 4 were in childcare and 68% for more than 21 hours per week (excluding 0 hour); in 2002; 70% of children of the same age are in childcare and 78% for more than 21 hours; in 2006, 74% were in childcare and 83% for more than 21 hours per week. Not only are more children in daycare but they are there for much longer hours.
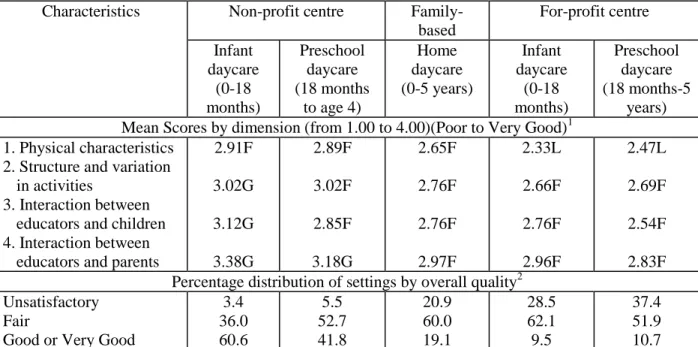
Third, although more children are now in regulated types of daycare, which is supposed to be helpful or at a minimum not harmful, two major studies (ISQ, 2004; Japel et al., 2005) show that the average quality in Québec‟s subsidized daycare network is at best satisfactory and in many cases low or not acceptable, particularly for children in lower-income families. Supplementary Table A5 response bias. One can speculate why the component response is worse for this assessment compared to the PPVT and Number Knowledge tests. Perhaps this assessment was too difficult for some eligible children.”
20 A p-value of adjusted Wald test of difference on estimated mean (not presented here) indicates significant difference for some cycles among samples.
21
A Kolmogorov-Smirnov equality-of-distributions test (un-weighed data) indicates for almost all distribution a significant difference between Québec children and children of same ages in the other samples.
21 summarizes the results of the 2004 study on educational quality by characteristics of daycare and overall quality: family-based, for-profit-centre and childcare for infant services are of rather fair quality and, except for non-profit centres, childcare services are largely unsatisfactory or fair in terms of overall quality. Part of this is explained by the rush to implement the program, build up new settings and create new spaces to respond to the excess demand for spaces, which forced the government to accept daycare workers with no specific training in ECEC.22
It would therefore be recommended to any province intending to follow Québec‟s footsteps to be weary of offering long hours to parents at very low prices. Since it is important to offer high-quality daycare services, it would be advised to implement slowly such programs, starting in low-income neighbourhoods, where experimental studies have proven their efficacy when providing high quality services. This would also give some time to the proper educational facilities to start offering programs that better prepare workers for the daycare industry.
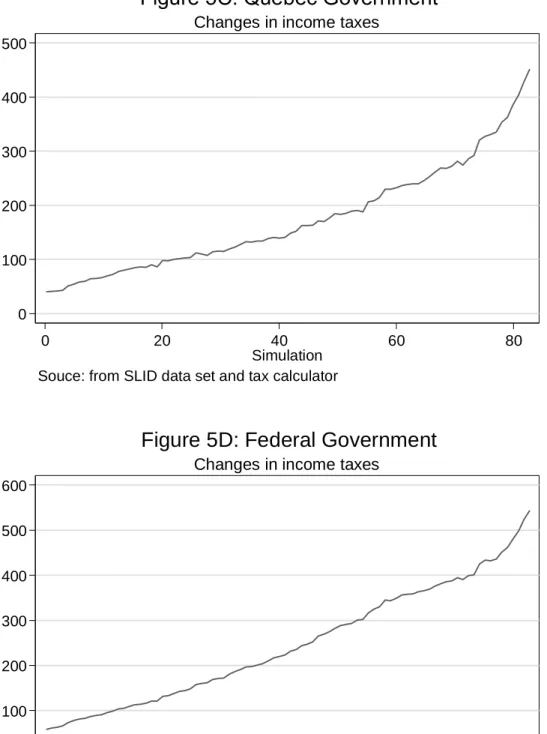
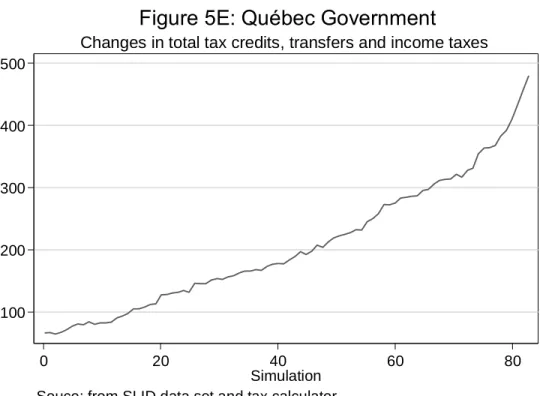
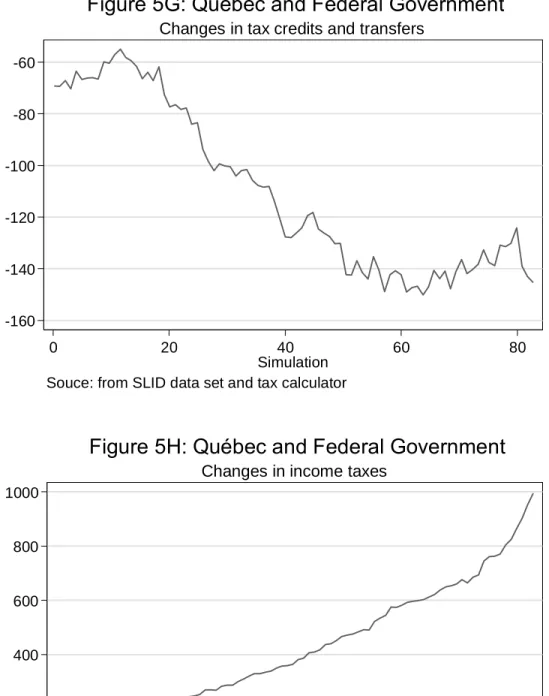
8. Incomes taxes and transfers changes of the policy by level of government
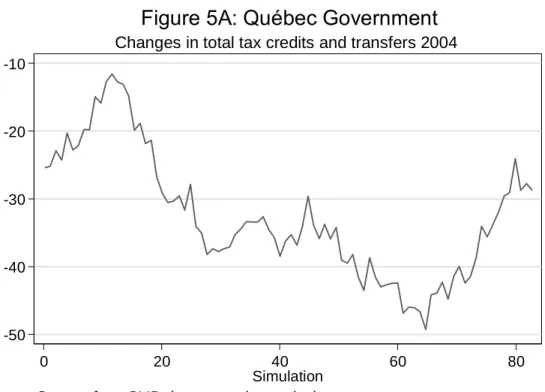
In this section we present simulations of the fiscal benefits of the policy for the year 2004. This year is chosen because since 2005 a generous transfer policy to low income families was implemented and could have had some impacts on labour supply. By increasing the labour supply of mothers with young children, the Québec government has increased the tax base for both the provincial and federal government. Also, given that tax credits decrease with „net‟ family income, both federal and provincial transfers will be lower because of the policy. As explained below, we suppose the policy increased the participation rate of mothers with children who have at least one child aged 1 to 11 years by 10 percentage points. We use the SLID to compute the fiscal impacts of retiring from the labour market, an equivalent number of working mothers. We choose to remove mothers that have positive earnings.23 We proceed by simulating income taxes and credits for our sample of mothers using the software written by Milligan (2008), retire the equivalent of 10% of mothers and we then recomputed the families taxes and transfers for these women given that their
22 According to administrative data from the Department of Family, in 2001 (2006): 42% (28%) of not-for-profit centres do not respect the ratio of two out of three „qualified‟ educators; 25% (11%) of for-profit centres do not respect the very less stringent ratio of 1/3; overall, 40% (33%) of educators have no specific qualification in ECEC. A person is considered as having qualification if she has a university diploma (17%; generally they are directors of centres) or training in ECEC at the university level (6%)/(7.2%), a post-secondary “non-university” degree (37%)/(43%), or a secondary school diploma or vocational training in ECEC (40%)/(44.6%). In 2001, family-based educators have less formal qualification: 45% have a high-school diploma or less, 84% have no specific training in ECEC; and only an average of 7.7 years of experience in childcare occupations. For latter years we have no statistics on qualifications of the self-employed educators in family-based childcare.
23 Using only those mothers which make more than $10,000 per year in earnings changed very marginally the results. One can assume that mothers with less than $10,000 are not in the labour market because of the policy, and would otherwise pay few income taxes.