HAL Id: hal-01008283
https://hal.archives-ouvertes.fr/hal-01008283
Submitted on 19 Oct 2017HAL is a multi-disciplinary open access
archive for the deposit and dissemination of sci-entific research documents, whether they are pub-lished or not. The documents may come from teaching and research institutions in France or abroad, or from public or private research centers.
L’archive ouverte pluridisciplinaire HAL, est destinée au dépôt et à la diffusion de documents scientifiques de niveau recherche, publiés ou non, émanant des établissements d’enseignement et de recherche français ou étrangers, des laboratoires publics ou privés.
Identification of Young modulus profile in PVC foam
core thickness using speckle inteferometry and inverse
method
Carlos Ferreira, Pascal Casari, Rabah Bouzidi, Frédéric Jacquemin
To cite this version:
Carlos Ferreira, Pascal Casari, Rabah Bouzidi, Frédéric Jacquemin. Identification of Young modu-lus profile in PVC foam core thickness using speckle inteferometry and inverse method. Speckle’06 International Conference, Sep 2006, Nimes, France. �10.1117/12.695838�. �hal-01008283�
Identification of Young Modulus Profile
in PVC Foam Core thickness
using speckle inteferometry and Inverse Method
Carlos Ferreira, Pascal Casari, Rabah Bouzidi and Frédéric Jacquemin
GeM - Institut de Recherche en Génie Civil et Mécanique, Université
de Nantes – Ecole Centrale de Nantes - UMR CNRS 6183, France
[email protected]
ABSTRACT
The aim of this paper is to investigate the mechanical properties of a PVC foam core and especially the Young modulus profile along a commercialised 50 mm beam thickness. The identification of the Young modulus gradient is realised through the uniaxial compression test of a 50 mm cube sample. The in-plane strain fields of one cube face under loading in both directions (longitudinal and transversal) are achieved using a diffuse light interferometric technique, the speckle interferometry. Next to that, a numerical model is built using finite elements code CAST3M. We choose a multilayer model in order to introduce spatial variation of the mechanical properties. The boundaries conditions are very close to those prescribed in the experimental tests. Finally, the present work shows that the non uniform profile of the Young modulus can be estimated by using a simple inverse method and the finite elements analysis to reproduce the experimental strain field.
Keywords:foam, PVC, gradient, optical methods, FEM, inverse method.
1. INTRODUCTION
Foam based core composite sandwich structures are candidate for structures which require a high strength-to-weight ratio and corrosion resistance [1]. To fully understand, and so predict by simulations the sandwich composite behaviour, it is important to well characterise the mechanical properties of the core material. While extensive data are available on polymer or polymeric composites, only a few information is available on the foam core. The general assumption used for sandwich analysis is to consider this one as isotropic with homogeneous properties [2,3]. Though it is true for polymeric resins, it is not the case of classical foams presenting gradients in their density, stiffness, and fracture behaviour [4,5,6]. The material used in this investigation is a cross-linked PVC foam made of closed cells with a nominal density value given by the manufacturer of 200 kg.m-3. In a previous work [7], the determination of some mechanical properties
profiles. The hardness and density have been evaluated by simple experimental methods and a coefficient of thermal expansion gradient has been determined by using speckle interferometry. In the continuation of this work, the present paper aims to investigate the Young modulus gradient using the same optical technique associated to a numerical inverse method.
2. FOAM CORE 2.1 Description
The material used in this investigation is AIREX C70.200 PVC cross-linked cellular foam panels with a thickness of 50 mm from Alcan Baltek Corp. (Northvale, N.J., U.S.A.), for universal use in sandwich constructions. Polyvinyl foam cores are manufactured by combining a polyvinyl copolymer with stabilizers, plasticizers, cross-linking compounds and blowing agents. The mixture is heated under pressure to initiate the cross-linking reaction and then submerged in hot water tanks to expand to the desired density. The thickness of the produced perform is around 70 mm and is machined down to 50 mm in order to get flat and regular surfaces. The resulting material is thermoplastic, enabling the material to conform to compound curves of a boat hull, or similar shape.
2.2 Density and CTE profiles
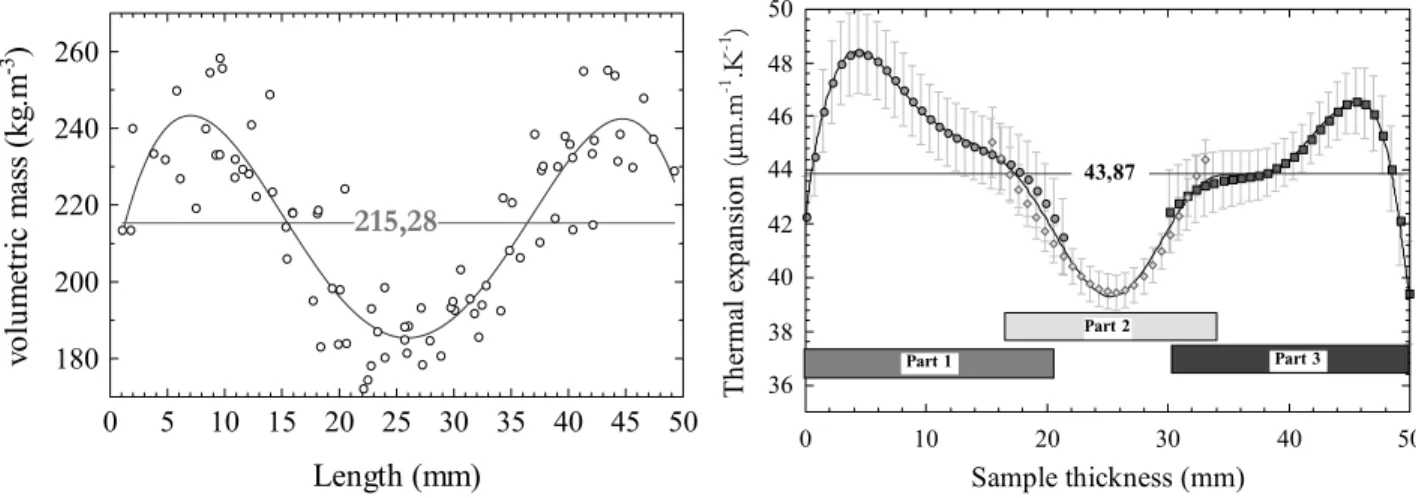
In previous works [7], the foam density profile has been realised by matter removal on several regular parallelepipedic samples (Figure 1). The density profile obtained points out a non-uniform but symmetric density of the foam along its thickness that may be correlated to the foam formation process or to the sheets preparation. A variation of 25% of the density is then observed between the maximum of the measured density located between 5 and 10 mm of depth and the minimum one in the centre. The average value is about 215 kg.m-3, which differs from the nominal density value given by the manufacturer (200 kg.m-3). 0 5 10 15 20 25 30 35 40 45 50 180 200 220 240 260 Length (mm) vo lu m et ri c m as s (k g. m -3 ) 215,28 0 10 20 30 40 36 38 40 42 44 46 48 50 Sample thickness (mm) T her m al ex pa ns io n ( µ m. m -1 .K -1 ) 50 Part 1 Part 3 Part 2 43,87
Figure 1: Experimental density profile along the foam panel thickness obtained by a matter removal technique.
Figure 2: Experimental coefficient of thermal expansion profile of the PVC foam obtained by speckle interferometry.
At the same time, the foam profile of Coefficient of Thermal Expansion (CTE) has been analysed using the speckle interferometry method briefly explained below (Figure 2). As it can be seen, the thermal expansion coefficient is not constant across the raw panel thickness. A quasi symmetrical profile is observed with two maxima around a distance to the faces of 5 mm. In comparison to the density and hardness profiles, the CTE variation seems to be less important, and a slope change is observed around 2/3 of depth.
3. COMPRESSION DEVICE
The compression device consists in a rigid stainless steel frame (Figure 3) fixed onto the optical breadboard. The cubic foam core is glued on both ends to 10 mm aluminium plates in order to disable rotations of the specimen and to force boundary conditions to match to Finite Element Model. One side of the sandwich aluminium/foam/aluminium is 2 points screwed to frame while at the opposite a steel ball located into a circular hole on the centre of the aluminium plate transfers the applied force to the foam. The mechanical loading is realised by means of a steel bellows inflated by compressed air and a 200 N sensor is used to control the force.
4. OPTICAL SET-UP
The low stiffness of the sample only allows the use of a non-contact method to measure displacements during the test. As the measured displacement fields are rather small, because of the narrow dynamic range of the force sensor and also to ensure an elastic deformation, we selected a high sensitive method. For these reasons, the optical set-up used is based on a double illumination speckle interferometer to measure in-plane displacement field of the sample under elastic loading. In order to have the in-plane strain fields in both directions, longitudinal and transversal, the compression is 90° rotated. The two in-plane components İzz and İyy are then separately estimated. The Figure 4 shows the experimental
Figure 3: View of the compression test with the cubic foam core specimen (a), the aluminium plates (b), the 200 N force sensor (c), and the steel bellows (d).
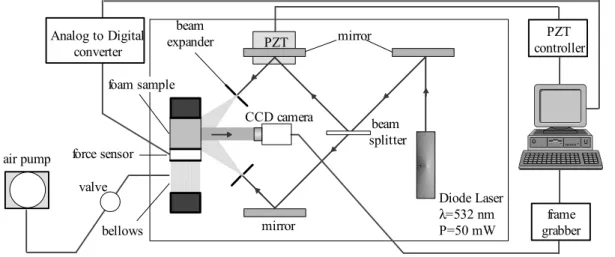
A 50 mW green diode pumped solid state laser (Ȝ = 532 nm) provides a coherent light source, while a piezoelectric transducer (PZT) is used as phase shifter. The intensity distributions of combined light beams are recorded by a monochromatic CCD camera (512 × 512 pixel sensor). The images are then digitized by means of the Fringe Analysis® software [8]. Diode Laser λ=532 nm P=50 mW beam splitter foam sample beam expander PZT mirror CCD camera mirror air pump PZT controller frame grabber force sensor bellows valve Analog to Digital converter
Figure 4: Schematic of the optical set-up for in-plane displacements measurements of the PVC foam under mechanical loading. 5. EXPERIMENTAL STRAIN FIELDS
For a double illumination interferometer, correlation fringes of in-plane u-displacements will form wherever:
θ
λ
=
sin
2
n
u
(1)where Ȝ is the laser wavelength and ș is the illumination angle; n denotes the fringe order.
The used measurement technique, described in [9], consists in recording phase patterns of the specimen for several steps of mechanical loading. The phase distributions are easily obtained from the acquisition of at least three speckle patterns in which a known phase shifting is imposed by the translation of the mirror attached to the PZT device (step 1). After the phase images subtraction, an unwrapping operation (step 2), the displacement field are then calculated using Equation1 (Figure 5). From these 2D fields, a displacement profiles along lines are extracted (step 3). The differentiation of these profiles lets leads to the experimental strain profiles (step 4). In order to reduce the influence of statistical fluctuations, each final profiles presented are derived from the average of 16 measurements for mechanical loadings of 130 N to provide a global compaction of 10 ȝm. At last, the profiles are fitted with a high order polynomial function (order 5 for the İyy profile and order 9 for the İzz one).
y direction 0 10 20 30 40 50 -2 -1 0 1 2 foam thickness (mm) di spl ac em en t ( µ m) 0 10 20 30 40 50 0,004 0,005 0,006 0,007 0,008 0,009 0,01 foam thickness (mm) st ra in (%)
(step 1) (step 2) (step 3) (step 4)
z direction 0 10 20 30 40 50 0 2 4 6 8 10 foam thickness (mm) di spl ac em ent (µ m) 0 10 20 30 40 50 -0,03 -0,028 -0,026 -0,024 -0,022 -0,02 -0,018 -0,016 foam thickness (mm) st ra in (%)
Phase maps Displacement fields
Displacement profiles
Strain profiles
Figure 5: Representative results for the several steps of strain profiles measurement. 6. FINITE ELEMENTS ANALYSIS
The finite elements analysis of the cubic foam mechanical behaviour under uniaxial compression is implemented using a 3D model with the CAST3M code. As the foam specimen is glued on both sides on aluminium plates, the displacement on the two faces in x and y directions are imposed to be zero. In order to introduce a Young modulus gradient in the z direction, the cube is arbitrarily decomposed of 16 isotropic layers. Some representative results of these simulations are shown in Figure 6. z y x z y x 0 0,01 0,02 0,03 0,04 0,05 -3x10⁻⁴ -2,5x10⁻⁴ -2x10⁻⁴ -1,5x10⁻⁴ long itud inal thickne ss (m)
ε
zz 0 0,01 0,02 0,03 0,04 0,05 0x100 5x10⁻⁵ 1x10⁻⁴ long itud inal thickne ss (m)ε
yy
Unload and deformed cubic foam
Strain field in the longitudinal direction z of the front surface
Strain field in the transversal direction y of the front surface
Figure 6: Results of the simulated strain maps for an isotropic foam specimen under uniaxial loading. 7. INVERSE METHOD
The inverse method to extract the Young modulus profile is based on a very simplified approach which consists in supposing that strain gradient is only due to a local variation of the Young modulus value along the longitudinal direction z. Of course, this approach undergoes a little approximation which neglects the coupling effect of the boundary
conditions, the Poisson ratio and the global profile. In spite of that, we have tried to evaluate the possibility to extract a non uniform Young modulus profile using these considerations.
The validation of this method is made by seeking Young modulus profile along the compression direction as data to enter in the finite elements simulations. This leads to an iterative process which is started with a homogeneous profile. At each iteration step, the strain profile along the longitudinal direction is compared to the strain profile supposed true and, under the assumptions formulated below, the Young modulus gradient is modified following the relation:
true zz k zz k zz k zz
E
E
ε
ε
=
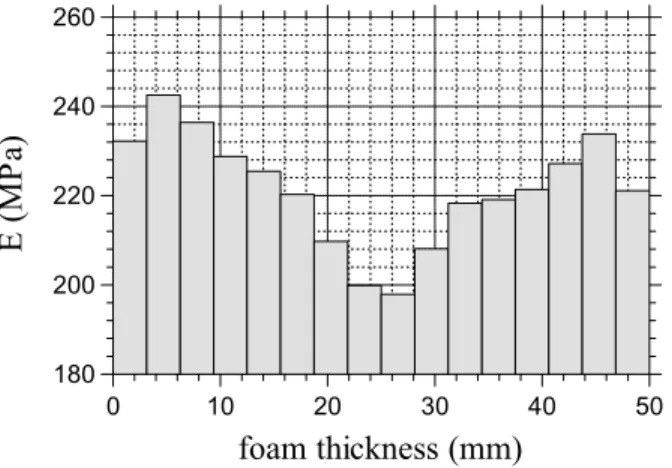
+1 (2)In this case, the Young modulus profile supposed true is derived from the experimental relative CTE variation around a mean value of 220 MPa (Figure 7) and the first Young modulus profile is supposed to be uniform and equal to the mean value. The evolutions of the relative differences of the strain and Young modulus profiles for each iteration are plotted in Figures 8 and 9.
Figure 7: Young modulus profile supposed true for the validation test of the inverse method
0 10 20 30 40 5 180 200 220 240 260 foam thickness (mm) E (MP a) 0 0 0,01 0,02 0,03 0,04 0,05 -6 -4 -2 0 2 4 6 8
foam thickness (m)
∆ε
(%
)
iteration 1 iteration 3 iteration 2 iteration 4 iteration 5 0 0,01 0,02 0,03 0,04 0,05 -6 -4 -2 0 2 4 6foam thickness (m)
∆Ε
(%
)
iteration 1 iteration 3 iteration 2 iteration 4 iteration 5Figure 8: Evolution of the difference between the strain profile supposed true and the strain profile calculated at each iteration.
Figure 9: Evolution of the difference between the Young modulus profile supposed true and the strain profile calculated at each iteration.
8. RESULTS
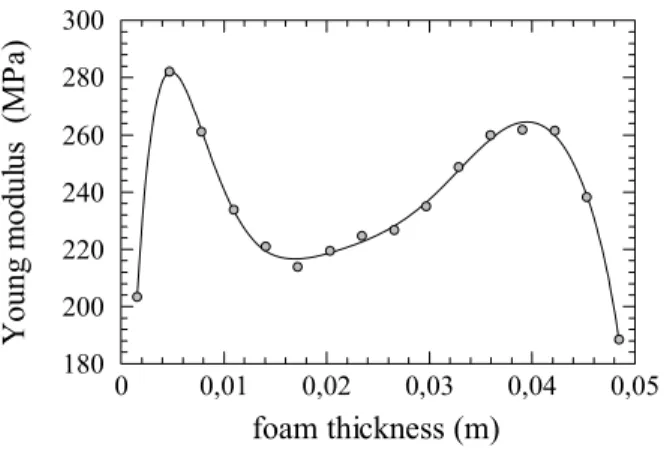
Such as the results obtained in the validation test described below are satisfactory, the same method is used to extract the real Young modulus profile of the foam core along the thickness using the experimental data obtained by speckle interferometry. The Poisson ratio is supposed not dependant of the density profile [10] and its value is calculated to superpose the experimental and simulated İyy strain profile by the same inverse technique. Results are presented in
0 0,01 0,02 0,03 0,04 0,05 -0,035 -0,03 -0,025 -0,02 -0,015 -0,01 -0,005 0 foam thickness (m) st rai n ( %
) Young modulusnon-uniform Young modulus uniform
0 0,01 0,02 0,03 0,04 0,05 180 200 220 240 260 280 300 foam thickness (m) Youn g m odul us (MP a)
Figure 10: Comparison between the experimental strain profile and the strain simulated profile using an uniform E profile.
Figure 11: Young modulus profile identified from the speckle analysis of the cubic foam under loading.
9. CONCLUSION
This paper presents the preliminary results of the identification of a non-uniform Young modulus for a PVC foam core. It has been shown that the experimental procedure using speckle interferometry is particularly suitable for the non contact measure of displacement fields. We have also shown that the combination of a Finite Elements Modelling and an inverse method can be used to extract the mechanical gradient properties such as the Young modulus profile. Some experimental in the identification procedure have now to be planned in order to take into account the full strain fields and to improve the inverse method.
REFERENCES
[1] Morchat R.M. and Hiltz J.A. (1992). Fire Safe Composites for Marine Applications, 24th SAMPE Technical Conference, Toronto, Canada.
[2] Craig A. Steeves, Norman A. Fleck (2004), Collapse mechanisms of sandwich beams with composite faces and a foam core, loaded in three-point bending. Part I : analytical models and minimum weight design, International Journal of Mechanical Sciences, 46, (4), 561–583.
[3] Mills N.J. (2000). Micromechanics of polymeric foams, third Nordic meeting on Material and Mechanics, Aalborg, Denmark, 45-76.
[4] Apetre N. A., Sankar B. V. (2003). Composite sandwich plates with functionally graded cores. Proc. ICSS 7 – International Conference on Sandwich Structures, Fort Lauderdale, Florida – CRC Press.
[5] Kilic B., Das M., Madenci E., Ambur D. R. (2003). Three dimensional analysis of functionally gradient core sandwich panels with a circular hole, Proc. ICSS 7 – International Conference on Sandwich Structures, Fort Lauderdale, Florida – CRC Press.
[6] Davies P., Casari P., Carlsson L.A. (2003). Mechanical testing of foam cores for sandwich structures, Proc. ICSS 7 – International Conference on Sandwich Structures, Fort Lauderdale, Florida – CRC Press.
[7] Ferreira C., Jacquemin F., Casari P. (2006) Measurement of the nonuniform thermal expansion coefficient of a PVC foam core by speckle interferometry – Influence on the mechanical behaviour of sandwich structures, Journal of Cellular Plastics, article in press.
[8] Fringe Analysis Software, Version 2.65 (2003), HOLO3 Company, Saint-Louis, France.
[9] Robinson D. W., Reid G. T. (1993). Interferogram Analysis: Digital Fringe Pattern Measurement Techniques, Bristol: IOP Publishing.
[10] H. Zhu and B.V. Sankar, (2006), Analysis of sandwich TPS panel with functionally graded foam core by Galerkin method, Composite structures, article in press.

![[PDF] Tutoriel avancé pour applications Web Ruby On Rails | Formation informatique](data:image/gif;base64,R0lGODlhAQABAIAAAP///wAAACH5BAEAAAAALAAAAAABAAEAAAICRAEAOw==)