HAL Id: hal-02267408
https://hal.archives-ouvertes.fr/hal-02267408
Submitted on 9 Nov 2020
HAL is a multi-disciplinary open access archive for the deposit and dissemination of sci-entific research documents, whether they are pub-lished or not. The documents may come from teaching and research institutions in France or abroad, or from public or private research centers.
L’archive ouverte pluridisciplinaire HAL, est destinée au dépôt et à la diffusion de documents scientifiques de niveau recherche, publiés ou non, émanant des établissements d’enseignement et de recherche français ou étrangers, des laboratoires publics ou privés.
Charge Transfer Band Gap as an Indicator of Hysteresis
in Li-Disordered Rock Salt Cathodes for Li-Ion Batteries
Quentin Jacquet, Antonella Iadecola, Matthieu Saubanère, Haifeng Li, Erik.
Berg, Jordi Cabana, Marie-Liesse Doublet, Jean-marie Tarascon
To cite this version:
Quentin Jacquet, Antonella Iadecola, Matthieu Saubanère, Haifeng Li, Erik. Berg, et al.. Charge Transfer Band Gap as an Indicator of Hysteresis in Li-Disordered Rock Salt Cathodes for Li-Ion Batteries. Journal of the American Chemical Society, American Chemical Society, 2019, 141 (29), pp.11452-11464. �10.1021/jacs.8b11413�. �hal-02267408�
Charge Transfer Band Gap as an Indicator of Hysteresis in Li-Disordered Rock
Salt Cathodes for Li-Ion Batteries
Q. Jacqueta,b,c, A. Iadecolac, M. Saubanèrec,d, H. Lie, Erik. J. Bergf, G. Roussea,b,c, J. Cabanae,g ,
M.-L. Doubletc,d, and J.-M. Tarascona,b,c
a Collège de France, Chaire de Chimie du Solide et de l’Energie, UMR 8260, 11 place Marcelin
Berthelot, 75231 Paris CEDEX 05, France
b Sorbonne Université, 4 place Jussieu, F-75005 Paris, France
c Réseau sur le Stockage Electrochimique de l’Energie (RS2E), FR CNRS 3459 – France
d Institut Charles Gerhardt, CNRS UMR 5253, Université Montpellier, Place E. Bataillon, 34 095
Montpellier, France
e Department of Chemistry, University of Illinois at Chicago, Chicago, Illinois 60607, United States f Electrochemistry Laboratory, Paul Scherrer Institut, CH-5232 Villigen PSI, Switzerland
g Joint Center for Energy Storage Research (JCESR), Argonne National Laboratory, Lemont, Illinois
Abstract:
Disordered rocksalt compounds showing both anionic and cationic redox are being extensively studied for their very high energy storage capacity. While the Mn-based disordered rocksalt compounds show decent energy efficiency, it is drastically lower in the Ni-based materials due to different voltage hysteresis, 0.5 V and 2 V, respectively. To understand the origin of this difference, we herein report the design of two model compounds Li1.3Ni0.27Ta0.43O2 and Li1.3Mn0.4Ta0.3O2 and study their charge compensation
mechanism through the uptake and removal of Li via an arsenal of analytical techniques. We show that different voltage hysteresis with Ni or Mn substitution is due to differences in the way anionic redox proceeds. We rationalized such a finding by DFT calculations and propose this drastic difference to be nested in the smaller charge transfer band gap of the Ni-based compounds compared to the Mn ones. Altogether these findings provide vital guidelines for designing high capacity disordered rocksalt cathode materials based on anionic redox activity for next generation of Li-ion batteries.
Graphical Abstract O2p E O2p Strong Hysteresis Low Hysteresis
N
i b
as
e
d
M
n
b
as
e
d
O2 O2 O2 O2 Ni - O Mn - OIntroduction:
Electrical energy and transportation are two pillars of our society, and both are provided by fossil fuels, which are unsustainable and polluting resources. To alleviate this issue, great are efforts are being made to make use of renewable energies, for instance coming from wind or sun. However, to succeed in the energy transition based on these intermittent energy sources, energy storage needs to be further developed. Among the storage devices, Li-ion batteries, because of their high energy density1, have conquered most
of today’s portable electronic and EV markets and they stand as serious contenders for grid applications. Despite their widespread use, the energy density of Li-ion battery still needs to be improved to match with the electric cars customers’ requirements in terms of autonomy. This mainly calls for the design of new cathode materials with higher capacity and working potential. Along that line, Li-excess disordered rocksalt oxides (DRS) are interesting materials since they show very high capacity, 300 mAh/g for Li1.3Mn0.4Ti0.3O2 and 250 mAh/g for
Li1.2Ni0.33Ti0.33Mo0.13O2 compared to commercialized materials LiNi0.33Mn0.33Co0.33O2 (200
mAh/g).2–6 Both Li
1.3Mn0.4Ti0.3O2 and Li1.2Ni0.33Ti0.33Mo0.13O2 capacities are the result of the
combined cationic and anionic redox, being the oxidation/reduction of the transition metal and the oxygen lone pairs, respectively.[Seo] Application-wise, Li1.2Ni0.33Ti0.33Mo0.13O2 shows
less interesting properties compared to Li1.3Mn0.4Ti0.3O2 mostly because of a poor energy
efficiency due to a strong voltage hysteresis. Indeed while both compounds have similar redox potentials in oxidation, the Ni-based compounds shows a lower averaged reduction potential of 3 V, due to a sudden drop of voltage of 1.5 V, compared to 3.2 V in the Mn-based one. Interestingly, this phenomenon can be observed in many Ni-Mn-based rocksalt as presented in Table 1 3,5,7–10, but never in Mn-based compounds. The origin of such feature
has been investigated in only two studies: i) Lee et al. attributed this phenomena to the formation of a Li – poor layer at the surface of the material during charge, impeding Li diffusion for Li1.2Ni0.33Ti0.33Mo0.13O2 5and ii) Zhao et al. proposed the reduction of Mn/Mo due
to oxygen release in Li1.2Ni0.4Mn0.2Mo0.2O2 10. To check the validity of these hypotheses, we
propose a detailed comparison of two new Ni and Mn- based DRS model systems. To synthetize such phases, d0 elements are used to stabilize the cation disordering, based on
early work by Urban et al. 11. Numerous d0 elements such as Ti4+, Nb5+ or Mo6+ have already
been used to make Li-based DRS. Herein, we propose to use Ta5+ as d0 element and therefore
i) assess the origin of the different discharge potentials between Mn-based and Ni-based compounds, and ii) probe the role of Ta5+ (5d0) substitution in the overall redox processes,
compared to Nb5+ and Mo6+ (4d0), or Ti4+ (3d0). The Li
1.3Ni0.27Ta0.43O2 and Li1.3Mn0.4Ta0.3O2
compounds were synthesized as single phases and their electrochemical behavior was investigated via complementary techniques such as Online Electrochemical Mass Spectrometry (OEMS), X-ray Absorption Spectroscopy (XAS) and X-Ray Diffraction (XRD). The Ni-based one shows instability against O2 release upon intensive oxidation as opposed to the
Mn-one. Additionally, we show that the drop of potential observed in the Ni-based compound is due to the low reduction potential of anionic redox occurring at 1.5 V compared to 3 V for the Mn-based one. Both the enhanced gas release and voltage hysteresis for the Li1.3Ni0.27Ta0.43O2, are attributed to its low band gap due to the presence of
Ni3+ (d4), as shown by DFT calculation. For the sake of clarity, we first briefly describe the
synthesis of these compounds together with their general electrochemistry prior to present the mechanism of the Li-removal/uptake in Li1.3Ni0.27Ta0.43O2 and Li1.3Mn0.4Ta0.3O2 separately.
Then, we will engage into a theoretical approach focusing on the charge transfer band gap in these materials.
Composition Potential drop in
discharge Proposed origin Ref.
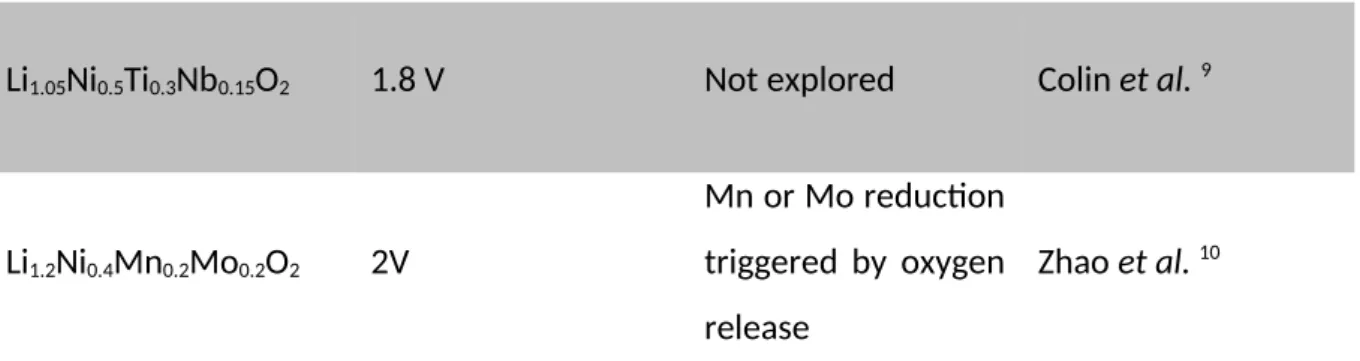
Li1.33Ni0.33W0.33O2 2 V Not explored 7
Li1.3Ni0.27Nb0.43O2 2 V Not explored Yabuuchi et al. 3
Li1.2Ni0.33Ti0.33Mo0.16O2 1.5 V
Kinetic limitation
-formation of
densified surface
Lee et al. 5
Li1.05Ni0.5Ti0.3Nb0.15O2 1.8 V Not explored Colin et al. 9 Li1.2Ni0.4Mn0.2Mo0.2O2 2V Mn or Mo reduction triggered by oxygen release Zhao et al. 10
Table 1: Composition, amplitude of the potential drop observed during discharge and the origin of such feature for reported Ni-based compounds.
Experimental details:
Synthesis: Classical solid state synthesis from the oxide precursors, NiO (green, Sigma-Aldrich 99%), Mn2O3
(Sigma-Aldrich, 99.9%), Ta2O5 (Alfa Aesar, 99.85%) and with 10% excess Li2CO3 (Sigma Aldrich, 99%), was
employed to prepare the Li1.3Ni0.27Ta0.43O2 and Li1.3Mn0.4Ta0.3O2 phases. The reactants were mixed using mortar
and pestle before grinding in a planetary ball mill using a zirconia set for 1 hour at 600 rpm for the Li1.3Ni0.27Ta0.43O2 precursors and 12 hours at 600rpm for Li1.3Mn0.4Ta0.3O2 precursors. The powders were fired for
24 h at 900°C in air for Li1.3Ni0.27Ta0.43O2 and under argon flux for Li1.3Mn0.4Ta0.3O2.
Electrochemical testing: All the electrochemical characterization was performed in Swagelok-type cells. The positive electrode material was grinded in SPEX-type ball mill for 60 min with 20% carbon SP. Note that shorter ball mill time resulted in poorer electrochemical properties as presented Figure S1. Then, the active material and carbon mix was embedded into a PTFE matrix. The final electrode showed the following composition: 72% active material/18% carbon/10% PTFE. Li metal was used as anode. Whatmann GF/D borosilicate glass fibers sheets were used as separators and the electrolyte was LP100 (1/1/3 EC/PC/DMC with 1M LiPF6). Cells were
assembled in Ar-filled glovebox. Galvanostatic cycling was performed at C/20 (meaning 1 Li is extracted in 20 h). Ex situ samples were washed with DMC inside an Ar-filled glovebox before being dried under vacuum. Galvanostatic Intermittent Titration Technique (GITT) was performed using OCV period of 5h.
Structural characterization: XRD measurements are performed using a BRUKER D8 Advance diffractometer with Cu Kα radiation (λKα1=1.54056 Å, λKα2=1.54439 Å) and a Lynxeye XE detector. Operando experiment are
performed using the same diffractometer with a home-made airtight electrochemical cell equipped with a Be window 12. Neutron powder diffraction (NPD) patterns were measured on the D1B powder diffractometer at ILL
Hard X-ray Absorption Spectroscopy (XAS): Operando XAS measurements at the Ni and Mn K-edges and ex situ measurements at the Ta L3-edge were performed in transmission mode at the ROCK beamline14 of synchrotron
SOLEIL (France). A Si (111) channel-cut quick-XAS monochromator with an energy resolution of 0.8 eV at 8 keV was used. The intensity of the monochromatic X-ray beam was measured by three consecutive ionization detectors. For the operando measurement, the in situ electrochemical cell was placed between the first and the second ionization chambers. All samples were prepared as self-standing PTFE films of the active material and cycled at C/20. Successive spectra were collected at a rate of 2 Hz and averaged out over periods of 5 minutes. The energy calibration was established with simultaneous absorption measurements on Ni, Mn or Zn foils placed between the second and the third ionisation chamber. All data was treated using the Demeter package for energy calibration and normalization.15 For the operando data, the normalized spectra were
globally analyzed with Principal Component Analysis (PCA)16 in order to individuate the orthogonal components
able to describe the whole evolution during cycling. The number of principal components was then used as basis for Multivariate Curve Resolution-Alternating Least Squares (MCR-ALS) analysis.17 Finally, the
reconstructed components as well as the ex situ spectra were fitted using the Artemis software. Fourier transforms of k2 weighted EXAFS oscillations were carried out in k-range from 3.5 Å−1 to 12 Å−1 for Ni K-edge and
5.1 Å−1to 11 Å−1 for the Mn K-edge. For Ta L
3-edge, the Fourier transforms of k3 weighted EXAFS oscillations
were carried out in k-range from 3.7 Å−1 to 13.7 Å−1 and the fitting was performed in R-range from 1.0 to 3.5 Å.
EXAFS amplitudes and phase-shifts were calculated by FEFF7. Mn2O4 reference for XAS was prepared by full
delithiation of the LiMn2O4 spinel.
Soft XAS: measurements at the Ni L-edge, Mn L-edge and O K-edge were performed at beamline 4-ID-C of the Advance Photon Source at Argonne National Laboratory. Transport and sample loading was performed minimizing exposure to air. Data were measured simultaneously under both the total electron yield (TEY) mode with the sample photocurrent at ∼10-9 Torr and total fluorescence yield (TFY) mode by a silicon drift diode
detector. The angle of X-ray incidence in TFY mode was adjusted to minimize the self-absorption effect while still being bulk sensitive. Data was obtained at a spectral resolution of ∼0.2 eV, with a 2 s dwell time. During the measurement, three scans were performed at each absorption edge for each sample, and scans were then averaged to maximize the signal-to-noise ratio. Oxygen K-edge XAS was calibrated measuring simultaneously Sr2RuO4 as a reference.
Online Electrochemical Mass Spectrometry (OEMS): A detailed schematic of the OEMS setup is provided elsewhere. 18 Briefly, the OEMS operates with a quadrupole mass spectrometer (QMS 200, Pfeiffer, Germany)
for partial pressure measurements and a pressure transducer (PAA-33X, Keller Druck AG, Switzerland) for total cell pressure recordings, temperature, and internal volume determination. Swagelok stainless steel gas pipes and fittings (3 mm compression tube fittings, Swagelok, OH, USA) are employed to connect a homemade OEMS cell, a set of solenoid valves (2-way magnetic valve, Series 99, silver-plated nickel seal, Parker, USA) and a scroll pump (nXDS15i, EDWARDS GmbH, UK) for efficient flushing. The valves are electronically controlled with a Solid
State Relay Module (NI 9485 measurement System, National Instruments, TX, USA) connected to a computer with a LabView Software (NI Labview 2013, National Instruments, TX, USA). For partial pressure and gas evolution rate analysis 0.8 mL of gas are extracted from the headspace (~ 4 mL) of the cell and replaced by pure Ar (quality 5.0). Calibration gas bottles were utilized to relate the MS ion-current signals at m/z = 32 and 44 to known concentrations of O2 and CO2 (1000 ppm of O2 and CO2 in Ar, respectively), before and after the
measurement.
DFT: Spin-polarized density functional theory (DFT) calculations were performed using the plane-wave density functional theory VASP (Vienna ab initio simulation package) code19,20 within the generalized gradient
approximation of Perdew−Burke−Ernzerhof (PBE) to describe electron exchange and correlation21. The
rotationally invariant Dudarev method (DFT + U)22 was used to correct the self-interaction error of conventional
DFT for correlated d-electrons with U = 6.4 eV and 5 eV for the Ni- and Mn-based compounds, respectively. Homemade cluster expansion code has been used to identify low energy cationic configurations in the pristine materials, Li1.3Ni0.27Ta0.43O2 and Li1.3Mn0.4Ta0.3O2. Note that for the latter, the chemical composition of the
theoretical model is Li1.3Ni0.3Ta0.4O2. A unit cell of 40 atoms was used with cell parameters of a= 6 Å, b= 6 Å, c=
12 Å, α= 90°, β=90°, γ= 60°. The structural search was carried out in two steps. First, Ta networks minimizing the unfavorable Ta – Ta next-nearest neighbors (NNN) were chosen. Indeed, the energy of the structure is drastically influenced by the number of NNN Ta – Ta interactions as shown in Figure S22. Second, all the possible Li and Ni/Mn configurations were generated and the most stable structures were selected for further analysis. To assess the validity of our approach, we computed the DFT energy of the 50 lowest energy structures deduced from our cluster expansion calculations, and compare these energies to the DFT energy of random cation orderings, as shown in Figure S23. It can be seen that using our cluster expansion code, we could identify low energy cation ordering with negligible computational cost. Convex Hull diagrams were then produced from the delithiation of the chosen structural models. The voltage profiles, Bader charges, atomic distances and O2 release enthalpies were computed and showed good agreement with experiments as shown
in Figure S24, S25 and S26.
Results.
Li1.3Ni0.27Ta0.43O2 (LNTO) and Li1.3Mn0.4Ta0.3O2 (LMTO) were synthetized via solid state method.
The precursors were ground for 1h for LNTO and 12h for LMTO and fired at high temperature under air for the LNTO and argon for the LMTO. The composition were chosen so that the Li content is similar in both compounds, with Ni, Mn and Ta being at the 2+, 3+
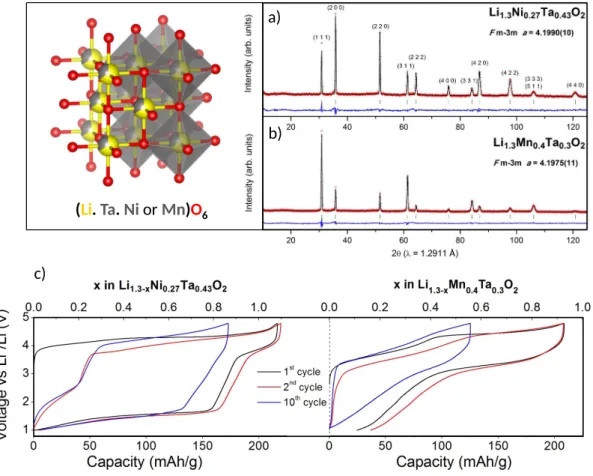
and 5+ oxidation states, respectively. The structure of these new compounds was determined by XRD coupled to NPD which patterns are presented Figure S2 and Figure 1 a-b). XRD and NPD are complementary here as they provide different contrast between atoms (ZLi = 3 and bLi = -1.90 fm, ZMn = 25 and bMn = -3.73 fm, ZNi = 28 and bNi = 10.3 fm, and ZTa = 73
and bTa = 6.91 fm). Both products crystalize in F m -3 m space group with cell parameters a =
4.1990(10) Å and a = 4.1975(11) Å for LNTO and LMTO, respectively (Table S1). Their structure is a rocksalt structure with all the cations randomly distributed over the 4a Wyckoff position as it can be seen on the schematic Figure 1. The electrochemical behavior of LNTO and LMTO as cathode for Li-ion battery was investigated. The 1st, 2nd and 10th cycles
for each compound are presented in Figure 1 c-d). LNTO and LMTO show discharge capacities of 220 mAh/g and 180 mAh/g, respectively. They correspond to the extraction/insertion of 1.1 Li for LNTO and 0.9 Li for LMTO. Although the capacity of LNTO is higher than LMTO, the Ni-based compound shows a lower average discharge potential since only 0.25 Li are inserted above 3 V compared to 0.6 Li for LMTO. This low average voltage has been observed in other Ni-based disordered rocksalt compounds and it is detrimental for the energy density and energy efficiency, hence the need to understand its origin. Is it related to diffusion issues, cationic vs. anionic redox competition, or Li-driven structural changes? To answer these questions, complementary operando XAS, OEMS and XRD measurements were performed.
c)
(Li. Ta. NiorMn)O6
a)
b)
Figure 1 : a) and b) Rietveld refinement of NPD patterns of Li1.3Ni0.27Ta0.43O2 and
Li1.3Mn0.4Ta0.3O2, respectively . The red crosses, black continuous line and bottom blue line
represent the observed, calculated, and difference patterns respectively. Vertical green tick bars are the Bragg positions. c) Voltage-composition curve of 1st, 2nd and 10th cycles of the
galvanostatic cycling of LNTO and LMTO in the left and right panels, respectively.
Mechanism of Li removal/uptake in Li1.3Ni0.27Ta0.43O2
The voltage-composition curve for LNTO shows 6 distinct processes: 3 in charge and 3 in discharge, hereafter called CN1, CN2, CN3, DN4, DN5 and DN6, as highlighted in Figure 2-a) (C, D and N stand for “Charge”, “Discharge” and “Nickel”, respectively). Upon charge, the three processes CN1, CN2, and CN3 happen at 4 V, 4.3 V and 4.5 V as deduced from the dQ/ dV curve and account for the extraction of 0.3, 0.4 and 0.4 Li, respectively. Upon discharge,
the processes DN4, DN5, and DN6 occur at 3.8 V, 1.7 V and 1.3 V and correspond to the insertion of 0.25, 0.5 and 0.3 Li,respectively. Concerning the 2nd charge, a new redox process
can be seen centered around 1.7 V. Its capacity scales with the capacity of DN6, hence showing their correlation (Figure S3), however its origin is not yet understood.
Next, to determine the corresponding oxidation-reduction process, several cells were made and oxidized to reach different SOC prior to be discharged to 1.5 V Figure 2 b-c). Interestingly, when charging over CN1, the reduction curve is mainly composed of DN4 implying the link between both. Moreover, there is appearance of DN5 when further charging, hence a clear connection between CN2-CN3 and DN5 with however a large voltage difference. Worth mentioning is that the capacity of DN4 decreases with increasing SOC and this trend is even more severe at 55°C. Moreover, despite strong polarization observed during DN5 on the GITT curve (Figure 2-d) equilibrium potential do not reach 3.5 V implying that the observed voltage difference is not only kinetic but also enlists a thermodynamic limitation suggesting different reduction and oxidation paths. Thus, could such an effect be related to a peculiar charge compensation mechanism having sluggish kinetics associated with the anionic redox species as previously reported in Li-rich materials?23
Figure 2: a) Voltage-composition curve of the 1st galvanostatic cycle and its dQ/dV profile, on
the left and right panels respectively. b) and c) voltage-composition curve of the 1st cycle
with different states of charge (top) together with the capacity of DN4 (>3 V) depending on the SOC (bottom) at 25°C and 55°C. d) GITT measurement performed on the 1st cycle of
LNTO.
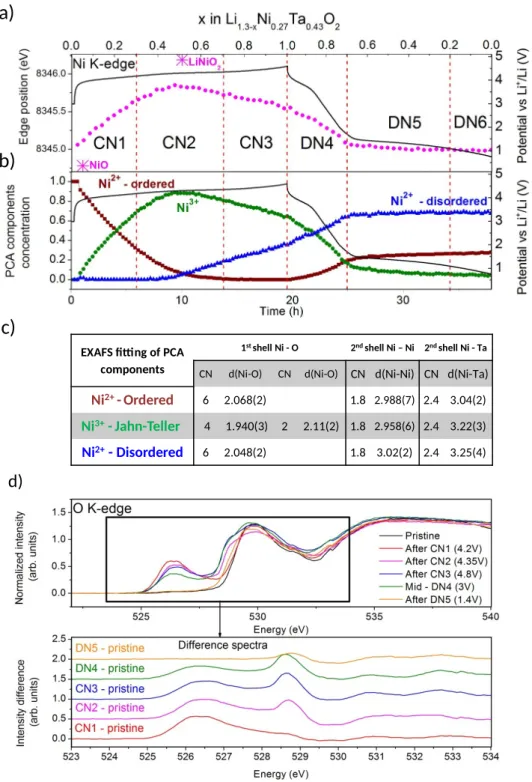
To clarify this point we used operando Ni K-edge and ex situ Ni L3-edge, Ta L3-edge and O
K-edge XAS to determine the evolution of Ni, Ta, and O oxidation states during cycling. First, we monitor the variation of Ni oxidation state by exploiting, operando the Ni K-edge position during the electrochemical cycling that we compare with standards, namely NiO (Ni2+) and
LiNiO2 (Ni3+) as presented in Figure 3-a and Figure S4. The Ni oxidation state is close 2+ in the
pristine compound and increases up to nearly 3+ during the first part of charge (CN1 and CN2). Upon further charging, there is a reduction of Ni3+ which becomes nearly Ni2.5+ at the
end of charge (Figure S5). During DN4, the oxidation state of Ni converts back to ≈2 and stays constant during DN5 and DN6.
The XAS spectra evolution during the electrochemical cycle was further exploited using Principal Component Analysis (PCA) combined to Multivariate Curve Resolution-Alternating Least Squares (MCR-ALS). Three components were identified and both their concentration evolution and their corresponding EXAFS were analyzed and presented in Figure 3 b-c, Figure S6 and Table S2. The 1st and 2nd components correspond to the pristine material and the
phase having solely Ni3+, respectively. The 3rd component appears in the middle of the
charge, end of CN2. Its concentration increases gradually up to 60% at the end of DN4 and stays constant during the rest of the discharge. In this component, Ni is in the same oxidation state than in the pristine, ≈2+, as determined from their edge position (Figure S7) and their EXAFS signal showing similar Ni-O environments as opposed to a distorted environment (Jahn –Teller distortion) for the 2nd component. The main difference between
the pristine and the 3rd component is nested in the Ni-M environment. Indeed, the values
obtained for the Ni – Ni distances, the Ni – Ta distances and the related Debye-Waller factors are higher in the 3rd component indicating a higher atomic disorder of the end of discharge
compound compared to the pristine (Table S2). Note that Ni K-edge and Ni L3-edge data
measured on ex situ samples are consistent with the operando data as presented in Figure S8 and Figure S9.
d)
EXAFS fitting of PCA components
1st shell Ni - O 2nd shell Ni – Ni 2nd shell Ni - Ta CN d(Ni-O) CN d(Ni-O) CN d(Ni-Ni) CN d(Ni-Ta)
Ni2+ - Ordered 6 2.068(2) 1.8 2.988(7) 2.4 3.04(2) Ni3+- Jahn-Teller 4 1.940(3) 2 2.11(2) 1.8 2.958(6) 2.4 3.22(3) Ni2+- Disordered 6 2.048(2) 1.8 3.02(2) 2.4 3.25(4)
a)
b)
c)
Figure 3 : a) Evolution of the Ni K-edge position (pink) during operando measurement for the 1st cycle of LNTO together with the voltage-composition curve (black). The value of the edge
position is the energy at 0.8 of the edge step. Edge position of NiO and LiNiO2 are given as
reference for Ni2+ and Ni3+, respectively. b) Evolution of the concentration of the components
deduced from MCR-ALS during operando measurement, in brown, green, and blue, together with the voltage-composition curve in black. c) Table summarizing the principal information extracted from the EXAFS fitting. d) TFY O K-edge XAS spectra for ex situ samples during the
charge and discharge, together with the difference spectra between the pristine and the spectra of the ex situ samples in the bottom insert.
Ta L3-edge and O K-edge measurements were performed on ex situ samples recovered from
Li1.3Ni0.27Ta0.43O2/Li cellsstopped at various states of charge/discharge; after CN1 (4.2 V and x
= 0.3), after CN2 (4.5 V and x = 0.7), and after CN3 (4.8 V and x = 1.1), in DN4 (3V and x = 0.85) and after DN5 (1.2 V and x = 0.3). Concerning Ta, for all samples the edge position is similar to the one in Ta2O5, spotted from the maximum of the first derivative of the
normalized intensity (Figure S10), showing Ta stays in the 5+ oxidation state during cycling. However, the white line shape and intensity changes show evolution of the Ta environment during Li removal/uptake. To better assess these changes, analysis of EXAFS oscillations was carried out (Figure S11). It shows that while the average Ta – O and Ta – M (M being Ni and Ta) distances stay nearly constant during the Li removal/uptake, approximately 1.95 Å and 3.1 Å, the distortion coefficient of the TaO6 octahedron, calculated from the mean deviation
of Ta-O bond lengths, changes substantially (Table S3). From these results, we concluded that Ta is not oxidized/reduced during the electrochemical cycling but suffers from modification of its coordination shell, which is highly distorted at the end of charge (CN3) and at the beginning of discharge (DN4).
Altogether, the previous findings dealing with the Ni and Ta redox during the 1st cycle lead us
to hypothesize that anionic redox is responsible for the charge compensation mechanism during CN2, CN3 and DN5. To prove this hypothesis, we analyzed the pre-edge features (525 – 532 eV) of the O K-edge spectra (Figure 3-d). Two main features at 526.5 eV and 530 eV can be observed. They correspond to electronic transitions from O 1s into hybridized oxygen 2p states with nd cations. Using O pDOS computed via DFT calculations (Figure S12), we show that the 526.5 eV feature corresponds to Ni-O states which appears solely in presence of Ni3+, while the 530 eV signal is reminiscent of both Ni-O and Ta-O states. By subtracting
the pristine from the ex situ spectra (Fig. 3e bottom) we highlight its evolution during the 1st
cycle which is mainly centered at 526.5 eV and 528.7 eV. The 526.5 eV feature intensity is maximum after CN1 and decreases during CN2, CN3 and DN4 directly following the presence of Ni3+ in agreement with DFT calculations. The second feature at higher energy (528.7 eV)
which appears during CN2 and increases during CN3, clearly suggest the removal of some electronic density on the oxygen atoms. Since neither Ni nor Ta is active in this region of the charge, the presence of the 528.7 eV is a direct evidence of anionic redox. Interestingly, the 528.7 eV signal remains constant during DN4 and fully disappears in DN5 as expected. This does not come as a full surprise as other studies have been successfully observing anionic redox in the O K-edge pre edge features.24 In short, we have shown that Ni
oxidation/reduction happens at ≈3.9 V with limited polarization ≈100 mV while anionic redox occurs at 4.2 V in charge and 1.5 V in discharge, clearly implying that anionic redox is therefore responsible for the large voltage hysteresis observed in LNTO.
To better understand the characteristics of anionic redox in LNTO, namely the stability of the oxidized oxygen species towards O2 release, OEMS experiments were performed. The
results, presented in Figure 4-a, show initially no gas evolution upon oxidation. In contrast, there is a copious amount of CO2 and O2 produced inside the cell as soon as we reach the
CN3 process. Interestingly, this gas production is concomitant with the partial reduction of Ni3+ suggesting that a fraction of the released oxygen atoms in CO
2 and O2 molecules come
from the bulk of the material. It is consistent with previous work, done by Luo et al., showing that both oxygen atoms from O2 gas come from the material in Li Rich NMC.25 Such findings
suggest O – O pair formation occurs in LNTO during charge. Note, that there is no gas evolution during discharge implying that the formed O2 gas molecules do not reduce (Figure
a)
b)
c)
d)
e)
Figure 4 : a) Molar ratio of O2/LNTO and CO2/LNTO measured via mass spectrometry during
galvanostatic cycling together with the voltage-composition curve, in orange, green and black, respectively. b) Voltage-composition curve of the galvanostatic cycling during
operando XRD measurement together with the cell parameter variation extracted from the
patterns using Rietveld refinement. Black, red, and blue dots correspond to the cell parameters of the different phases. c-d-e) Rietveld refinement of specific patterns of the
operando experiment. The red crosses, black continuous line and bottom blue line represent
the observed, calculated, and difference patterns respectively. Vertical green tick bars are the Bragg positions.
At this stage, it is important to check whether the release of oxygen at high potential is associated with structural changes, hence our motivation to perform operando X-ray diffraction. Figure 4 b-c-d-e) presents the electrochemical cycle and the result of the Rietveld refinement of the XRD patterns. We recall that the pristine crystallizes in a cubic space group
F m -3 m, with therefore one cell parameter, a. During CN1, the cell parameter decreases
gradually which is consistent with Ni oxidation (Ni2+ Ni3+), then stays constant through CN2
during which oxygen is oxidized but not released from the material. In the middle of CN3, when Oleaves the material, the appearance of a shoulder peak can be seen in the XRD pattern which can be indexed using the same space group as the pristine with however a smaller cell parameter, 4.148 Å compared to 4.1990(10) Å (Figure 4-d). The chemical composition of this new phase, now called “high voltage phase”, could not be estimated due the overlap of its peaks with the pristine ones. During discharge, the cell parameters of both phases decrease and convert back to that of the pristine material with however a larger peak width indicative for the presence of strain, consistent with the XAS data.
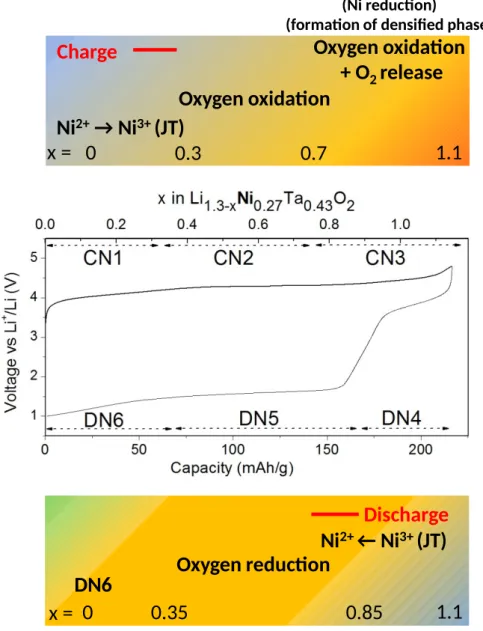
Altogether these data provide an accurate description of the material’s evolution during the first charge that can be schematically summarized in Figure 5). We could identify the origin of the voltage hysteresis, caused by drastically different charge and discharge potential for anionic redox. Looking for characteristics of anionic redox in LNTO, we found that it rapidly leads to O2 release upon oxidation together with structural evolution. To further understand
the correlation between anionic redox and voltage hysteresis, a similar study is performed on LTMO which shows less hysteresis compared to LNTO.
Ni
2+→ Ni
3+(JT)
Oxygen oxidation
(Ni reduction)
(formation of densified phase)
Oxygen oxidation
+ O
2release
0
0.3
0.7
1.1
Charge
x =
Ni
2+← Ni
3+(JT)
0
0.35
0.85
1.1
Oxygen reduction
Discharge
x =
DN6
Figure 5: Schematics presenting the charge compensation mechanism in Li1.3Ni0.27Ta0.43O2
Mechanism of Li removal/uptake in Li1.3Mn0.4Ta0.3O2
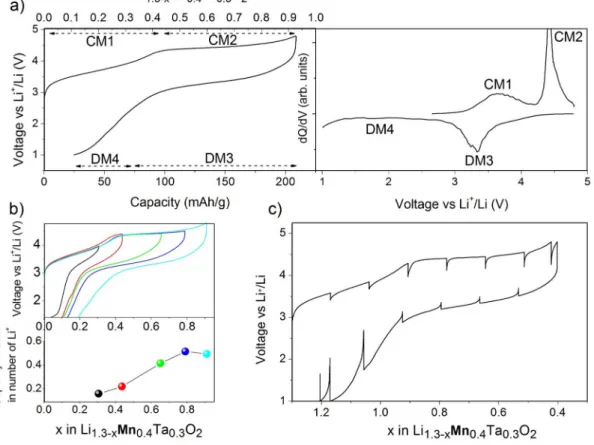
The voltage-composition curve for Li1.3Mn0.4Ta0.3O2 is shown Figure 6 a) together with its dQ/
dV profile. We observe two oxidation peaks at 3.9 V (CM1) and 4.5 V (CM2) which correspond to the removal 0.4 and 0.5 Li,respectively, and two reduction peaks, one well pronounced at 3.4 V (DM3) and another one (DM4) spread in voltage (3-1 V) corresponding to the insertion of 0.6 and 0.2 Li. Following the same procedure as for the Ni-based compound, we could deduce that both CM1 and CM2 are merged into DM3 in discharge
showing the irreversibility of the redox chemistry (Figure 6 b). Moreover note that DM4 appears only after charging at high SOC, hence its straight correlation with CM2. By comparison with the voltage-composition profile for the Ni-based compound, we observe that the abrupt potential jump upon reduction is replaced, in the Mn-phase, by a smoother decay and a lower polarization as deduced from GITT measurements Figure 6 c).
Figure 6: a) Voltage-composition curve of the 1st galvanostatic cycle of LMTO together with
its dQ/dV profile emphasizing the CM1, CM2, DM3 and DM4 processes. b) 1st galvanostatic
cycle at different SOC together with the discharge capacity, in number of Li, of DM3 (>3 V) in the bottom panel. c) GITT of the 1st cycle of LMTO.
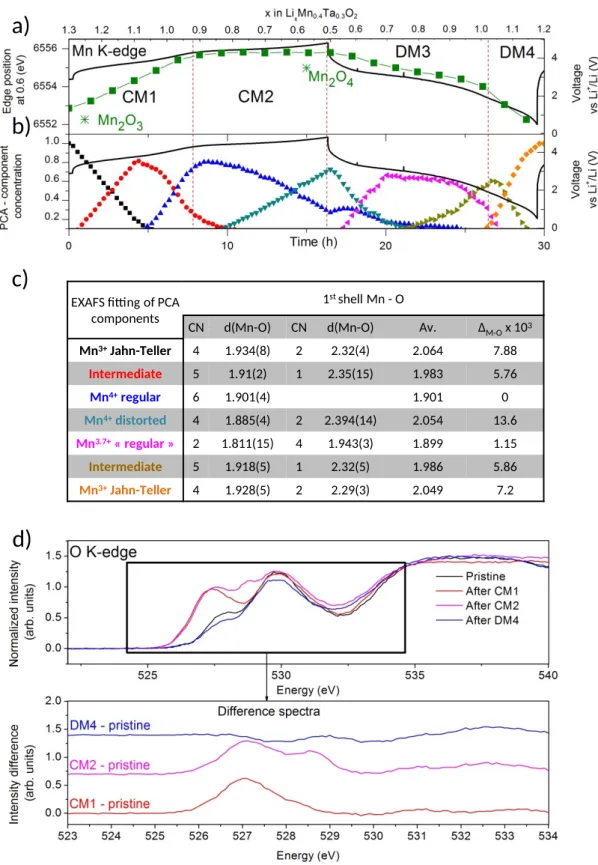
Once again, XAS was performed to access the charge compensation mechanism in Li1.3Mn0.4Ta0.3O2 and the results are shown in Figure 7 and Figure S14. Following the Mn
K-edge position during operando measurement and comparing it with the reference spectra of Mn2O3 (Mn3+) and Mn2O4 (Mn4+), it can be concluded that Mn is 3+ in the pristine material,
oxidizes to Mn4+ during the first part of the charge (CM1) and remains as such afterwards
(CM2). On discharge, Mn4+ is continuously reduced back to Mn3+ through DM3 and DM4.
The data were further exploited using PCA coupled to MCR-ALS analysis. Seven components were needed to describe the evolution of Mn oxidation state and environment during Li removal/insertion. The evolution of the concentrations of the reconstructed components together with the analysis of their EXAFS oscillations are presented in Figure 7 b-c), Figure S15 and Table S4, while the XANES part is shown in Figure S16. In short, in the pristine compound, Mn3+ sits in a Jahn-Teller distorted environment which converts back to a regular
one when Mn3+ is oxidized ( during CM1). Upon further oxidation (CM2), the Mn
environment distorts while its oxidation state remains constant (4+) implying a non-pasive role of the anionic network. During reduction, the Mn environment converts back to the pristine following nearly the same transformation while Mn continuously reduces from +4 to +3. These findings were further confirmed by ex situ Mn K-edge and L2/3-edge data as presented in Figure S17 and Figure S18.
EXAFS fitting of PCA components
1st shell Mn - O
CN d(Mn-O) CN d(Mn-O) Av. ΔM-Ox 103
Mn3+Jahn-Teller 4 1.934(8) 2 2.32(4) 2.064 7.88 Intermediate 5 1.91(2) 1 2.35(15) 1.983 5.76 Mn4+regular 6 1.901(4) 1.901 0 Mn4+distorted 4 1.885(4) 2 2.394(14) 2.054 13.6 Mn3.7+« regular » 2 1.811(15) 4 1.943(3) 1.899 1.15 Intermediate 5 1.918(5) 1 2.32(5) 1.986 5.86 Mn3+Jahn-Teller 4 1.928(5) 2 2.29(3) 2.049 7.2
a)
b)
c)
d)
Figure 7: Evolution of the Mn K-edge position, in green, during operando measurement for the 1st cycle together with the voltage composition curve, in black. b) Concentration
evolution obtained by MCR-ALS during the operando measurement, dots, together with the galvanostatic cycling in black. c) Table summarizing the principal information extracted from
the EXAFS fitting. Oxidation states indicates in the table are obtained assuming a linear correlation between edge position and oxidation state d) TFY O K-edge XAS spectra for ex
situ samples during the charge and discharge, together with the difference spectra between
the pristine and the spectra of the ex situ samples in the bottom insert.
Next, ex situ Ta L3-edge XAS were measured after CM1, CM2, DM3 and DM4 to assess to
participation of Ta in the redox mechanism. From the data presented in Figure S19, Figure S20 and Table S5, nearly no change can be observed in the XANES or EXAFS region proving Ta is inactive during the electrochemical cycle. At this stage, to interrogate the oxygen activity, ex situ O K-edge spectra collected on samples recovered from Li1.3Mn0.4Ta0.3O2 /Li
cells stopped at the end of CM1 (4.2 V and x = 0.4), CM2 (4.8 V and x = 0.9) and DM4 (1 V and x = 1.2). The results are shown in Figure 7a together with the spectra differences, processed as before, with the main evolution centered at 527 eV and 528.7 eV. From O pDOS calculated via DFT (Figure S21), we can attribute the 527 eV feature to Mn-O states which is consistent with the observed intensity increase during CM1 and its constancy through CM2. Similarly, the second peak at 528.7 eV which increases during CM2 is attributed to the anionic redox bearing in mind that Mn and Ta are inactive in this region. It is worth mentioning that in both LNTO and LMTO, the O K-edge feature associated to anionic redox appears at the same energy. This is consistent with the fact that anionic redox involves the oxidation of non-bonding levels which energy only depends on electrostatic interactions being of similar amplitude in LNTO and LMTO. Overall, it results that both compounds show anionic redox activity associated to a voltage hysteresis which is quite larger for LNTO as compared to LMTO, hence the need to understand the origin of this difference.
To check the outcome of the anionic redox species in LMTO, we performed OEMS. No gas evolution was detected through CM1 while a copious amount of CO2 which is likely coming
from electrolyte decomposition is observed afterwards (CM2). Minute traces of O2 towards
the extreme end of the charge are observed in contrast with the large O2 release observed
for the Ni-based compound. Further assessing the difference between LNTO and LMTO,
operando XRD has been carried on. Figure 8 a) presents the voltage-composition curve
Interestingly, a decreases from 4.1975(11) Å to 4.129(3) Å during Mn3+/Mn4+ oxidation, in
agreement with EXAFS data, and then remains constant while showing a peak broadening. A continuous decrease of a is observed on the subsequent discharge. We should recall that under the same oxidation process we have note the appearance of an extra phase in LNTO samples.
b) a)
Figure 8: a) Voltage-composition curve, patterns and cell parameters extracted from Rietveld refinement of the operando XRD measurement from right to left. B) OEMS results for LMTO, showing the evolution of the molar ratio between O2 and CO2 and the active material, in
orange and green, together with the galvanostatic cycling data in black.
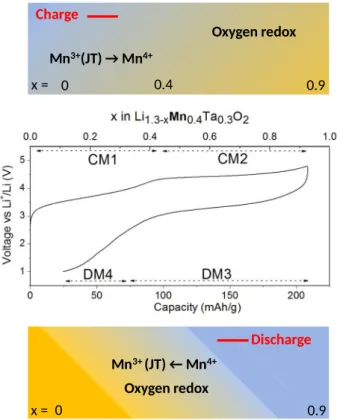
Overall through complementary operando techniques, we can propose for Li1.3Mn0.4Ta0.3O2
the electrochemical reactivity path schematized in Figure 9. It drastically differs from the one previously established for LNTO by the anionic reduction potential which is of 3V for LMTO as opposed to 1.5V for LNTO. Additionally, a greater stability of LMTO over LNTO against O2
Mn3+(JT) → Mn4+ Oxygen redox 0 0.4 0.9 Charge Mn3+ (JT) ← Mn4+ Oxygen redox 0 Discharge 0.9 x = x =
Figure 9: Schematics representing the charge compensation mechanism for Li1.3Mn0.4Ta0.3O2
Understanding the different anionic redox mechanisms using DFT calculations
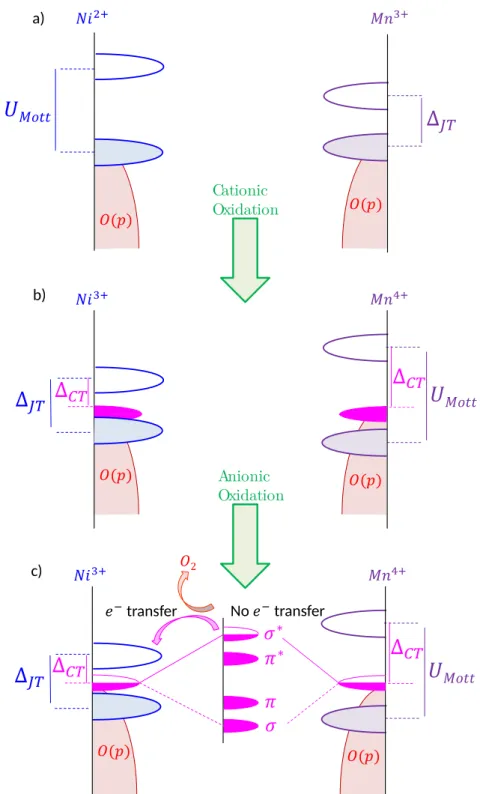
DFT calculations were performed to determine the electronic band structure evolution of both materials upon delithiation. They are shown in Figure 10-a and Figure S24. Pristine Li1.3Ni0.3Ta0.4O2 compound displays a large Mott-Hubbard band gap, consistent with the strong
electronic stabilization expected for a half-filled system (Ni2+ t
2g6eg2 electronic
configuration).26 The partially oxidized phase Li
0.9Ni0.3Ta0.402 displays a narrow charge transfer
gap, denoted as ∆CT in Figure 10-b, due to the Jahn-Teller distortion of Ni3+. Amusingly, the
partial delithiation of Li1.3Mn0.4Ta0.3O2 into Li0.9Mn0.4Ta0.3O2 leads to the reverse scenario. The
narrow Jahn-Teller band gap (Mn3+) for pristine LMTO becomes a wide charge transfer gap in
the oxidized sample due to the large Mott splitting of the Mn4+ half-filled t
2g3 states. This
difference in charge transfer gaps prior the occurrence of the anionic activity is at the origin of the different anionic redox mechanism.
Cationic Oxidation a) b) transfer No transfer c) Anionic Oxidation
Figure 10: a), b) and c) are schematics of the Density of State (DOS) for pristine LNTO and LMTO, after the cationic process and during the anionic process, respectively. Blue, purple, magenta and red states stand for Ni-O*, Mn-O*, O non-bonding and O(2p) states, respectively.
During anionic redox, for both compounds the top portion of the non-bonding oxygen band (magenta) is emptied during anionic redox. Bearing in mind that we are dealing with disordered structure the oxygen non-bonding states are not equal with respect to their cationic environment, therefore the first oxidized oxygen atoms are those having the lowest cationic charge in their first coordination shells, as shown Figure S27. Their oxidation leads to the formation of O – O dimers having σ, π, π* and σ* discrete bands,24 with the π* and σ*
states being as high in energy as the O-O bond is short. When these antibonding states cross the first empty metallic band, electron transfer from the O to the metal is expected, leading to O2 release together with the reduction of the transition metal (Figure 10 c). This situation
is exemplified by the Ni-based material showing a small charge transfer band gap, significant O2 release together with Ni reduction. In contrast, the ∆CT in the Mn-based compound is
larger enough to stabilize the oxidized oxygen species preventing O2 release. Turning to the
discharge, as long as the σ* of the oxygen level remains lower than the first empty M band, no hysteresis is expected, and we will have the following sequence cation anion (charge) and anion cation (discharge) redox processes. In contrast, for in the LNTO case, the sequence is inversed: cation anion and cation anion for charge and discharge, respectively. Lastly, if the σ* and transition metal states are roughly at the same energy, cationic and anionic redox could proceed simultaneously in reduction, as found for LMTO. At this stage a remaining question regards the large difference in the anionic redox potential between LMTO (3 V) and LNTO (1.5V). A likely explanation is rooted in our previous described inversion redox process for LNTO with the metallic reduction affecting the nature of the anionic species and hence their reduction potential.
DISCUSSION :
We have provided a detailed description of the evolution of two new disordered rocksalt compounds during Li insertion/removal, namely Li1.3Ni0.27Ta0.43O2 and Li1.3Mn0.4Ta0.3O2.
First, we found these materials to have similar characteristics than the Nb-based or Ti-based ones previously reported, suggesting that their redox mechanism is nearly transparent to the nature of d0 transition metals provided they have similar ionic radii [ceder diffusion update
when published]. Second, we demonstrate that both compounds show anionic redox reactivity with a few differences, namely a higher hysteresis and instability against O2 release
in the Ni-based compound. We introduce the notion of charge transfer band gap to account for such a difference.
Turning to the origin of the voltage drop in the discharge curve, already observed in other disorder rocksalt phases (Li1.2Ni0.33Ti0.33Mo0.16O2) showing anionic redox activity, it was
proposed to be nested in kinetic limitations associated with diffusion/migration.5 However,
the constancy of the voltage hysteresis whatever the current rate applied, as experimentally determined suggests that thermodynamics plays a key role as well. Besides, cationic migration in Li-rich layered oxides has also been proposed as source of the voltage hysteresis.24 This claim is not inconsistent with our model, since cationic migration triggers
new oxygen environment, depleted in charge, hence affecting the relative position of the oxygens states with respect to the band gap so that hysteresis can occur.
These findings open new perspectives to design Li-based disordered rocksalt compounds showing anionic redox with limited voltage hysteresis provide that we can tune the band gap. Several clues can be formulated. First, transition metals suffering electronic instabilities such Fe4+ (d4) and Ni3+ (d7) should be banned, unless we could stabilize Fe5+ (d3)
which is quite unlikely without high chemical/physical pressure. Concerning the Ni, destabilizing the Ni3+ to the expense of the Ni4+ by decreasing the framework covalency could
be attractive. Along that line, Ceder et al. proposed the partial substitution of O by F to successfully increase Ni oxidation in Li1.2Ni0.33Ti0.33Mo0.16O2, but with a limited effect on the
hysteresis due the narrow substitution range. 27 An alternative strategy has been the use of
other closed shells metals like d10 in Li
1.15Ni0.52Sb0.38O2 or Li4NiTeO6 favoring the Ni2+/Ni4+ redox
couple but with the drawback of suppressing the anionic redox activity.28,29 An attractive
midway scenario could consist in mixing d0 and d10 cations to have Ni4+ coexisting with
anionic redox. At last, using the charge transfer band gap as an indicator, it appears that Mn is the best element for disordered rocksalt phases showing both anionic redox and low hysteresis. Whether purely coincidentally or not the recently reported disordered rocksalt phases Li1.2Mn0.4Ti0.4O2 and Li4Mn2O5 (RT) show hysteresis of 0.6 V (50°C) and 1.3V (RT),
Conclusions :
Ni-based disordered rocksalt, having anionic redox activity, suffer low energy efficiency due to the presence of a voltage drop during discharge, in contrast to the Mn-based ones. To elucidate the origin of this behavior, we reported the comparison between two new disordered rocksalt compounds, Li1.3Ni0.27Ta0.43O2 and Li1.3Mn0.4Ta0.3O2, which show anionic
redox activity. We found that the voltage drop is nested in the anionic redox mechanism, which is dependent on the nature of the transition metal through the charge transfer gap but not on the type of d0 substituted element. Indeed, in the Ni-based compound, the
presence of a Jahn-Teller Ni3+ during charge leads to the formation of a narrow charge
transfer band gap triggering O2 release and Ni reduction upon anionic oxidation, and
hysteresis and voltage drop in the subsequent discharge. In contrast, in the Mn-based compounds, due the presence of Mn4+ which shows half-filled t
2g3, a large charge transfer
band gap is found stabilizing oxidized oxygen species and therefore leading to weak O2
release and moderate hysteresis. In the light of these findings, we give guidelines to design the electronic structure of Li-ion battery cathode material enhancing anionic redox performances.
Author Information:
Corresponding Author: Jean-marie.tarascon@college-de-france.fr Author contributions:
Q.J. carried out the synthesis, Q.J conducted the electrochemical measurements, Q.J. and G.R. did the diffraction experiments and analysis, Q.J. and A.I. conducted the hard XAS measurements and analysis, Q.J, H.L, J.C. conducted for soft XAS experiments and analysis, E.J.B conducted the OEMS experiments, Q.J., M.S. and M.-L.D. performed the DFT study, Q.J., G.R., M.-L.D. and J.M.T. wrote the manuscript, and all authors discussed the experiments and edited the manuscript.
The authors thank Vivian Nassif for her help in neutron diffraction experiment at the D1B diffractometer at ILL. The authors thank J. Vergent for his help in programing. The authors also thank V. Briois and S. Belin for helpful discussions on XAS analysis and synchrotron SOLEIL (France) for providing beamtime at the ROCK beamline (This work was supported by a public grant overseen by the French National Research Agency (ANR) as part of the “Investissements d’Avenir” program (reference : ANR10-EQPX45), proposal #20160095). Q. J. thanks the ANR “Deli-Redox” for PhD funding. J.-M.T. acknowledges funding from the European Research Council (ERC) (FP/2014)/ERC Grant-Project 670116-ARPEMA.
References
(1) Tarascon, J.-M.; Armand, M. Issues and Challenges Facing Rechargeable Lithium Batteries. Nature 2001, 414 (6861), 359–367.
(2) Lee, J.; Urban, A.; Li, X.; Su, D.; Hautier, G.; Ceder, G. Unlocking the Potential of Cation-Disordered Oxides for Rechargeable Lithium Batteries. Science 2014, 343 (6170), 519– 522.
(3) Yabuuchi, N.; Takeuchi, M.; Nakayama, M.; Shiiba, H.; Ogawa, M.; Nakayama, K.; Ohta, T.; Endo, D.; Ozaki, T.; Inamasu, T.; et al. High-Capacity Electrode Materials for
Rechargeable Lithium Batteries: Li 3 NbO 4 -Based System with Cation-Disordered
Rocksalt Structure. Proc. Natl. Acad. Sci. 2015, 112 (25), 7650–7655.
(4) Yabuuchi, N.; Nakayama, M.; Takeuchi, M.; Komaba, S.; Hashimoto, Y.; Mukai, T.; Shiiba, H.; Sato, K.; Kobayashi, Y.; Nakao, A.; et al. Origin of Stabilization and
Destabilization in Solid-State Redox Reaction of Oxide Ions for Lithium-Ion Batteries.
Nat. Commun. 2016, 7, 13814.
(5) Lee, J.; Seo, D.-H.; Balasubramanian, M.; Twu, N.; Li, X.; Ceder, G. A New Class of High Capacity Cation-Disordered Oxides for Rechargeable Lithium Batteries: Li–Ni–Ti–Mo Oxides. Energy Env. Sci 2015, 8 (11), 3255–3265.
(6) Yabuuchi, N.; Ohzuku, T. Novel Lithium Insertion Material of LiCo1/3Ni1/3Mn1/3O2 for Advanced Lithium-Ion Batteries. J. Power Sources 2003, 119–121, 171–174.
(7) Kumakura, S.; Komaba, S.; Kubota, K. Li4MeWO6 (Me=Ni, Mn, Co) As Positive Electrode Materials for Li-Ion Batteries. Meet. Abstr. 2015, MA2015-02 (6), 481–481.
(8) Yabuuchi, N.; Tahara, Y.; Komaba, S.; Kitada, S.; Kajiya, Y. Synthesis and Electrochemical Properties of Li4MoO5-NiO Binary System as Positive Electrode Materials for
Rechargeable Lithium Batteries. Chem. Mater. 2015.
(9) COLIN, J.-F.; Bourbon, C.; JACQUET, Q. Cathode Material for Li-Ion Batteries. WO2017098113A1, June 15, 2017.
(10) Zhao, W.; Yamaguchi, K.; Sato, T.; Yabuuchi, N. Li 4/3 Ni 1/3 Mo 1/3 O 2 – LiNi 1/2 Mn 1/2 O 2
Binary System as High Capacity Positive Electrode Materials for Rechargeable Lithium Batteries. J. Electrochem. Soc. 2018, 165 (7), A1357–A1362.
(11) Urban, A.; Abdellahi, A.; Dacek, S.; Artrith, N.; Ceder, G. Electronic-Structure Origin of Cation Disorder in Transition-Metal Oxides. Phys. Rev. Lett. 2017, 119 (17), 176402.
(12) Morcrette, M.; Chabre, Y.; Vaughan, G.; Amatucci, G.; Leriche, J.-B.; Patoux, S.;
Masquelier, C.; Tarascon, J.-M. In Situ X-Ray Diffraction Techniques as a Powerful Tool to Study Battery Electrode Materials. Electrochimica Acta 2002, 47 (19), 3137–3149. (13) Rodríguez-Carvajal, J. Recent Advances in Magnetic Structure Determination by
Neutron Powder Diffraction. Phys. B Condens. Matter 1993, 192 (1–2), 55–69.
(14) Briois, V.; La Fontaine, C.; Belin, S.; Barthe, L.; Moreno, T.; Pinty, V.; Carcy, A.; Girardot, R.; Fonda, E. ROCK: The New Quick-EXAFS Beamline at SOLEIL. J. Phys. Conf. Ser. 2016,
712, 012149.
(15) Ravel, B.; Newville, M. ATHENA, ARTEMIS, HEPHAESTUS: Data Analysis for X-Ray Absorption Spectroscopy Using IFEFFIT. J. Synchrotron Radiat. 2005, 12 (4), 537–541. (16) Massart, D. L. (Desiré L.; 1941-. Handbook of Chemometrics and Qualimetrics; Elsevier,
1997.
(17) Juan, A. de; Jaumot, J.; Tauler, R. Multivariate Curve Resolution (MCR). Solving the Mixture Analysis Problem. Anal. Methods 2014, 6 (14), 4964–4976.
(18) He, M. Elucidating Interface Reactions in Li-Ion Batteries and Supercapacitors by in Situ Gas Analysis. Doctoral Thesis, ETH Zurich, 2016.
(19) Kresse, G.; Furthmüller, J. Efficiency of Ab-Initio Total Energy Calculations for Metals and Semiconductors Using a Plane-Wave Basis Set - ScienceDirect. Computational
Materials Science. 6th ed. 1996, pp 15–50.
(20) Kresse, G.; Hafner, J. Ab Initio Molecular Dynamics for Liquid Metals. Physical Review B. 1993, p 558.
(21) Perdew, J. P.; Burke, K.; Ernzerhof, M. Generalized Gradient Approximation Made Simple. Phys. Rev. Lett. 1996, 77 (18), 3865–3868.
(22) Dudarev, S. L.; Botton, G. A.; Savrasov, S. Y.; Humphreys, C. J.; Sutton, A. P. Electron-Energy-Loss Spectra and the Structural Stability of Nickel Oxide: An LSDA+ U Study.
Phys. Rev. B 1998, 57 (3), 1505.
(23) Assat, G.; Foix, D.; Delacourt, C.; Iadecola, A.; Dedryvère, R.; Tarascon, J.-M.
Fundamental Interplay between Anionic/Cationic Redox Governing the Kinetics and Thermodynamics of Lithium-Rich Cathodes. Nat. Commun. 2017, 8 (1).
(24) Gent, W. E.; Lim, K.; Liang, Y.; Li, Q.; Barnes, T.; Ahn, S.-J.; Stone, K. H.; McIntire, M.; Hong, J.; Song, J. H.; et al. Coupling between Oxygen Redox and Cation Migration Explains Unusual Electrochemistry in Lithium-Rich Layered Oxides. Nat. Commun. 2017,
8 (1), 2091.
(25) Luo, K.; Roberts, M. R.; Hao, R.; Guerrini, N.; Pickup, D. M.; Liu, Y.-S.; Edström, K.; Guo, J.; Chadwick, A. V.; Duda, L. C.; et al. Charge-Compensation in 3d-Transition-Metal-Oxide Intercalation Cathodes through the Generation of Localized Electron Holes on Oxygen. Nat. Chem. 2016, 8 (7), 684–691.
(26) de’ Medici, L. Hund’s Coupling and Its Key Role in Tuning Multiorbital Correlations.
Phys. Rev. B 2011, 83 (20).
(27) Lee, J.; Papp, J. K.; Clément, R. J.; Sallis, S.; Kwon, D.-H.; Shi, T.; Yang, W.; McCloskey, B. D.; Ceder, G. Mitigating Oxygen Loss to Improve the Cycling Performance of High Capacity Cation-Disordered Cathode Materials. Nat. Commun. 2017, 8 (1), 981.
(28) Sathiya, M.; Ramesha, K.; Rousse, G.; Foix, D.; Gonbeau, D.; Guruprakash, K.; Prakash, A. S.; Doublet, M. L.; Tarascon, J.-M. Li4NiTeO6 as a Positive Electrode for Li-Ion Batteries. Chem. Commun. 2013, 49 (97), 11376.
(29) Ma, X.; Kang, K.; Ceder, G.; Meng, Y. S. Synthesis and Electrochemical Properties of Layered LiNi2/3Sb1/3O2. J. Power Sources 2007, 173 (1), 550–555.
(30) Freire, M.; Kosova, N. V.; Jordy, C.; Chateigner, D.; Lebedev, O. I.; Maignan, A.; Pralong, V. A New Active Li–Mn–O Compound for High Energy Density Li-Ion Batteries. Nat.