HAL Id: hal-01619249
https://hal.archives-ouvertes.fr/hal-01619249
Submitted on 15 Mar 2019
HAL is a multi-disciplinary open access
archive for the deposit and dissemination of
sci-entific research documents, whether they are
pub-lished or not. The documents may come from
teaching and research institutions in France or
abroad, or from public or private research centers.
L’archive ouverte pluridisciplinaire HAL, est
destinée au dépôt et à la diffusion de documents
scientifiques de niveau recherche, publiés ou non,
émanant des établissements d’enseignement et de
recherche français ou étrangers, des laboratoires
publics ou privés.
Effect of the particle size and the liquid content on the
shear behaviour of wet granular material
Haithem Louati, Driss Oulahna, Alain de Ryck
To cite this version:
Haithem Louati, Driss Oulahna, Alain de Ryck. Effect of the particle size and the liquid content on
the shear behaviour of wet granular material. Powder Technology, Elsevier, 2017, 315, pp.398-409.
�10.1016/j.powtec.2017.04.030�. �hal-01619249�
Effect of the particle size and the liquid content on the shear behaviour of
wet granular material
H. Louati
⁎
, D .
a h n a , A . d e R y c k
Centre Rapsodee, Mines Albi, CNRS, Université de Toulouse, Campus Jarlard, F-81013 Albi Cedex 09, France
a b s t r a c t
The size of particle is a relevant parameter in the study of the granular material behaviour. For wet granular ma-terials, it affects the capillary force and the number of liquid bridges. We present quantitative and qualitative in-vestigations of the effect of the particle size on the steady-state shear behaviour of partially wet granular material. Two sizes of glass beads have been used: 12–40 μm and 70–110 μm in diameter and the shear behaviour was studied using an annular shear cell. The results show different regimes of the shear-normal stresses relationship depending on the particle size, with a general increase of the magnitude of the shear stress for a decrease in the particle size.
Most studies of wet granular material behaviour have focused on the pendular state of saturation with liquid bridge formed between particles. In this study, the states of saturation are explored going up to completely filling the space between beads of 70–110 μm. Different regimes are identified depending on the liquid fraction and the applied normal stress. A theoretical approach was used to estimate the tensile strength for the different states of saturation. An agreement between both experimental and theoretical data was observed and discussed.
Keywords: Particle size Liquid content Capillary force Tensile strength Shear stress Wet granular material
1. Introduction
The granular material is an assembly of discrete individual particles, with a collective behaviour due to the interactions between them. The particle size is one of the relevant properties, which affect significantly the behaviour of the granular material. For particle smaller than hun-dred of microns, the inter-particle forces such as the Van-der-Waals forces are generally greater than the gravitational forces[21]. This changes the behaviour of the granular material from a non-cohesive be-haviour to a cohesive one. With the addition of a wetting liquid, the cap-illary force dominates in magnitude the Van-der-Waals force.
At small or moderate volume of liquid content,[8,18]observed the yielding of the granular material at low stress conditions, by looking at the angle of repose or the tensile strength of a pile. The yield strength in-creases first, for liquid content of about 1% of the total volume, then sat-urates till a liquid content of 15%. This saturation is explained by the Laplace pressure in the liquid bridges, which saturates with the volume of liquid since the curvature of the liquid-air interface is bounded by the one imposed by the particle geometry.
Recently, we have investigated the increase of the shear resistance due to the presence of a wetting liquid in steady-state conditions, in shear mixers[14]. In order to better control the sheared plane and to quantitatively analyse the shear stress, an annular shear cell was later
used to carry out the experiments for a large range of applied normal stress from about 0.3 kPa to 12 kPa[10]. We have investigated the shear behaviour of 70–110 μm glass beads in the pendular regime. The results give the variation of the shear stress at steady-state as a function of the normal stress for a wide range of liquid fraction. A non-linear re-lationship of the shear stress–normal stress was observed, implying dif-ferent regimes. In particular, an apparent cohesion appeared at high normal stress and high liquid fraction, while it remains negligible at low normal stress. However, the shear stress is proportional to the nor-mal stress when the latter is snor-mall enough, with an apparent friction co-efficient increasing with the liquid fraction.
The increase of the shear resistance in steady-state conditions was explained by a model where the number of capillary bridges renewed during shearing are dependent on the rearrangements of the particle bed and hence on its density, which is affected by the normal stress ap-plied[10]. In this paper, we go further, and we investigate the effect of smaller particle size on the shear behaviour of partially wet granular material in steady-state for different normal stresses and liquid frac-tions up to completely filling the inter-particle spaces.
2. Materials and methods
The material used in this study consists of glass beads provided by Sovitec®. The glass beads are used in the experiments as supplied with-out any surface treatments, but sieved to obtain narrow size distribu-tions. Two different sizes of glass beads were used in this study:
⁎ Corresponding author.
70–110 μm and 12–40 μm in diameter. These sizes are chosen small to enhance the effect of the capillary forces vis-à-vis the gravitational forces. The spreads of both particle size distributions may be evaluated around 0.2 and 0.6 if supposed log-normal distributed, or the coefficient of uniformity is lower than 1.5 and 3.3 respectively[22]. Following this work and the one by Dexter & Tanner[4], we conclude that the packing density for non-cohesive granular materials may increase by 0.02 to 0.05 for the glass beads with a wider distribution (12–40 μm) compared to the 70–110 μm glass beads. The expected increase is weak and the ob-servations reported inSection 3.1.1indicate that the Van-der-Waals forces for the 12–40 μm make the smaller material to be in fact less packed.
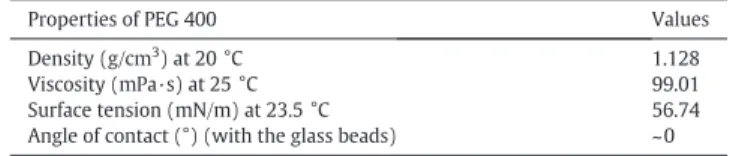
The glass beads were wetted using polyethylene glycol of 400 g molar weight (PEG 400) provided by Alfa Aesar. This liquid has been chosen since it wets well the glass beads and has also a low volatility compare to water, which helps to work with small liquid fractions with small evaporation rate. The characteristics of the PEG 400 are given inTable 1. The viscous forces may play an important role on the dynamic of the glass beads. We compute a capillary number, Ca, in order to quantify the viscous effect compared to the capillary effect. The viscous effect is considered as relevant if Ca N 1. This number is given as Ca=μlvp,p/γ, where μlis the dynamic viscosity of liquid, γ is
the surface tension and vp, pis the relative particle-particle velocity.
The latter is calculated based on the Stokes velocity as vp,p=(2R2(ρp−
ρg)g)/(9μg), where μgis the dynamic viscosity of ambient gas, ρpand ρg
are the density of particles and the density of ambient gas respectively
[23]. For our experiments, we have Ca = 0.04 for 12–40 μm glass beads and Ca=0.9 for 70–110 μm glass beads. Furthermore, the viscous effect not only depends on the liquid properties but also on the wet powder processing parameters. The behaviour of the wet glass beads is studied here using an annular shear test (see more details about the device inSection 2.2.2). Thus, we compute another dimensionless num-ber, which is the time scale for bridge filling relative to the shear time. The viscous effect should be considered if the time scale is in the order of a shear time[23]. The obtained values for the dimensionless number do not exceed 0.001 for both particle sizes. Thus, the viscous effect is considered less relevant in this work and we will focus only on the cap-illary effect.
The glass beads were mixed with various quantities of PEG 400 using a Kenwood planetary mixer (1200 g of glass beads during 20 min). The procedure of mixing is important to ensure a homogeneous distribution of liquid in the granular material, especially at low liquid fractions. The fraction of liquid is expressed as a volume ratio (VR% = volume of
liquid ∕ total volume of particles). The fractions of liquid investigated in this study vary from 0.01% to 20% for the partially state of saturation, so-called pendular state. It is increased then from 20% to 60% in order to investigate more saturation states (funicular and potentially capillary states).
2.1. Characterisation of the glass beads properties 2.1.1. The particle surface analysis
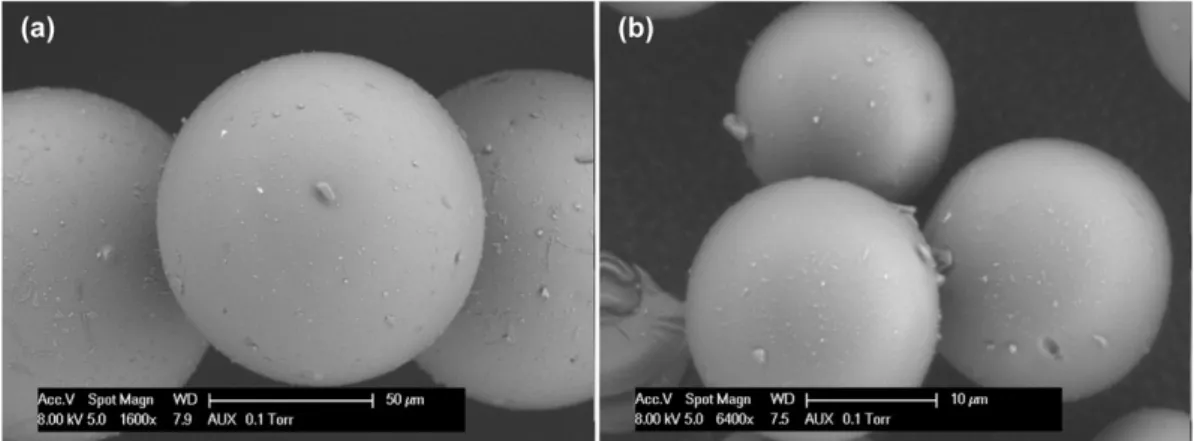
The surface of the glass beads, as supplied, was observed using two techniques: the Scanning Electron Microscope (SEM) and the Atomic-Force Microscopy (AFM). The SEM images of the glass beads 12–40 μm and 70–110 μm show a rough surface. The observed
roughness is caused by the impurities adhered to the surface and also due to manufacturing defects in the form of microscopic cavities or bumps. Several SEM observations were performed in order to evaluate the size of the asperities. From the obtained images (seeFig. 1), an aver-age height of the asperities is observed to be in the range of 1 to 2 μm. The AFM allows analysing the surface roughness by measuring the in-teractive forces between the AFM cantilever (a force tensor) and the surface of the sample. The measurements were performed with a Raman-AFM microscope, alpha300 RA, WITec GmbH. A number of glass beads were glued to a glass microscope slide and the roughness of the free surface of beads was measured using contact mode. Similar values to the one estimated by SEM were also obtained from AFM. We consider an average value of 1.5 ± 0.5 μm. The formation of liquid brid-ges is also affected by the surface roughness and some models to esti-mate the capillary forces require the estimation of the size of asperities. 2.1.2. The voidage fraction
The voidage fraction is calculated as the volume of the void divided by the total volume of the wet granular material, which includes the vol-ume of the glass beads, the voids and the liquid. It is expressed as a func-tion of the densities as:
εwet¼ 1−ρρ s 1 þ VR 1 þ VR ρρL s ! " ; ð1Þ
where ρsis the true density, measured using a helium pycnometer
AccuPyc II 1330 Micromeritics®. ρ is the apparent density, calculated by measuring the volume occupied by a given mass of glass beads in the measurement shear cell. ρLis the density of the liquid, simply
mea-sured using a measuring tube (seeTable 1).
The X-ray tomography is a potential technique for the analysis of the bulk properties of a granular material, in particular the voidage fraction. This technique allows by image analysis not only to estimate the voidage fraction but also to get information about the distribution of the voids in the granular bed, in particular for cohesive powder. The analysis of the glass beads of 70–110 μm was performed using Phoenix Nanotom® X-ray tomography. A sample of glass beads was putted in a small transparent gelatine capsule of 6 mm in diameter and manually slightly packed to avoid large gaps due to the filling process. We per-formed analysis of the glass beads 70–110 μm, dry and wet with differ-ent liquid fractions. The use of the PEG 400 as a liquid to wet the glass beads has been an advantage since it is detected in this analysis. The technique allows to achieve a large number of radiography in different angle of the sample and to combine them in order to obtain a 3D con-struction of the sample. This requires the use of software capable of pro-cessing such a large number of images in a reasonable time. In this study, the voidage fraction was analysed from the 2D radiography and the images were treated using Matlab®. Different images, representing different sections of the sample, were treated to estimate an average value of the voidage fraction. Further information about the image anal-ysis will be given next.
2.2. Characterisation of the flow behaviour of the granular material 2.2.1. The angle of repose
The reduction of the particle size can increase the cohesion due to the Van-der-Waals forces in play. The increase of the cohesion of the granular material can be observed by looking at the angle of repose. We performed measurements of the angle of repose for the glass beads 70–110 μm and 12–40 μm in the dry case using the Hosokawa Powder Tester PT-N. The test consists in pouring the powder through a funnel with an outlet of 5 mm over a support of 12 cm diameter. After avalanches, the angle of repose of the heap can be measured.
Fig. 2shows a relatively small angle of repose for the glass beads 70–110 μm with well-shaped surface of the heap. However, an irregular
Table 1
Properties of the polyethylene glycol 400: density, viscosity, surface tension and angle of contact with the glass beads.
Properties of PEG 400 Values
Density (g/cm3) at 20 °C 1.128
Viscosity (mPa·s) at 25 °C 99.01
Surface tension (mN/m) at 23.5 °C 56.74
shape of the glass beads heap of 12–40 μm is observed. The measured values of the angle of repose are about 24.5° for the 70–110 μm glass beads and around 30° for the 12–40 μm glass beads. We observe an in-crease of the angle of repose by decreasing the particle size in the dry situation and hence the estimated static friction is higher. In the next we will be investigating the effect of liquid on the apparent friction ob-tained from the shear test data.
2.2.2. The shear test in steady-state conditions
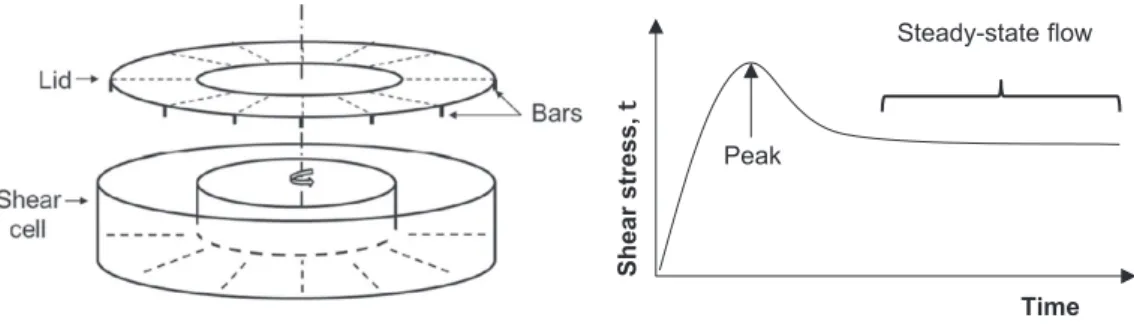
Schulze shear cell was used to study the flow properties of dry and wet glass beads (seeFig. 3). This equipment consists of an annular chamber with an inner diameter of 10 cm and an outer diameter of 20 cm. More details about the geometry parameters of this device were given in[10]. To run a shear test, the chamber is filled with the sample and rotates at a constant rotational velocity, ω, of 2.3 mrad/s. The bottom of the chamber and the lower side of the lid are rough due to the presence of small bars, which prevent wall slippage. The shear plane occurs below the bars of the lid, therefore the weight of the particles between the bars is taken into consideration when calculating the normal stress σ acting on the sheared surface. We used:
σ ¼MgA þρgh; ð2Þ
where M is the normal loading weight, g is the gravitational constant, A is the area of the lid and h=4 mm is the height of the bars.
The shearing process consists of measuring the mean tangential stress τ from the torque applied by the rotating powder on the powder kept fixed together with the lid; and obtained by the two force sensors F1and F2, which hold it (seeFig. 3). This measurement is repeated for
various normal stresses. The relationship used to calculate the shear stress, τ, as a function of F1and F2is given as:
τ ¼ 3 Fð 1þ F2Þl 2π R3
e−R3i
# $ ; ð3Þ
where l is the distance from the axis of rotation of the shear cell and the end of a rod connected to a force sensor, Reand Riare the external and
the internal radii of the shear cell respectively. The experiments were performed for the dry and wet glass beads with various liquid fractions of PEG 400. For each sample, a range of normal loads was used from 24 kg to 1 kg by removing 1 kg each step after tangential discharge. For a given normal load, the sample was sheared for about 1 min. After a peak, a plateau value or an oscillatory steady-state regime is ob-tained. In the following, a mean value of the shear stress at steady-state is calculated from the diagram (shear stress–time) and then used to study the flow properties of dry and wet glass beads (seeFig. 3). 3. Results and discussions
3.1. Effect of the particle size
3.1.1. Observations of the wet granular bed
It is known from the literature that the voidage fraction of mono-size spheres decreases for an increase in the particle size. This is true for a particle smaller than a critical size value beyond which the voidage frac-tion becomes independent on the particle size[24]. In this study, we compare the voidage fraction of two different sizes of glass beads. In the dry case, the voidage fraction of a loose packing of glass beads in the range of 12–40 μm of diameter is about 0.45 and it is bigger than
Fig. 1. Electron microscope scan images of the glass beads showing the asperities on the particle surface. (a) 70–110 μm glass beads and (b) 12–40 μm glass beads.
the one measured for 70–110 μm, about 0.42.Fig. 4shows the variation of the voidage fraction with the liquid fraction increasing up to 20%. The same variation is observed for the two different sizes of glass beads; at first, a small decrease of the voidage fraction is occurred due to the lubri-cation in the presence of tiny amounts of liquid. Chou and Hsiau[3] re-ported that no liquid bridges are formed at very small amount of liquid because the latter is trapped on the surface of particles between asper-ities. Then, the voidage fraction starts to increase with the liquid content due to the formation of liquid bridges, which are responsible for the co-hesive force allowing the granular system to sustain a loose assembly with some gaps in between. Indeed, for small amount of liquid (VRb1%), the liquid bridges are formed at some of the contact areas
be-tween particles. Thus, the liquid bridges will bring into contact some of the particles and lead to the formation of gaps in other areas. Further-more, the surface roughness plays a role in the formation of liquid bridges. For small values of VR, the liquid is accumulated around the asperities at
the contact area between particles. In this case, the capillary force induced from the liquid bridges depends on the volume of the added liquid (FC~γV/a2), where a is the local surface roughness height[6,8]. When
the amount of liquid increases further (1% b VR) the effect of the surface
roughness becomes negligible and the capillary force is determined by the radius of the particles (FC=2πγR). Thus, the capillary force is
inde-pendent on the volume of the liquid bridge. The saturation of the capillary force for (1% b VRb14%) leads to a saturation of the voidage fraction
var-iation observed inFig. 4. After the liquid bridges are formed in most of the contact points, the increase of the amount of liquid contributes to enlarge the volume of liquid bridge. The voidage fraction starts to decrease since the liquid progressively occupies the space of the air.
The effect of liquid on the voidage fraction is also more pronounced for small particle size. This was observed for other size of glass beads (250 μm, 1000 μm, 2000 μm and 4000 μm) in the work of Feng & Yu[5]
and Yu et al.[25]. In fact, by decreasing the size of particles, the capillary
forces become more relevant compared to the gravitational forces and hence the effect on the voidage fraction is more pronounced. A granular bond number Bo is calculated in order to compare the capillary and the gravitational effects for the glass beads of 12–40 μm and 70–110 μm. This number is the maximum capillary force relative to the weight of the particle: Bo=3γ/2Reff2ρg[13]. Bo is 22 times larger for 12–40 μm
glass beads than for 70–110 μm glass beads. This can be explained by the fact that the number of liquid bridges per unit volume is much larger for the small particle size compare to the big size. Consequently, the effect of the capillary force is more pronounced for the small particle size. The effect of adding more liquid amount to the granular media on the voidage fraction will be investigated in the next sections.
3.1.2. Shear stress of partially wet granular material
The flow behaviour of the dry glass beads 12–40 μm is more cohesive compared to the 70–110 μm. This can be noticed by looking at the flow behaviour of the two samples of glass beads in a small container of 1000 cm3; a free flowing is observed for the large size versus an
avalanch-ing flow for the smaller one. The measurement of the apparent friction coefficient from the shear – normal stresses curves gives 0.44 and 0.4 for small and large sizes respectively. Indeed, the Van-der-Waals forces increase the apparent friction in the dry case for small particles.
Fig. 5-a shows the shear–normal stresses variation with the liquid fraction for 70–110 μm glass beads. Generally, we observe an increase of the shear stress by increasing the liquid content up to 20%. At low liq-uid fraction (VR≤ 0.1%), the shear stress increases linearly with the
nor-mal stress. However, by increasing further the quantity of liquid a slope change is observed around 4 kPa of normal stress; at low normal stress (σ ≤ 4 kPa), the granular behaviour under shearing is frictional where the apparent friction (obtained from the slope of curve) increases with the liquid fraction. However, at high normal stress (σ ≥ 4 kPa), the granular behaviour is cohesive where the apparent cohesion (ob-tained by extrapolation of curves at zero normal stress) increases with the liquid fraction and the apparent friction remains constant. These two different regimes are explained by the effect of the normal stress on the configuration of the wet granular material. The granular struc-ture passes from loose to dense by increasing the normal stress and the shear stress response is affected consequently[10].
Fig. 5-b shows the shear–normal stresses variation with the liquid fraction for 12–40 μm glass beads. Generally, we observe a linear varia-tion of the shear–normal stresses for the different liquid fracvaria-tions. We point out a change of behaviour for high normal stress (σ ≥ 8 kPa), i.e. data are slightly drifted from linearity toward higher normal stress. This regime cannot be described with an apparent cohesion (τ = μσ + c) on the contrary to the case of 70–110 μm glass beads. The appar-ent friction coefficiappar-ent is calculated from the slope of curves, for normal stress up to 8 kPa. Data are well fitted by linear regression with a coef-ficient of determination (R2N0.998) for all cases. The variation of the
apparent friction coefficient with the liquid fraction is given inFig. 6. This apparent friction coefficient increases for an increase in the liquid fraction. However, we can distinguish two regimes: for small liquid con-tent (VR≤ 1%), the apparent friction is slightly increased with the liquid
Peak Steady-state flow Time Sh ear stress, t
Fig. 3. (Left) Schematic representation of the annular shear cell. (Right) Schematic representation of shear stress-time diagram from the shear test.
0.3 0.4 0.5 0.6 0.7 0.001 0.01 0.1 1 10 100 we t VR% 12 - 40 •m 70 - 110 •m VR= 0
Fig. 4. Variation of the voidage fraction with the liquid fraction for two different sizes of glass beads: diamond for 12–40 μm, plus for 70–110 μm.
from 0.44 in the dry case to 0.5 at 1%. The apparent cohesion, which can be obtained by extrapolation of curves at zero normal stress, remains low and close to the dry data as it can be observed fromFig. 5-b. For higher liquid content (VRN1%), the increase of the apparent friction
co-efficient is more significant, e.g. it rises from about 0.5 at 1% to 0.65 at
20%. This regime resembles to the regime observed at low normal stress for 70–110 μm: the apparent friction increases with the liquid fraction up to 20%. Moreover, no saturation of the shear stress is yet observed for the small glass beads with the liquid fraction increasing; for liquid fraction up to 20%, the shear stress is still increasing with the liquid frac-tion unlike the case for 70–110 μm glass beads (curves are superimposed in the range of 3.5–20% of liquid fraction). This may be explained by the fact that for the small beads the number of particles in the shear cell is much larger. An estimation of the number of glass beads in the shear cell shows that the small glass beads are 70 times the number of the big ones. Thus, the number of the coordination num-ber by unit of volume is much larger and hence the numnum-ber of liquid bridges formed at the contact points increases as well. We assume that the saturation of the shear stress is reached when the number of liquid bridges is completed. Indeed, the shear resistance get rise from the number of liquid bridges broken under shearing. The saturation of the shear stress can not be reached while the number of liquid bridges is increasing with the liquid addition.
3.1.3. Estimation of the tensile strength
In the pendular regime, Rumpf[17]proposed a theoretical model to estimate the tensile strength TSfrom the liquid bridge forces, for
mono-sized spheres: TS;pendular¼ 1−εð ÞkπFC
d2; ð4Þ
where FCis the capillary force, k is the coordination number and ε is the
voidage fraction of the wet granular material. To calculate the capillary force, the approach given by Adams & Perchard[1]is used
FC¼ 2πRγsin2α þ πR2sin2αΔP; ð5Þ
where R is the particle radius, α is the half filling angle and ΔP is the cap-illary depression as given by Young Laplace expression. More details about this approach can be found in these references (Adams & Perchard[1];[10]).
It was shown in our previous study[10]how the liquid fraction and the packing density affect largely the tensile strength. However, there is another parameter, which is as important in the estimation of the ten-sile strength: the particle size. It is reported in the literature that fine particles have higher strength than large particles[11]. However, we have seen that both the liquid saturation and the packing density are also affected by the particle size decrease. In this section, the tensile strength of 12–40 μm glass beads is estimated from the model of Rumpf and compared to the results of 70–110 μm glass beads. Although the size of particles is smaller, the size of the asperities observed by AFM is very close to the one observed for 70–110 μm. An approximate value of the dimensionless half-separation distance of about 0.06 is consid-ered for the small size glass beads and about 0.025 for the large size glass beads. We recall that this value step in the calculation of the main radii of the liquid bridge curvature necessary to compute the cap-illary force and then the tensile strength[10]. The capillary force in-creases with the particle size increasing, however the tensile strength is inversely proportional to the particle size.
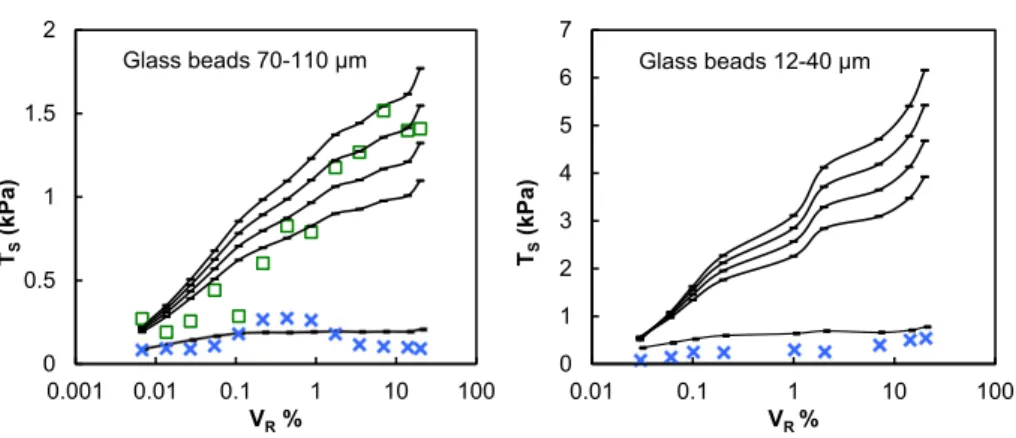
Fig. 7shows the calculated tensile strength TSas a function of the
volume ratio VR(%) for various potential coordination numbers k
(con-tinuous lines). We clarify that the irregularities of the theoretical curves (continuous lines) are caused by the values of the voidage fraction used in Eq.(1), which correspond to the experimental values measured for different liquid fractions. On one hand, as expected, the observed values of TSare higher than the one observed for 70–110 μm glass beads. This
can be explained by the fact that the number of contact per unit of sur-face increases for a decrease in the particle size[2]and consequently the number of liquid bridges increases too. Therefore, higher tensile forces are required to produce rupture of the liquid bridges in the shearing
0 1 2 3 4 5 6 7 8 9 0 2 4 6 8 10 (kPa) (kPa) 20% 14% 7% 1% 0.2% 0.1% 0.06% 0.03% 0
(b)
0 1 2 3 4 5 6 0 2 4 6 8 10 (kPa) (kPa) 20% 14% 3.5% 1% 0.5% 0.1% 0.01% 0(a)
Fig. 5. Shear stress variation with the normal stress wet glass beads with a volume fraction ranging from 0 to 20%. (a) glass beads of 70–110 μm[10]and (b) glass beads of 12–40 μm.
0.4 0.5 0.6 0.7 0.01 0.1 1 10 100 Ap p aren t fri cti o n ( ) VR% Glass beads of 12-40 µm
Fig. 6. Variation of the apparent friction coefficient with the liquid fraction of 12–40 μm glass beads applied to normal stresses up to 8 kPa.
plane. On the other hand, the experimental data (crosses) has value whose magnitude corresponds to a low number of capillary bridges bro-ken. In fact, it was observed that the small glass beads have looser pack-ing density compared to the bigger glass beads (seeFig. 4). Therefore, higher normal stresses (beyond 11 kPa) are needed to reach denser packing density and hence higher tensile strength, which should corre-spond to the upper continuous lines in (Fig. 7). This may also explain the profile of shear stress–normal stress curves of small glass beads (Fig. 5 -b), which resembles to the profile of curves at low normal stress (σ b 4 kPa) of big glass beads (Fig. 5-a); we assume that a slope variation can be obtained at higher normal stress (beyond 11 kPa).
3.2. Effect of the liquid content
In the pendular state, where the liquid bridges are mainly formed at the contact point between particles, it was shown that the cohesive force acts through the liquid bridges (seeFig. 8). The shear resistance in-crease due to the rupture of liquid bridges under shearing. The redistri-bution of liquid in the granular material, after the contact has been established between particles, affects the bridge volume and hence the critical distance at which the liquid bridges breakdown[7,9]. Herminghaus investigates the effect of the separation distance on the required energy to break the liquid bridge. He reported that the energy change (ΔEC) is approximately equivalent to (ΔEC~Sd3/2), where Sdis the
separation distance[7]. Therefore, the increase of the liquid fraction contributes to enhance the shear resistance of the granular material through the distribution of liquid between contact points.
In the funicular state, some of the gaps are filled with liquid; the co-hesion acts through the suction at the liquid-air interface together with the remained liquid bridges. In the capillary state, almost all the gaps are filled with the liquid; the cohesion is only ensured by the suction at the liquid-air interface. Therefore, the texture of the granular material changes depending on the quantity of liquid. We expect also that the mechanical behaviour of the granular material for the different states
changes. In this section, the effect of liquid of different saturation states is investigated. The glass beads of 70–110 μm are considered here and the liquid fraction is extended to up to 60%. The variation of the voidage fraction, as shown inFig. 4, will be discussed for more liquid fractions. Moreover, the voidage fraction will also be analysed from X-ray tomog-raphy images. The mechanical properties of the different states of satu-ration will be analysed from the shear stress measurement.
3.2.1. Observations of the wet granular bed
The effect of liquid on the voidage fraction is now investigated for different saturation states of liquid, i.e. pendular, funicular and capillary states. Data inFig. 4are extended to more liquid fractions up to 60%. The latter is close to the maximum liquid fraction that can be held by the granular material before reaching the slurry state. It can be estimated from this relationship (VR≈ε/(1−ε)) that the slurry state is reached
at almost 70% of liquid fraction, for a voidage fraction of (ε=0.41). For large liquid fractions, beyond the pendular regime, the capillary force arises from the suction at the air-liquid interface. Yu et al.[25]reported that, after a critical value of the liquid fraction, the voidage fraction might decrease. It is assumed that the capillary forces vanish beyond that maximum value[19].Fig. 9shows that εwetis decreasing linearly
for an increase of the liquid fraction from 20% to 60%. The linearity of data is observed at low and high normal stresses applied upon the wet granular bed during measuring of the voidage fraction. This indicates that the granular material skeleton is invariable and the addition of liq-uid simply fills the space between beads without much affecting the structure of the granular bed. In order to gain a qualitative understand-ing of the voidage fraction variation at a mesoscopic scale in the pres-ence of a wetting liquid, an X-ray tomography was carried out and the analysis will be discussed in the following.
3.2.1.1. X-ray tomography.The X-ray tomography is a potential tech-nique to analyse the structure of the granular material and the liquid distribution[18]. In this work, this technique is used to qualitatively
0 1 2 3 4 5 6 7 0.01 0.1 1 10 100 T S (kPa) VR % 0 0.5 1 1.5 2 0.001 0.01 0.1 1 10 100 T S (kPa) VR%
Glass beads 70-110 µm Glass beads 12-40 µm
Fig. 7. Comparison between experimental (crosses and squares) and theoretical tensile strength (continuous lines) variation with the liquid fraction. The theoretical data are obtained from Eq.(4)for different values of the coordination numbers (1, 5, 6, 7 and 8, displayed from bottom to top). The experimental data are represented by crosses for low normal stress (σb4kPa) and squares for high normal stress (σN4kPa). Left, for glass beads 70–110 μm and right, for glass beads of 12–40 μm.
analyse the mean voidage fraction in the glass beads bed depending on the amount of liquid and to identify the existence of agglomerates at large amount of liquid.
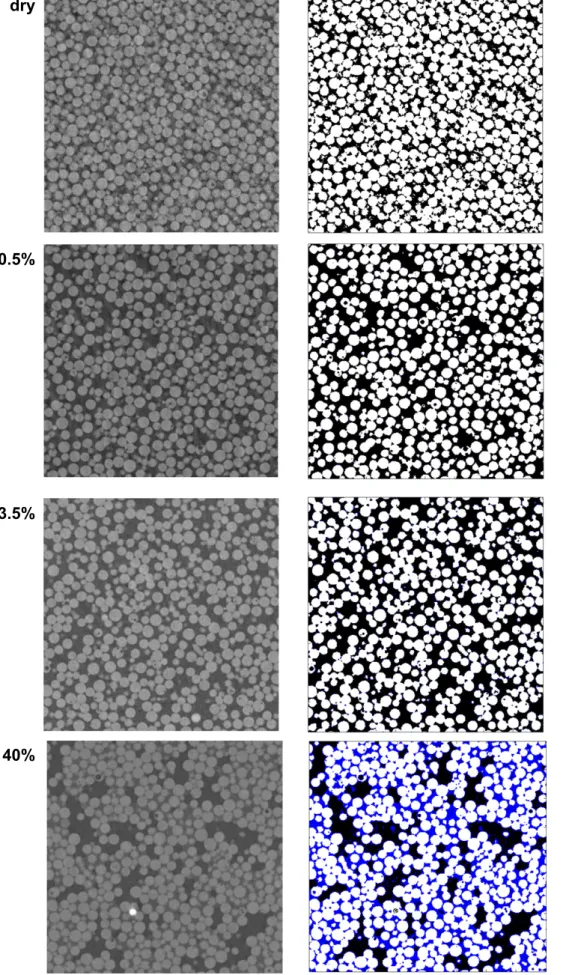
Fig. 11-left shows 2D cross-sectional images of four samples of wet glass beads with different liquid fractions (0, 0.5%, 3.5% and 40%). These samples have been chosen because they have shown different voidage fraction values (seeFig. 9). From these images we will try to an-alyse the distribution of the voids in the granular assembly and its de-pendency on the liquid fraction. The bright areas correspond to the glass beads, the dark areas to the voids and the areas with intermediate intensities of grey to the liquid. It is not obvious to distinguish the three phases in the raw images (on the left). In order to do so, the histograms of the frequency of grey intensities are determined for each sample (see
Fig. 10). The three phases are clearly distinguished in the histogram of 40% of liquid fraction, i.e. three separated peaks are observed, and this is because the amount of liquid is large enough to give a peak. However, for the sample of 0.5% and 3.5% no peak was detected for the liquid phase due to the small amount of liquid. Yet, if we zoom in the raw im-ages we can see other shades of grey around the bright areas (glass beads), which most likely correspond to the liquid phase. It can be ob-served in the histogram a large space between the two peaks, which most likely corresponds to the liquid phase. For the dry sample, one clear peak is observed for the glass beads and another small peak for the air phase.
In order to analyse these images, a unique colour is attributed to each phase, i.e. white for the glass beads, black for the air and blue for the liquid. The liquid fraction (volume of liquid ∕ volume of glass beads) was checked out for the image of 40% by counting the number of pixels (number of blue pixels ∕ number of white pixels). The liquid fraction calculated is well estimated from the image analysis, about 40 ± 2%. This means also that the liquid is evenly distributed in the granular material for high liquid content at least. For low liquid contents (0.5% and 3.5%), the peak of the liquid phase is not observed. Therefore the range of grey intensity values, which corresponds to the liquid, is de-fined such that the liquid fraction is conserved. The treated images are given inFig. 11, on the right hand side, next to the corresponding raw images.
The observation of the treated images shows that the voidage frac-tion (black pixels) increases with the liquid content. The dry case gives the densest configuration of the granular material since the parti-cles are not cohesive. The observed voids are also evenly distributed in the dry granular material. By adding small amount of liquid (VR=
0.5%), small gaps of two or three times the size of the beads are formed and uniformly distributed. Further increase of the amount of liquid to 3.5% leads to increase the size of the gaps. The blue areas are observed at some contact points for the image of 3.5% but not that clear since the amount of liquid is yet small. However, it is clearly observed for 40% that the liquid exists at the contact areas and also occupies the spaces in between some grains. Large agglomerates coexist with large gaps. The gaps and agglomerates have different sizes and seem to be not uniformly distributed in the granular assembly. Smaller agglomer-ates are formed at lower amount of liquid. As the liquid fraction in-creases, the small agglomerates merge into larger ones[18].
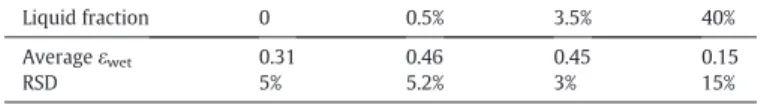
We also estimate the voidage fraction from the image analysis. Thus, different images for each sample have been used in order to calculate an average value of the voidage fraction. The images were chosen in a way that they represent different zones of the sample from the bottom to the top of the capsule (see about the preparation of sample inMaterials and methodssection). For each image, 16 zones have been selected to mea-sure the voidage fraction in order to analyse the distribution of the void depending on the liquid fraction. The selected zones are represented as squares of about 1 mm of side, which is equivalent to about 12 glass beads side by side. The voidage fraction in each zone is calculated by counting the number of pixels, the black pixels (volume of void) divided by the number of black, white and blue pixels (total volume) gives εwet
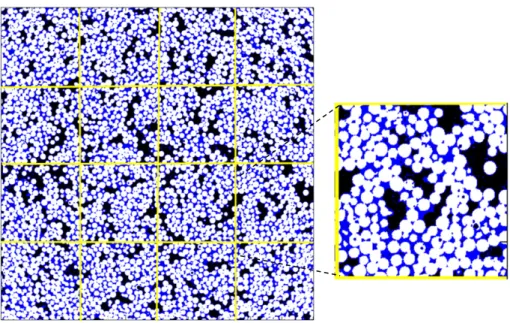
as expressed in Eq.(1). The variation of the calculated voidage fraction is in agreement with the variation observed inFig. 9, i.e. the voidage frac-tion increases with small liquid fracfrac-tion (0.5% and 3.5%) comparing to the dry case and decreases when the liquid content increases to 40% (seeTable. 2). In order to analyse the distribution of the void depending on the liquid, a relative standard deviation (RSD) is calculated. The RSD is the standard deviation of the values of the voidage fraction of the dif-ferent selected zones divided by the mean value. We conclude from the values of RSD that the voids are evenly distributed in the dry case and at small liquid fractions (the RSD is about 5%). However, as expected, the increase of the amount of liquid leads to a non-uniformity of the voids in the granular bed (the RSD is about 15%). We conclude that, on the contrary to what was assumed before, large amount of liquid changes the structure of the granular material and not just fills the empty spaces. The liquid at 40% leads to the rearrangement of the glass beads by forming agglomerates and hence forming new gaps in between (see
Fig. 12). Both gaps and agglomerates have different size distributions. 3.2.2. Investigation of the shear stress at large liquid content
In this section, the effect of liquid on the shear behaviour of the glass beads of 70–110 μm is studied for different saturation states of liquid. The shear stress response of the wet glass beads is calculated in the same manner as previously. We are still focusing on the shear stress at steady-state but we choose to present the data using a stress ratio. The latter is the shear stress divided by the corresponding normal stress.
0 0.1 0.2 0.3 0.4 0.5 0.6 0 10 20 30 40 50 60 we t VR(%)
low normal stress
high normal stress
Fig. 9. Variation of the voidage fraction (εwet) as a function of the liquid fraction.
0 0.01 0.02 0.03 0.04 0 50 100 150 200 250 Rel ati ve freg u en cy
Grey level values
40% 3.5% 0.5% 0 glass beads air liquid
Fig. 10. Histograms of the frequency–intensity of grey levels from the raw images. Each peak is attributed to one phase of the wet granular material (glass beads, liquid or air).
dry
0.5%
3.5%
40%
Fig. 11. 2-D cross sectional images of wet glass beads of 70–110 μm with different liquid fractions (0, 0.5%, 3.5% and 40%, from the top to the bottom, respectively). On the left, the raw images and, on the right, the treated images. The latter allow distinguishing the three phases, i.e. black: air, white: glass beads, blue: liquid.
The presentation of the data in this manner helps to illustrate better the contribution of the capillary force on the shear stress. Also, it allows distinguishing different regimes of the stress ratio variation depending on the liquid fractions as you can see inFig. 13. We can distinguish four regimes:
a) For liquid fraction varying between 0.01% and 20%: an overview of all the data shows that the stress ratio increases with the liquid frac-tion and decreases by increasing the normal stress. A critical stress ratio value is observed at high normal stress, i.e. the stress ratio be-comes independent on the normal stress. Depending on the amount of liquid, this constant value is obtained at different normal stress values. Indeed, the value of the critical normal stress (value from which the stress ratio becomes constant) increases with the liquid fraction. This assumes that the effect of the capillary force is more pronounced at low normal stresses applied to the granular material comparing to the frictional force. Also, the effect of the amount of liq-uid is more relevant at low normal stresses than at high normal stresses.
b) For liquid fraction varying between 25% and 40%: the stress ratio is almost independent on the normal stress. An increase of the stress ratio is observed from 25% to 30% of liquid fraction, however no var-iation is observed between 30% and 40% where data are superimposed. The X-ray tomography for 40% shows that the regime corresponds to the funicular state of saturation where the glass beads form agglomerates with different gaps in between.
c) For liquid fraction varying between 50% and 55%: the stress ratio variation resembles to the one observed in regime a). In comparison with the variation in regime b), the stress ratio values increase at low normal stress but decrease at high normal stress. This means that by applying high normal stress to the wet glass beads, we reduce the voidage fraction and hence we get closer to the capillary regime where the capillary force decreases. The observation of the voidage fraction for 55% at high normal stress shows that the void only pre-sents 10% of the total volume of the granular material (seeFig. 9). d) For liquid fraction of 60%: the stress ratio decreases for an increase
of the normal stress. At high normal stress, the stress ratio joins the value obtained for the dry case. This means that the capillary regime is reached and overcame at high normal stresses since the stress ratio get back to the dry one, i.e. the gaps are totally filled by liquid and the capillary force vanished. Indeed the suction at the interface air–liquid is equal to zero when the particles are fully immersed.
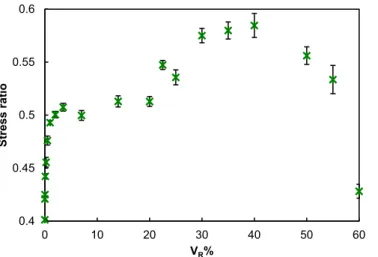
Fig. 14shows the variation of the mean value of the stress ratio cal-culated at high normal stress between 8 kPa and 11 kPa as a function of the liquid fraction in the range of 0.01% to 60%. The shear stress evolu-tion of the wet glass beads can be analysed from this graph. First, an in-crease of the shear stress with the liquid is observed until saturation is reached. The stress ratio goes up from 0.4 to 0.5 just by adding 1% of liq-uid. After saturation, the shear stress increases again from about 0.5 to 0.6 when the liquid fraction goes from 20% to 40%. At around 40%, the maximum shear stress is observed and after that any increase of liquid leads to decrease the stress.
3.2.3. Estimation of the tensile strength
In this section, we investigate the tensile strength in the funicular and capillary states of saturation. The model of Rumpf is only valid for the pendular state, where the capillary force is estimated from the liquid bridges distributed across the surface of rupture of the agglomerate. In the capillary state, the liquid fills all the space between particles and the force to hold the particles together is only produced from the capil-lary pressure, Pc, at the agglomerate surface. The tensile strength is
given by Schubert[15]as:
TS;capillary¼ SPc; ð6Þ
where Pcis the capillary pressure and is given as:
Pc¼ a01−εε γd ð7Þ
where a′ is a dimensionless factor ranging between 6 and 8, which is de-pendent on the particles rearrangement.
Using the assumption to estimate the coordination number, k, from the voidage fraction as k=π/ε[16], Eq.(7)can be written as:
Pc¼ a01−επ kγd ð8Þ
Sis the liquid saturation, which is defined as the volume of liquid di-vided by the volume of void in the granular material and expressed as:
S ¼1−εε VR: ð9Þ
In the funicular state, the tensile strength is estimated from those obtained in the pendular state and the capillary state. Indeed, zones with liquid bridges and zones completely saturated with liquid coexist in the funicular regime[15]. Therefore, the capillary force arises from the liquid bridge forces and the capillary pressure. The tensile strength in the funicular regime is expressed as:
TS;funicular¼ TS;capillarySS2−S
2−S1þ TS;pendular
S−S1
S2−S1; ð10Þ
where S1is the limit saturation between the pendular and the funicular
states and S2is the limit saturation between the funicular and the
capil-lary states. Two approximate values of S1and S2are considered as 0.25
and 0.9 respectively, from the literature[15].
It has been reported that the cohesive force due to the addition of liquid rises in the pendular, funicular and capillary states. This cohesion leads to a finite tensile strength in quasi-static experiments[12].Fig. 15
shows the theoretical data (continuous lines) and experimental data (crosses or squares) of the tensile strength for wide range of the liquid fraction up to 60%. The experimental tensile strength values are obtain-ed by linear extrapolation of curves inFig. 5-a [τ = μ(σ + TS)], distinctly
at low normal stress (σ ≤ 4 kPa) and high normal stress (σ ≥ 4 kPa). The tensile strength, at high normal stress (squares), increases for an in-crease of the liquid fraction while it remains small at low normal stress (crosses). We observe a good agreement between the experimental and theoretical data. The slope of the curves at high normal stress changes significantly at the boundary between the pendular and the funicular states; we observe a significant increase of the tensile strength in the fu-nicular state compared to the pendular state. Mitarai and Nori have re-ported that the tensile strength may either increase or decrease with the liquid fraction in the funicular state of saturation. We distinguish an in-crease of the tensile strength at high normal stress since the capillary forces rise from the pendular to the funicular regime. On the contrary, the tensile strength remains low and perhaps decreases at low normal stress as a result of the size enlargement of gaps and agglomerates in the granular bed. The rolling rearrangement of the agglomerates under traction leads to the breakage of less than one liquid bridge per grains and consequently to reduce the tensile strength value.
Regarding the capillary state, it seems from the estimation of the sat-uration level (see Eq.(9)) that it is not reached yet. For the maximum
Table 2
Values of the voidage fraction εwetand the RSD for each liquid fraction.
Liquid fraction 0 0.5% 3.5% 40%
Average εwet 0.31 0.46 0.45 0.15
liquid fraction VR= 60%, we calculate a saturation level S = 82%. Pierrat
and Caram have reported that the capillary regime occurs at a saturation level N90%. We assume that the value of the tensile strength may in-crease further until reaching the capillary state and then dein-creases. However, it can be observe a decrease of the experimental tensile strength at high normal stress at 60%. The latter highlight the effect of the normal stress in changing the regime. By applying large normal stress the packing density of the wet glass beads decreases and consequently the capillary regime can be reached for smaller liquid content.
4. Conclusions
We analysed the effect of particle size on the shear behaviour of par-tially wet glass beads. It was observed that the saturation level depends on the particle size. The voidage fraction of wet glass beads increases for a decrease in the particle size and the shear stress response to the ap-plied normal stress can be different. We have shown also that the tensile strength increases for the smaller particle size because of the increase in the contact number and the liquid bridges broken in the shearing plane. However, the lower packing density of the small glass beads leads to a
Fig. 12. An example of the cut image to define the different zones to estimate the voidage fraction. The selected squares (zones) are about 1 mm, which is equivalent to 12 particles side by side. 0.3 0.4 0.5 0.6 0.7 0.8 0.9 1 0 2 4 6 8 10 Stress ratio σ (kPa) 20% 14% 7% 1% 0.5% 0.25% 0.1% 0.03% 0.01% 0 0.3 0.4 0.5 0.6 0.7 0.8 0.9 1 0 2 4 6 8 10 Stress ratio σ (kPa) 40% 35% 30% 25% 0 0.3 0.4 0.5 0.6 0.7 0.8 0.9 1 0 2 4 6 8 10 Stress ratio σ (kPa) 55% 50% 0 0.3 0.6 0.9 1.2 1.5 1.8 0 2 4 6 8 10 Stress ratio σ (kPa) 60% 0
lower tensile strength values estimated experimentally. We also inves-tigate the effect of more liquid fractions on the shear behaviour of glass beads of 70–110 μm. The shear stress increases with the liquid up to a critical value and then decreases. The capillary force contribution on the shear stress vanishes at the capillary state of saturation. Regarding the voidage fraction, a linear decrease is observed for liquid fraction in the range of 20% to 60%. The tomography analysis showed that the in-crease of liquid beyond the pendular state leads to the formation of ag-glomerates. This study highlights the fact that the change of some properties of the granular material can largely change the obtained re-sults, such the particle size studied in this work. Thus we encourage more comparative studies using other materials (solid and/or liquid). List of symbols
A Area of the lid of the annular shear cell (m2)
a Local surface roughness height (μm)
a′ Dimensionless factor of the particle rearrangement c Cohesion (N/m2)
d Diameter of particle (m)
EC Energy required to break a liquid bridge (kg·m2·s−2)
F1, F2 Tangential forces applied to the lid (N)
FC Capillary force (N)
g Gravitational constant (N/kg) h Height of the bars in the shear cell (m)
k Coordination number
l Distance from the axis of rotation of the shear cell to the force sensors (m)
M Normal load (kg) PEG 400 Polyethylene glycol 400 Pc Capillary pressure (N/m2)
R Radius of particle (m)
Re External radius of the shear cell (m)
Ri Internal radius of the shear cell (m)
S Liquid saturation (%)
S1 Limit saturation between the pendular and the funicular
states (%)
S2 Limit saturation between the funicular and the capillary
states (%)
Sd Separation distance between two particles (m)
TS Tensile strength (Pa)
TS,pendular Tensile strength for the pendular regime (Pa)
TS,funicular Tensile strength for the funicular regime (Pa)
TS,capillary Tensile strength for the capillary regime (Pa)
vp,p Relative velocity particle-particle (m·s−1)
V Liquid bridge volume (m3)
VR Volume fraction (%)
Greek symbols
α Half filling angle (°) γ Surface tension (N/m) ΔP Capillary depression ε Voidage fraction εwet Wet voidage fraction
μ Friction coefficient
μg Dynamic viscosity of ambient gas (kg·m−1·s−1)
μl Dynamic viscosity of liquid (kg·m−1·s−1)
ρ Apparent density (kg/m3)
ρg Density of the ambient gas (kg/m3)
ρL Liquid density (kg/m3)
ρp Density of the particles (kg/m3)
ρS True density (kg/m3)
σ Normal stress (Pa) τ Tangential stress (Pa) ω Shear cell velocity (mrad/s)
Acknowledgements
The authors are thankful for the technical support by C. Rolland, L. Haurie and L. Devriendt.
References
[1]M. Adams, V. Perchard, The cohesive forces between particles with interstitial liquid,
Inst. Chem. Eng. Symp. 91 (1985) 147–160.
[2] J.F. Carr, Tensile strength of granular materials, Nature 213 (5081) (1967)
1158–1159.
[3]S.H. Chou, S.S. Hsiau, Experimental analysis of the dynamic properties of wet
gran-ular matter in a rotating drum, Powder Technol. 214 (2011) 491–499.
[4]A.R. Dexter, D.W. Tanner, Packing densities of mixtures of spheres with log-normal
distributions, Nature 238 (1972) 31–32.
[5] C.L. Feng, A.B. Yu, Effect of liquid addition on the packing of mono-sized coarse
spheres, Powder Technol. 99 (1998) 22–28.
[6]T.C. Halsey, A.J. Levine, How sandcastle fall, Phys. Rev. Lett. 80 (1998) 3141–3144.
[7]S. Herminghaus, Dynamics of wet granular matter, Adv. Phys. 54 (2005) 221–261.
[8] D.J. Hornbaker, R. Albert, I. Albert, A.-L. Barabasi, P. Schiffer, Nature (London) 387
(1997) 765.
[9] G. Lian, C. Thornton, M.J. Adams, A theoretical study of the liquid bridge force
be-tween rigid spherical bodies, J. Colloid Interface Sci. 161 (1993) 3381–3391.
[10] H. Louati, D. Oulahna, A. de Ryck, Apparent friction and cohesion of a partially wet
granular material in steady-state shear, Powder Technol. 278 (2015) 65–71.
[11] N. Lu, B. Wu, C. Tan, Tensile strength characteristics of unsaturated sands, J. Geotech.
Geoenviron. Eng. 133 (2) (2007) 144–154.
[12] N. Mitarai, F. Nori, Wet granular materials, Adv. Phys. 55 (2006) 1–45.
[13] S.T. Nase, W.L. Vergas, A.A. Abatan, J.J. McCarthy, Discrete characterization tools for
cohesive granular material, Powder Technol. 116 (2001) 214–223.
0.4 0.45 0.5 0.55 0.6 0 10 20 30 40 50 60 Stress rati o V R%
Fig. 14. Variation of the average stress ratio for normal stress (between 8 and 11 kPa) with the liquid fraction.
0 1 2 3 4 5 6 0.001 0.01 0.1 1 10 100 1000 T S (kPa) VR% Pendular Funicular Capillary
Fig. 15. Experimental and theoretical tensile strength as a function of the liquid fraction on a semi-logarithmic scale. Squares and crosses: experimental data for high normal stress (σN4kPa) and low normal stress (σb4kPa) respectively. Continuous lines: theoretical traction for different coordination numbers (1, 5, 6, 7 and 8) shown from bottom to top in this figure.
[14] D. Oulahna, R. Collet, A. de Ryck, Mechanical resistance due to shearing of partially wet granular media, KONA 30 (2013) 109–118.
[15]P. Pierrat, H.S. Caram, Tensile strength of wet granular materials, Powder Technol.
91 (1997) 83–93.
[16] W. Pietsch, Agglomeration Process, Wiley-VCH, Weinheim, 2002.
[17] H. Rumpf, The tensile strength of granules and agglomerates, Intersci. Publ. (1962)
379–418.
[18] M. Scheel, R. Seemann, M. Brinkmann, M. Di Michiel, A. Sheppard, B. Breidenbach, S.
Herminghaus, Morphological clues to wet granular pile stability, Nat. Mater. 7 (2008) 189–193.
[19]H. Schubert, Capillary forces: modeling and application in particulate technology,
Powder Technol. 37 (1984) 105–116.
[21]J.P.K. Seville, C.D. Willett, P.C. Knight, Inter-particle forces in fluidisation: a review,
Powder Technol. 113 (2000) 261–268.
[22]H.Y. Sohn, C. Moreland, The effect of particle size distribution on packing density,
Can. J. Chem. Eng. 46 (1968) 162–167.
[23] M. Wu, S. Radl, J.G. Khinast, A model to predict liquid bridge formation between wet
particles based on direct numerical simulations, AICHE J. 62 (2016) 1877–1897.
[24] A.B. Yu, J. Bridgwater, A. Burbidge, On the modelling of the packing of fine particles,
Powder Technol. 92 (1997) 185–194.
[25] A.B. Yu, C.L. Feng, R.P. Zou, R.Y. Yang, On the relationship between porosity and