A Human-like Walking Gait Simulator for Pedestrian Dead Reckoning Navigation
Texte intégral
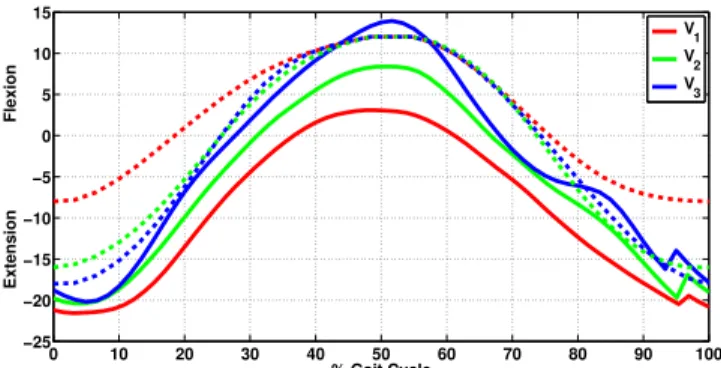
Figure
Documents relatifs
L’archive ouverte pluridisciplinaire HAL, est destinée au dépôt et à la diffusion de documents scientifiques de niveau recherche, publiés ou non, émanant des
14 presents numerical and experimental signals in the case of a centered point obstacle and initial excitation along (Oz).. As in Section 5.1, similarities can be observed, in
The normal reference targets for biomechanical gait parameters based on age- speed regressions in a large database might help clinicians detect gait abnormalities
這種區別的存在算我們意料到,但其界線劃分則出乎我們意料之外。其界線看似不
But they lack simulation of lower structures implied in movements, such as muscles and spinal neuron networks called central pattern generators (CPG). The aim of our work
Il y aurait beaucoup à gagner de « penser poème » non seulement pour concevoir des ateliers du dire qui durent au-delà du temps réglementaire mais aussi
CHC has completed an extensive number of tests with different wave probe wire gauges, as well as dynamic response tests, and have results that they are willing to share. I
Unloaded temperature calibration revealed that the thermal correction factors (CT) were 5 to 85 times larger for the smaller diameter cells, and up to 5.6 times larger for the
