Publisher’s version / Version de l'éditeur:
Vous avez des questions? Nous pouvons vous aider. Pour communiquer directement avec un auteur, consultez la première page de la revue dans laquelle son article a été publié afin de trouver ses coordonnées. Si vous n’arrivez pas à les repérer, communiquez avec nous à PublicationsArchive-ArchivesPublications@nrc-cnrc.gc.ca.
Questions? Contact the NRC Publications Archive team at
PublicationsArchive-ArchivesPublications@nrc-cnrc.gc.ca. If you wish to email the authors directly, please see the first page of the publication for their contact information.
https://publications-cnrc.canada.ca/fra/droits
L’accès à ce site Web et l’utilisation de son contenu sont assujettis aux conditions présentées dans le site LISEZ CES CONDITIONS ATTENTIVEMENT AVANT D’UTILISER CE SITE WEB.
Student Report (National Research Council of Canada. Institute for Ocean Technology); no. SR-2005-04, 2005
READ THESE TERMS AND CONDITIONS CAREFULLY BEFORE USING THIS WEBSITE. https://nrc-publications.canada.ca/eng/copyright
NRC Publications Archive Record / Notice des Archives des publications du CNRC :
https://nrc-publications.canada.ca/eng/view/object/?id=19d4b0a8-b08a-43d2-a925-995bbf2abde7 https://publications-cnrc.canada.ca/fra/voir/objet/?id=19d4b0a8-b08a-43d2-a925-995bbf2abde7
Archives des publications du CNRC
For the publisher’s version, please access the DOI link below./ Pour consulter la version de l’éditeur, utilisez le lien DOI ci-dessous.
https://doi.org/10.4224/8895623
Access and use of this website and the material on it are subject to the Terms and Conditions set forth at Redesign of IOT wave probe signal conditions
REPORT NUMBER SR-2005-04 NRC REPORT NUMBER SR-2005-04 DATE April 21, 2005 REPORT SECURITY CLASSIFICATION
Unclassified
DISTRIBUTION Unlimited TITLE
Design and Testing of Alternate Wave Probe Signal Conditioner
AUTHOR(S) Chad Collett
CORPORATE AUTHOR(S)/PERFORMING AGENCY(S)
PUBLICATION
SPONSORING AGENCY(S)
IOT PROJECT NUMBER 421008
NRC FILE NUMBER KEY WORDS
Wave, Probe, Conditioner, PIC, RS232
PAGES 43 FIGS. 11 TABLES 9 SUMMARY
An accurate and reliable way of measuring wave properties is fundamental for proper evaluation of ship hull designs and tank tests where specific types of waves are generated. The repeatability of wave probe data is essential for evaluating test results. These important qualities are in question for the current systems.
In this report I tested the effects of using thicker gauge wire on the IOT wave probes. The results are outlined within the body of the report and some conclusions are made from them. I also designed, prototyped and tested a new IOT wave probe signal conditioner. Also there were a couple of new ideas, which I developed that can be used for other projects and circuits. All of which are covered within this report.
ADDRESS National Research Council Institute for Ocean Technology Arctic Avenue, P. O. Box 12093 St. John's, NL A1B 3T5
Institute for Ocean Institut des technologies Technology océaniques
Design and Testing of Alternate Wave Probe Signal Conditioner
SR-2005-04Chad Collett
In no particular order: Greg Janes Peter Hacket Tim Ennis Jim Williams Jody Farr Ed Kennedy Vaughan Benson
Table Of Contents Table of Figures ………. ii 1.0 Introduction ……….. 1 1.1 Background ……….. 1 1.2 Problem ……… 1 1.3 Scope ……… 2
2.0 Wire Gauge Test ……….. 3
2.1 Stringing the Probes ………. 3
2.2 Test Outline ……….. 4
2.3 Test Results ……….. 5
2.3.1 30 Gauge Wire Test ………... 6
2.3.2 26 Gauge Wire Test ………... 7
2.3.3 24 Gauge Wire Test ………... 8
3.0 Wave Probe Conditioner ……….. 9
3.1 Hardware ……….. 9 3.2 Software ………. 10 3.3 Calibration Buttons ……… 11 3.4 Conditioner Testing ………... 12 4.0 Conclusions ……… 14 5.0 Recommendations ……….. 15 6.0 References ……….. 17
Appendix A: Wave Probe Conditioner Circuit ……… 18
Appendix B: PIC Source Code ……… 20
List of Figures and Tables
Figure 1.1 Modified IOT Wave Probe Conditioner ………... 1
Figure 1.2 Wave Probes ………. 2
Figure 2.1 Bottom Grommet ……….. 3
Figure 2.2 Upper Grommet and Elastic Band ……… 3
Figure 2.3 Loop in wire (Wrong) ………... 4
Figure 2.4 Wire Tied Down (Right) ……….. 4
Figure 2.5 Wave Tank ………... 5
Table 2.1 30 AWG Wire Data ………... 6
Table 2.2 30 AWG Wire Graph ……… 6
Table 2.3 26 AWG Wire Data ……….. 7
Table 2.4 26 AWG Wire Graph ……… 7
Table 2.5 24 AWG Wire Data ……….. 8
Table 2.6 24 AWG Wire Graph ……… 8
Figure 3.1 Modified IOT Wave Prove Conditioner ……….. 9
Figure 3.2 Modified IOT Wave Probe Conditioner Block Diagram ………. 9
Figure 3.3 LM555 configured for Astable Operation and Calculations ……….. 10
Table 3.1 Min/Max Button Code ………. 12
Table 3.2 30 AWG Wire Test ……….. 13
Table 3.3 26 AWG Wire Test ……….. 13
1.0 INTRODUCTION 1.1 Background
An accurate and reliable way of measuring wave properties is fundamental for proper evaluation of ship hull designs and tank tests where specific types of waves are generated. The repeatability of wave probe data is essential for evaluating test results. These important qualities are in question for the current systems.
1.2 Problem
The wave probes use 30 gauge wire, which is quite thin. When in use for extended periods of time the wire can stretch. This causes drifting, linearity loss, and other problems. I will test lower gauge (thicker) wire with the original IOT wave probe conditioner.
IOT currently utilizes three wave probe signal conditioning circuits: the Branckner, original IOT, and modified IOT. The Branckner is a commercially made product, while the modified IOT is an updated version of the original IOT design, both of which were in house designs. The problem is that the IOT designs have problems with signal lagging and response time compared to the Branckner. I will address the problems by trying to develop a new system to capture the wave probe capacitance and convert it into usable data.
1.3 Scope
Previous studies were conducted on the wave probe signal conditioner boxes. Various problems were found with the systems under these tests. I will examine the findings from the studies and perform some tests of my own. After testing is complete, with the help of people in the electronics lab I will try to find a solution to the problems. If no solution can be found then I will look into an alternate method of conditioning the wave probe signals.
Lower gauges of wire will be ordered and tested under the original IOT design. The wires will be thicker and therefore should better withstand the stresses of testing conditions in the wave tank. These lower gauge wires also
produce a higher range of capacitance per unit length, which leads to a greater signal output level change for the same wave height. If these wires produce linear and repeatable results, then the amount of time spent changing and re-stringing the wave probes can be reduced by using these wires as the standard for probe wiring.
Figure 1.2 Wave Probes
The end goal is to have robust wave probes coupled with signal conditioning electronics which produces reliable and accurate data. The new wave probe signal conditioner design could become an important part of the wave probe data collection system at IOT's Tow Tank and OEB Facilities.
2.0 WIRE GAUGE TEST 2.1 Stringing the Probes
There does not appear to be a work instruction that describes the method used to string wave probes. It isn’t very complicated, but to get it right takes practice. Correct wave probe stringing can be accomplished in a few easy steps:
1. Cut the correct length of wire that you need. The length is double the probe height, plus the amount of wire needed to make the connection.
2. Place an elastic band at the top end, between the grommet and metal post. Stretch out the elastic band with something about an Inch long. I used a pencil eraser. 3. Make one pass over the grommet on the bottom. Do not double wrap the wire, or
make a knot on the bottom end. This causes capacitance and linearity issues, which are still to be studied.
Figure 2.1 Bottom Grommet Figure 2.2 Upper Grommet and Elastic Band 4. Pass the wire through the top grommet, tying the two wire ends together in a knot.
You can now remove the eraser, which allows the elastic band to take up the slack in the wire. The tension from the elastic band should be enough to make the wire taught, but not enough to damage it. It should still wobble a little when you touch it.
5. The ends of the wire can now be twisted together and soldered to the output wire. Make sure afterwards to tie the wire down so that it is not loose and floating around. It should be noted that any changes in wire position will change the capacitance.
Figure 2.3 Loop in wire (Wrong) Figure 2.4 Wire Tied Down (Right)
2.2 Test Outline
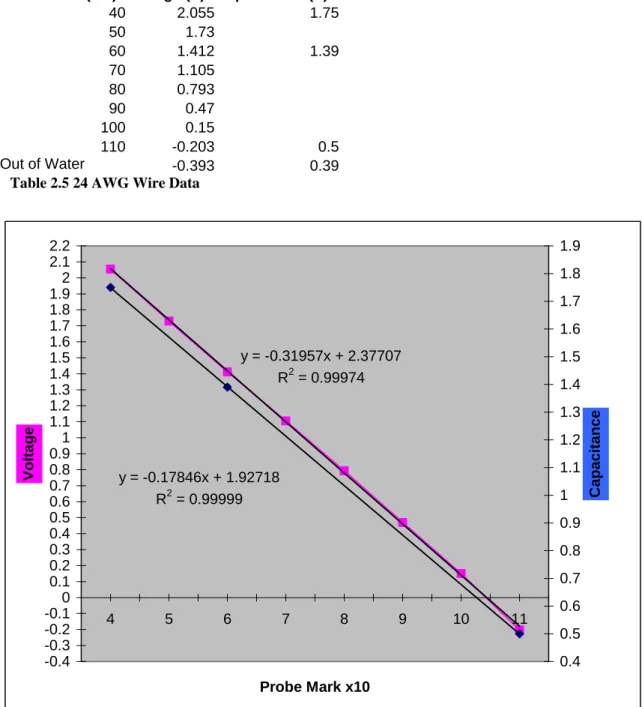
The purpose of the tests was to check and see if it is possible to use lower gauges (thicker) wire on the wave probes. Thicker wire would make the wave probes more versatile. The procedure I went about was to string the probes with 24, 26, and 30 AWG white colored kynar wrapping wire, following the above instructions. Previous studies have shown that only the white kynar wire made by OK Industries produces linear results. The wave probes have marks on them every 10 cm. I recorded the voltage out of the original IOT wave probe signal conditioner at each 10 cm mark as the probe was submerged in the portable water tank. See Figure 2.5 below. I also recorded the
capacitance at the center of the probe, bottom, and highest point I could get. I did this for each wire gauge. After all the data was collected I plotted it in Excel, which can be seen in section 2.3.
2.3 Test Results
The results below show that outputs with different gauge wires are linear and usable. The thicker wire produces a higher capacitance and consequently higher output voltage per unit length. The 30 gauge wire gives 7.57 mV/cm or 3.64 pF/cm, seen in Table 2.2 below. The 26 gauge gives 20 mV/cm or
10.86pF/cm, seen in Table 2.4. The 24 gauge wire gives 32.26 mV/cm or 17.86 pF/cm, seen in Table 2.6. These measurements were made over a 70 cm span. Any small errors most definitely came from human error, as I was only judging the probe marks by eye. This was a very simple test to see if it is even possible to use smaller gauge wires on the wave probes. Much more extensive tests would have to be done to verify its usability in tanks conditions. Future tests for example
would need to take into account drag on the wire from waves. It is expected that the wave probe with a thicker 24 AWG wire would show a slightly different response than a wave probe with 30 AWG wire under the same wave conditions due to the increased drag. For the results below I measured capacitance at the highest point in the water, lowest point, and middle of the probe. NRC – CHC, has conducted many tests and they should be contacted.
2.3.1 30 Gauge Wire Test
Distance (cm) Voltage (V) Capacitance (nF)
40 0.14 0.655 50 0.07 60 0 0.583 70 -0.07 80 -0.14 90 -0.2 100 -0.27 110 -0.34 0.4 Out of Water -0.39 0.375
Table 2.1 30 AWG Wire Data
y = -0.06821x + 0.20571 R2 = 0.99973 y = -0.03646x + 0.69185 R2 = 0.99999 -0.4 -0.3 -0.2 -0.1 0 0.1 0.2 0.3 0.4 0.5 0.6 0.7 0.8 0.9 1 1.1 1.2 1.3 1.4 1.5 1.6 1.7 1.8 1.9 2 2.1 2.2 4 5 6 7 8 9 10 11 Probe Mark (x10) Voltage 0.4 0.5 0.6 0.7 0.8 0.9 1 1.1 1.2 1.3 1.4 1.5 1.6 1.7 1.8 1.9 Capacitance
2.3.2 26 Gauge Wire Test
Probe Mark (cm) Voltage (V) Capacitance (nF)
40 1.17 1.23 50 0.96 60 0.768 1.01 70 0.568 80 0.36 90 0.17 100 -0.027 110 -0.23 0.47 Out of Water -0.375 0.38
Table 2.3 26 AWG Wire Data
y = -0.19925x + 1.36400 R2 = 0.99992 y = -0.10846x + 1.33718 R2 = 0.99998 -0.4 -0.3 -0.2 -0.1 0 0.1 0.2 0.3 0.4 0.5 0.6 0.7 0.8 0.9 1 1.1 1.2 1.3 1.4 1.5 1.6 1.7 1.8 1.9 2 2.1 2.2 4 5 6 7 8 9 10 11 Probe Mark x10 Voltage 0.4 0.5 0.6 0.7 0.8 0.9 1 1.1 1.2 1.3 1.4 1.5 1.6 1.7 1.8 1.9 Capacitance
2.3.3 24 Gauge Wire
Probe Mark (cm) Voltage (V) Capacitance (V)
40 2.055 1.75 50 1.73 60 1.412 1.39 70 1.105 80 0.793 90 0.47 100 0.15 110 -0.203 0.5 Out of Water -0.393 0.39
Table 2.5 24 AWG Wire Data
y = -0.31957x + 2.37707 R2 = 0.99974 y = -0.17846x + 1.92718 R2 = 0.99999 -0.4 -0.3 -0.2 -0.1 0 0.1 0.2 0.3 0.4 0.5 0.6 0.7 0.8 0.9 1 1.1 1.2 1.3 1.4 1.5 1.6 1.7 1.8 1.9 2 2.1 2.2 4 5 6 7 8 9 10 11 Probe Mark x10 Voltage 0.4 0.5 0.6 0.7 0.8 0.9 1 1.1 1.2 1.3 1.4 1.5 1.6 1.7 1.8 1.9 Capacitance
3.0 WAVE PROBE CONDITIONER 3.1 Hardware
The IOT waveprobe conditioner design operates as follows. The capacitance of the wave probe is connected to the front end of a dual 555 timer (556). When the wave probe is submerged into water, its
capacitance increases. This is due to the electrical properties of the wire and the probe. The rise in capacitance increases the frequency out of the first 555 due to the way it is configured. The second 555 timer is triggered by the output of the first 555 timer to make it operate in the “one shot” mode. The frequency that is output out of the timer then goes through a low-pass filter network, which converts the frequency into a DC voltage. Refer to Figure 3.2. Studies have shown that when compared to the Branckner model, the IOT design had problems with signal lagging, and doesn’t reach its peak output voltage.
Figure 3.1 Original IOT Wave Prove Conditioner
Figure 3.2 Original IOT Wave Probe Conditioner Block Diagram
What I set out to do first was find a better way to sample the 556 timer output and change it to a voltage. My plan was to use a Microchip PIC to take the output from the 556 timer and convert it to RS232 serial digital format, which was then sent to the Digital to analog converter (DAC). After some consideration we realized that it would not be advisable to redesign the current wave probe conditioners. This was because the current
systems work, and there are new ways to accomplish the same task. So I decided to design a conditioner that could be used in a different data collection system. Instead of sending the data to a DAC, I sent it out over RS232 to a PC. The schematic for my circuit can be seen in Appendix A.
3.2 Software
There was already some PIC software developed by Greg Janes, which was used in the IOT developed RPM boards. It takes the rpm’s from a motor in the form of a pulse train, samples it with a PIC, and outputs the data to a DAC which sends the signal to a data acquisition system. I modified the code, with Greg’s help, to take in a frequency from a 555 timer, convert it to usable information, and transfer it out to a computer in RS232 format. Calculations were used to determine what value of resistors I required to get the frequency out of the 555 timer into the range that the PIC can use, these can be seen in Figure 3.2.
I was new to the Hi-Tech compiler that Greg utilizes, so it took some time to learn the commands and format that the C++ code is written in. Then I proceeded to edit the code to suit my needs. I changed the code around significantly and managed to get it to work with RS-232. Then I tested the circuit by using HyperTerminal on the computer. The PC displayed unstable readings due to the serial port being unable to process data quickly enough. This was because the PIC has no flow control or handshaking. In order to get it working correctly I had to implement a static flow control in the PIC, which was just a delay to slow down transfers. The various changes can be seen in appendix B, where you can see the complete code.
3.3 Calibration Buttons
Another feature that makes this design unique is the addition of min and max calibration buttons. With the current wave probe conditioners, calibration is a long and tedious process. I have designed a way to make that process very simple. Using two buttons, digital calibration can be achieved.
When the wave probe is at its highest point in the water, you press the “Max” button. The PIC captures a reading at that point and saves it in memory. Then you put the wave probe at its lowest point in the water, and press the min button, which saves the reading. In the PIC code the wave probe input is scaled with the minimum and maximum values into a 16-bit number through some simple equations. The code can be seen below in Table 3.1.
dDeltaT = dTime - dTimeOld; if (dDeltaT > dMax)
dDeltaT = 4095; else if (dDeltaT < dMin)
dDeltaT = 0; else{
dDeltaT -= dMin;
dDeltaT = (dDeltaT/dRange) * 4095; }
cOut = (unsigned char) dDeltaT; TxBuffer[1] = cOut; else if (RBIF) { inputb = PORTB; if (inputb == 16) dMin = dSample; if (inputb == 32) dMax = dSample; dRange = dMax - dMin;
RBIF = 0;
Table 3.1 Min/Max Button Code
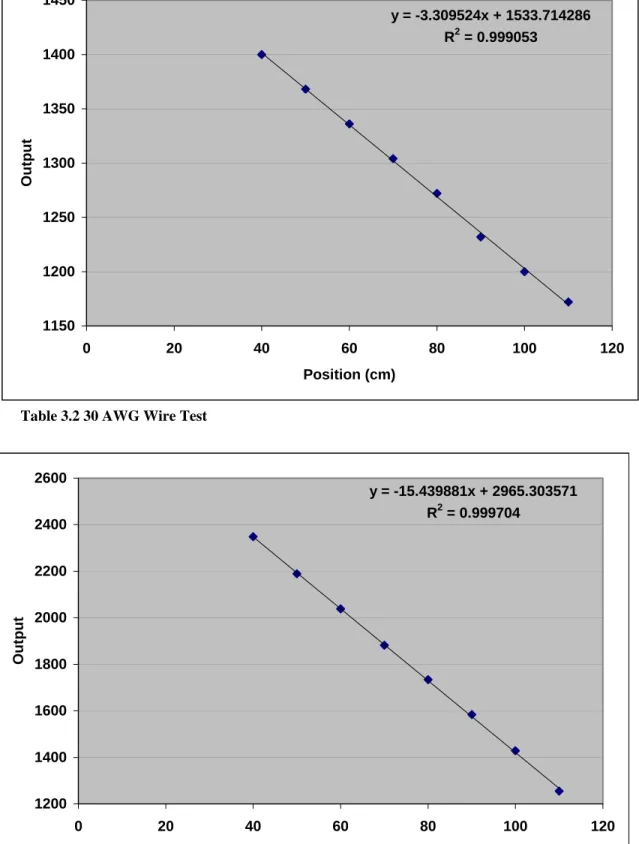
3.4 Conditioner Testing
I tested my wave probe conditioner with two different wire gauges to get the two extremes of capacitance. The first test was done with 30 gauge wire and the second with 24 gauge. The results can be seen below. Note that the “output” is just a number that the PIC sends to HyperTerminal, it is derived from the timing inside of the PIC and doesn’t equate to an actual quantity. This is why I implemented the min and max feature, because then you can actually tell how deep the probe is. The linearity doesn’t change with
y = -3.309524x + 1533.714286 R2 = 0.999053 1150 1200 1250 1300 1350 1400 1450 0 20 40 60 80 100 120 Position (cm) Output
Table 3.2 30 AWG Wire Test
y = -15.439881x + 2965.303571 R2 = 0.999704 1200 1400 1600 1800 2000 2200 2400 2600 0 20 40 60 80 100 120 Position (cm) Output
4.0 CONCLUSION
This project has been a success in a number of ways. Firstly for the amount of time spent working on it, this was definitely worth looking into. This wave probe conditioner has potential applications in many areas that involve taking a frequency and converting it data that is usable to a computer. IOT now has another potential source of conditioning for wave probes and signals of other types. The PIC is not only capable of receiving frequencies, but also analog signals. Digital systems are also a lot less
susceptible to noise, and therefore work well in noisy environments. With digital signals you also skip the problematic analog signal conditioner portion of the system and feed the output directly into a computer, which is where all the data gets processed in the end. Development is underway to implement a server computer with the ability to take in data from multiple serial ports.
It should be noted that my tests of the different gauges of wire on the wave probes shows that the outputs are linear, and the system is possibly capable of using thicker wire. Any deficiencies seen are quite likely caused by human error. But in order to truly see how the wire reacts, it would need to be tested in actual test conditions at IOT’s test Facilities or using a suitable controlled apparatus. The tests I did are merely basic tests to see if the wires would work at all.
5.0 RECOMMENDATIONS
This project is not completely finished due to time constraints. I have completed the designing, prototyping and part of the testing of the idea. There are a few more things that would have to be completed before it is a finished product. One such thing would be to package the circuit into an enclosure, and then decide where it would derive the 5 volts required to operate.
Figure 5.1 Prototyped Wave Probe Conditioner
It also needs to be tested with Keith Mew’s server software. The PIC outputs the correct format, but I haven’t tested to see if it works. Keith’s server would need to be tested with the conditioner to see if the transfer rate is too high, and the data format is correct. Because the server multiplexes multiple inputs into one serial line, if the transfer rate of the PIC is too high, you start to use up the bandwidth of the serial output.
Changing a couple of delays in the PIC code can solve this problem. This is good because when you slow down the transfer rate of the PIC you also increase consistency of the PIC output data.
More precise tests need to be done on the conditioner to see how it reacts under typical conditions, and to see how well it performs. This would involve either testing the conditioner in actual tank settings, or testing it with a 3-axis linear table arrangement, as discussed in Justin Wheeler’s report, The Dynamic Response of Capacitance Wave Probes.
Jacque Daze of NRC's Canadian Hydraulic Center should be contacted about the wire gauge tests. CHC has completed an extensive number of tests with different wave probe wire gauges, as well as dynamic response tests, and have results that they are willing to share. I have contacted Jacques, and he sent me a lot of data, which was gathered using the commercially available Brancker WG-30 wave probe signal conditioner.
6.0 References
[Anonymous] Microchip: PIC16F87XA Datasheet (2003). Available from:
http://ww1.microchip.com/downloads/en/DeviceDoc/39582b.pdf via the Internet. Accessed February 18, 2005.
[Anonymous] Maxim Integrated Products: ICM7555/7556 (1994). Available from
http://pdfserv.maxim-ic.com/en/ds/ICM7555-ICM7556.pdf via the Internet. Accessed February 17, 2005.
[Anonymous] Maxim Integrated Products: MAX203 (2003). Available from
http://pdfserv.maxim-ic.com/en/ds/MAX200-MAX213.pdf via the Internet. Accessed March 3, 2005.
Paisley, R. LM555 Circuits (2004). Available from:
http://home.cogeco.ca/~rpaisley4/LM555.html#3 via the Internet. Accessed February 18, 2005.
Sheridan, K. A digital water level meter (2002); Available from:
http://hawthorn.csse.monash.edu.au/~njh/electronics/watersensor/ via the Internet. Accessed February 25, 2005.
Wheeler, J (2004). The Dynamic Response of Capacitance Wave Probes. St. John’s: National Research Council’s Institute for Ocean Technology.
/*--- * Wave Probe Signal Conditioner
*
* Ver 1.2: Chad Collett: April 21, 2005
* This is the Basic code, it doesn't contain limit switches, and is in a format * that HyperTerminal can read. It is not in Keith Mew's server configuration. * This code outputs the raw timing of DdeltaT to the serial port, this is a number * determined by the constantly counting time inside the PIC.
*---*/ #include <pic.h> #include <stdio.h> /* Function Prototypes */ void InitParallelPorts(); void InitCCPTimer1(); void InitUART(); void interrupt ISR(); /* Globals */
unsigned int iTMR1Roll; // Count TMR1 roll overs (in ISR) to extend it to 32 bits. unsigned int iTMR1;
unsigned char iCCP1H; // Capture high. unsigned char iCCP1L; // Capture low. unsigned char iGotcha;
unsigned int bFirst; unsigned int iSkip; //double dSample; unsigned int iCount; bank1 double dTime; bank1 double dTimeOld; bank1 double dDeltaT; int i, j;
// --- main () {
// ---
InitParallelPorts(); //25 Sept 2003: RD3 is an output
RA0 = 1; // Indicate running, then indicates edge detection. InitUART();
InitCCPTimer1(); bFirst = 1;
iGotcha = 0; // Flag to show when new capture occurs. iTMR1Roll = 0;
iTMR1 = 0; iCCP1H = 0; iCCP1L = 0;
dTime = 0.0; dTimeOld = 0.0; dDeltaT = 0.0; // Setup the Interrupts: RCIE = 0;
CREN = 0; // Clear and then set the CREN bit to clear
CREN = 1; // OERR and FERR (if any) and enable async reception. // Enable Timer1 interrupts
TMR1IE = 1; // Enable interupts
GIE = 1; // Global Interupt Enable bit iGotcha = 0;
CCP1IF = 0;
CCP1IE = 1; // Enable capture. i = 0; j = 0; while (1) { if (iGotcha == 1) { dTime = ((double)(iTMR1) * 65536.0); dTime += ((double)(iCCP1H) * 256.0); dTime += (double)(iCCP1L);
iGotcha = 0; // Release the buffer variables to the ISR. if (bFirst == 1) {
bFirst = 0; }
else {
dDeltaT = dTime - dTimeOld; // dDeltaT is in counts. if (iSkip > 749) { // Only output every 749 signal
iCount = (unsigned int) dDeltaT; printf("%d\r",iCount);
iSkip = 0;
}
} // end else
dTimeOld = dTime; // Save time for next iteration. } // end if iGotcha == 1 } // while (1) } // main // --- void InitParallelPorts() { // --- // PORTA
PORTA = 0x00; // Default output pins to low. TRISA = 0x00; // Set 0-7 pins of port A to output. // PORTB
PORTB = 0x00; // Default output pins to low. TRISB = 0xFF; // Set 0-7 pins of port B as input. PORTC = 0x00; // Default outputs to low. TRISC = 0x96; // 1001 0110
// PORTD
PORTD = 0x00; // Default values for outputs. TRISD = 0x06; // Set RD2 and RD1 to input. // PORTE
PORTE = 0x00; // Default outputs to low.
TRISE = 0x00; // Set 0-7 pins of port E as output. }
// --- void InitCCPTimer1() { // ---
CCP1CON = 0x05; // capture every rising edge. CCP2CON = 0x05;
TMR1IF = 0; // Clear the interrupt flag directly (i.e. no clr on read) T1CON = 0x31; // 1:8 prescale, internal Fosc/4, start.
iTMR1Roll = 0; // Count the roll overs in the ISR to extend the clock to 32 bits. //TMR1IE = 1; // Enable timer interrupt in main routine before starting measure. } // --- void InitUART() { // --- SPBRG = 9; // 115.2k RCIF = 0; // reset flag BRGH = 1; // high baud rate SYNC = 0; // asynchronous SPEN = 1; // enable serial port pins CREN = 1; // enable reception SREN = 0; // no effect
TXIE = 0; // disable tx interrupts TX9 = 0; // 8-bit transmission RX9 = 0; // 8-bit reception TXEN = 1; // enable the transmitter PEIE = 1; // enable peripheral interrupts
PIE1 = 0; // clear all peripheral interrupt enables RCIE = 0; // (Enable it when ready to use.) }
// Used by printf to transmit byte // --- void putch(unsigned char byte){ // --- unsigned char stat;
stat = TXSTA; if ((stat & 0x02) != 0){
for (i=0;i<99;i++) {} i = 0;
} }
// --- */ void interrupt ISR() {
// --- if (TMR1IF) {
++iTMR1Roll; // Increment the roll counter.
if (iTMR1Roll > 2637) {
iTMR1Roll = 0; // Don't let the counter cause overflow error.
bFirst = 1; }
iSkip++; //Increment iSkip
TMR1IF = 0; // Clear the interrupt flag directly (i.e. no clr on read) }
else if (CCP1IF) {
if (iGotcha == 1) {
RA0 = 1; // Indicate overrun. }
else {
iTMR1 = iTMR1Roll; iCCP1H = CCPR1H; iCCP1L = CCPR1L;
iGotcha = 1; // Let the main know we have a new capture. RA0 = 0; // Most recent capture did not cause overrange.
}
CCP1IF = 0; // Clear the interrupt flag. } // if CCP1IF
/*--- * Wave Probe Signal Conditioner
*
* Development History: *
* Ver 1.3: Chad Collett: Mar 11, 2005
* This code is optimised for Keith Mew's Server. It contains the code for * the limit buttons that I created, as well as the scaling to put the * data into a 12 bit word.
*---*/ #include <pic.h> #include <stdio.h> /* Function Prototypes */ void InitParallelPorts(); void InitCCPTimer1(); void InitUART(); void interrupt ISR(); /* Globals */
unsigned int iTMR1Roll; // Count TMR1 roll overs (in ISR) to extend it to 32 bits. unsigned int iTMR1;
unsigned char iCCP1H; // Capture high. unsigned char iCCP1L; // Capture low. unsigned char iGotcha;
unsigned int bFirst;
unsigned int iInactTMR; // Inactivity time out timer. Incremented in TMR1 ISR. unsigned int iSkip;
bank1 double dTime; bank1 double dTimeOld; bank1 double dDeltaT; double dSample; unsigned char cOut; int inputb;
double dMin; double dMax; double dRange; #define BOT 0xAAAA #define EOT 0xBBBB unsigned int TxBuffer[4]; unsigned char *tptr; unsigned char txidx;
// --- main () {
// ---
RA0 = 1; // Indicate running, then indicates edge detection. InitUART();
InitCCPTimer1();
tptr = (unsigned char *)TxBuffer; //Point the byte pointer to transmit buffer. txidx = 0;
TxBuffer[0] = BOT; TxBuffer[3] = EOT;
bFirst = 1;
iGotcha = 0; // Flag to show when new capture occurs. iTMR1Roll = 0; iInactTMR = 0; iTMR1 = 0; iCCP1H = 0; iCCP1L = 0; iSkip = 0; dTime = 0.0; dTimeOld = 0.0; dDeltaT = 0.0; // Setup the Interrupts: RCIE = 0;
CREN = 0; // Clear and then set the CREN bit to clear
CREN = 1; // OERR and FERR (if any) and enable async reception. // Enable Timer1 interrupts
TMR1IE = 1; // Enable interupts
GIE = 1; // Global Interupt Enable bit // RB Interrupts, for the calibration buttons RBIE = 1;
RBIF = 0; iGotcha = 0; CCP1IF = 0;
CCP1IE = 1; // Enable capture. dMin = 1000; dMax = 2500; dRange = 1500; // Loop Forever: while (1) { if (iGotcha == 1) { dTime = ((double)(iTMR1) * 65536.0); dTime += ((double)(iCCP1H) * 256.0); dTime += (double)(iCCP1L);
iGotcha = 0; // Release the buffer variables to the ISR. if (bFirst == 1) {
bFirst = 0; }
else {
dDeltaT = dTime - dTimeOld; // dDeltaT is in counts. if (iSkip > 599) { // Only output every 500th sample, so that the transmitter isn't overrun
dSample = dDeltaT; if (dDeltaT > dMax)
dDeltaT = 4095;
else if (dDeltaT < dMin) dDeltaT = 0;
else{
dDeltaT -= dMin;
dDeltaT = (dDeltaT/dRange) * 4095; }
cOut = (unsigned char) dDeltaT; TxBuffer[1] = cOut; TxBuffer[2] = cOut; TXIE = 1; TXEN = 1; iSkip = 0; } } // end else
dTimeOld = dTime; // Save time for next iteration. } // end if iGotcha == 1
iSkip++; //Increment iSkip } // while (1) } // main // --- void InitParallelPorts() { // --- // PORTA
ADCON1 = 0x00; // Set 0-7 pins of port A as analog to digital converters. PORTA = 0x00; // Default output pins to low.
TRISA = 0x00; // Set 0-7 pins of port A to output. // PORTB
PORTB = 0x00; // Default output pins to low. TRISB = 0xFF; // Set 0-7 pins of port B as input. PORTC = 0x00; // Default outputs to low. TRISC = 0x96; // 1001 0110
// PORTD
PORTD = 0x00; // Default values for outputs. TRISD = 0x06; // Set RD2 and RD1 to input. // PORTE
TRISE = 0x00; // Set 0-7 pins of port E as output. }
// --- void InitCCPTimer1() { // ---
CCP1CON = 0x05; // capture every rising edge. CCP2CON = 0x05;
TMR1IF = 0; // Clear the interrupt flag directly (i.e. no clr on read) T1CON = 0x31; // 1:8 prescale, internal Fosc/4, start.
iTMR1Roll = 0; // Count the roll overs in the ISR to extend the clock to 32 bits. //TMR1IE = 1; // Enable timer interrupt in main routine before starting measure. } // --- void InitUART() { // --- SPBRG = 9; // 115.2k RCIF = 0; // reset flag BRGH = 1; // high baud rate SYNC = 0; // asynchronous SPEN = 1; // enable serial port pins CREN = 1; // enable reception SREN = 0; // no effect
TXIE = 0; // disable tx interrupts TX9 = 0; // 8-bit transmission RX9 = 0; // 8-bit reception TXEN = 1; // enable the transmitter PEIE = 1; // enable peripheral interrupts
PIE1 = 0; // clear all peripheral interrupt enables RCIE = 0; // (Enable it when ready to use.) }
void interrupt ISR() {
// --- if (TMR1IF) {
++iTMR1Roll; // Increment the roll counter.
//if (iTMR1Roll > 50000) { if (iTMR1Roll > 2637) { //if (iTMR1Roll > 528) {
iTMR1Roll = 0; // Don't let the counter cause overflow error.
// Reset periodically to prevent cumulative // math problems.
bFirst = 1; }
TMR1IF = 0; // Clear the interrupt flag directly (i.e. no clr on read) }
else if (CCP1IF) {
if (iGotcha == 1) {
// Overrun. The main routine hasn't finished // processing the previous capture.
RA1 = 1; // Indicate overrun. }
else {
iTMR1 = iTMR1Roll; iCCP1H = CCPR1H; iCCP1L = CCPR1L;
iGotcha = 1; // Let the main know we have a new capture. RA1 = 0; // Most recent capture did not cause overrange.
}
iInactTMR = 0; // Clear the inactivity timer.
CCP1IF = 0; // Clear the interrupt flag. } // if CCP1IF else if (RBIF) { inputb = PORTB; if (inputb == 16) dMin = dSample; if (inputb == 32) dMax = dSample; dRange = dMax - dMin; RBIF = 0;
} else if (TXIF) {
if (txidx >= 8) { //8 Bytes to transmit txidx = 0; TXIE = 0; } else { int i; TXREG =(tptr[txidx]); for (i=0;i<50;i++) {} txidx++; } } }