Publisher’s version / Version de l'éditeur:
Vous avez des questions? Nous pouvons vous aider. Pour communiquer directement avec un auteur, consultez la
première page de la revue dans laquelle son article a été publié afin de trouver ses coordonnées. Si vous n’arrivez pas à les repérer, communiquez avec nous à PublicationsArchive-ArchivesPublications@nrc-cnrc.gc.ca.
Questions? Contact the NRC Publications Archive team at
PublicationsArchive-ArchivesPublications@nrc-cnrc.gc.ca. If you wish to email the authors directly, please see the first page of the publication for their contact information.
https://publications-cnrc.canada.ca/fra/droits
L’accès à ce site Web et l’utilisation de son contenu sont assujettis aux conditions présentées dans le site LISEZ CES CONDITIONS ATTENTIVEMENT AVANT D’UTILISER CE SITE WEB.
Proceedings of the 25th International Conference on Port and Ocean Engineering under Arctic Conditions (POAC 2019), 2019-06-13
READ THESE TERMS AND CONDITIONS CAREFULLY BEFORE USING THIS WEBSITE. https://nrc-publications.canada.ca/eng/copyright
NRC Publications Archive Record / Notice des Archives des publications du CNRC : https://nrc-publications.canada.ca/eng/view/object/?id=6dea809f-1613-4f34-95c2-eb126ff38cbf https://publications-cnrc.canada.ca/fra/voir/objet/?id=6dea809f-1613-4f34-95c2-eb126ff38cbf
NRC Publications Archive
Archives des publications du CNRC
This publication could be one of several versions: author’s original, accepted manuscript or the publisher’s version. / La version de cette publication peut être l’une des suivantes : la version prépublication de l’auteur, la version acceptée du manuscrit ou la version de l’éditeur.
Access and use of this website and the material on it are subject to the Terms and Conditions set forth at
Analysis of pack ice deterioration due to wave action on the Grand Banks, Spring 2017
Proceedings of the 25th International Conference on
Port and Ocean Engineering under Arctic Conditions
June 9-13, 2019, Delft, The Netherlands
Analysis of Pack Ice Deterioration Due to Wave Action on the
Grand Banks, Spring 2017
Thomas Browne1, Captain John Broderick2, David Watson3, Mohamed Sayed3
1 National Research Council of Canada, St. John’s, Canada
2 Broderick Marine Consulting, St. Philip’s, Canada 3 National Research Council of Canada, Ottawa, Canada
ABSTRACT
The deterioration of pack ice due to wave action on the Grand Banks, offshore Newfoundland, is investigated. A description of wave effects on pack ice is provided that is based on the observations of one of the authors (JB) during several icebreaking voyages on the East Coast of Canada and in the Eastern Arctic. Sea ice deterioration in the region is observed to be dominated by swell wave action which extends to relatively long distances within the ice pack. Heat flux due to wave action is incorporated in an ice dynamics forecast model and used to evaluate the role of wave action on ice deterioration. A test case from the 2017 ice season is used to calibrate and examine the performance of the proposed formulation. The paper compares hindcasts of ice extent and concentration to observations. The results indicate that deterioration of the pack ice due to wave action is significant during severe storm conditions.
KEY WORDS: Sea ice deterioration; Ice dynamics model; Waves; Swells; Sea state.
INTRODUCTION
When considering the forces that propel and transform a coastal ice regime, surface winds, lunar tides, and ocean currents are often considered the principal driving forces. While these dynamic drivers have significant influence on the drift and composition of mobile ice regimes, waves and ocean swells also have an observable effect on the prevailing ice cover. Dramatic changes in the size and composition of an ice regime are often the result of wave actions and it has been observed that ice forecasts tend to be less reliable during and after major storm events. Wave effects are often localized and unique to particular geographical areas making them difficult to quantify or predict. This paper includes a description of wave effects on pack ice that is based on the observations of one of the authors (JB) during several icebreaking voyages on the East Coast of Canada and in the Arctic as the Commanding Officer of the Canadian Coast Guard icebreaker (CCGS) Henry Larsen.
Past field studies have investigated the effects that ocean waves have on sea ice (Wadhams and Squire, 1980) as well as glacial ice (Crocker and English, 1997). Numerical models have also been developed to address sea ice melt as a function of floe geometry (Steele, 1992). Despite the marked impact of waves on sea ice, to date, wave effects have not been captured in any operational sea ice dynamics forecast models.
Mariners navigating in pack ice must consider all dynamic driving factors when selecting a route through a particular ice field. The Grand Banks, offshore Newfoundland, is a particularly high marine traffic area that experiences a yearly incursion of sea ice each spring. The ice originates in the Arctic and is transported south by the Labrador Current. The presence of sea ice on the Grand Banks can obstruct offshore oil and gas operations and fishing, and impede transatlantic shipping routes. Accurate sea ice forecasting technologies are critical to mariners for safe decision making and ice management in the region.
This paper presents a methodology for the incorporation of wave-induced ice deterioration in a sea ice dynamics forecast model. An event when significant ice deterioration was observed on the Grand Banks is investigated to assess the role of ice deterioration on forecast accuracy.
A DESCRIPTION OF THE EFFECTS OF WIND WAVES AND OCEAN SWELLS ON COASTAL ICE REGIMES
A description of the effects of ocean waves on ice regimes is provided by one of the authors (JB) who was Commanding Officer of the CCGS Henry Larsen, tasked with providing icebreaking services on the East Coast of Canada and the Artic.
Wind wave and swell action greatly influence the drift and structure of sea ice and likely contribute more to the transformation of an ice regime than any other force. When wind blows over a body of water for an extended period of time waves are generated. The properties of waves are determined by a number of factors, including wind velocity, duration of the wind event, and the size of the body of water that the wind is blowing across, normally referred to as fetch. When these waves reach the windward edge of an ice field there are three substantial effects. First, it amplifies the already existing wind drift of the ice field, second, the wave action will induce a mixing motion that further compresses and deforms the original ice floes, and third, it will enhance and accelerate the ice destruction which naturally occurs in a mobile ice regime. Wave effects can extend into an ice field for a considerable distance. The depth of the penetration will depend on the magnitude of the waves and the concentration and thickness of the particular ice regime. Coastline geometries will dictate the development of sea states and as a result wave effects can be localized and unique to particular geographical areas.
Sheltered waters, such as the Gulf of St. Lawrence and Hudson Strait, are partially enclosed by coastlines which tend to limit the size of the waves. In these regions large swells do not have an opportunity to develop, however wind driven wave action remains a predominant influence on the ice regime. In less sheltered areas, such as the coasts of Labrador and eastern Newfoundland, direct exposure to large ocean swells subject sea ice to forces of a much higher magnitude. Ocean swells can be differentiated from wind driven waves by their long wave length and extended period. Swell action can act to compress an ice pack along exposed coast lines and is a significant contributor to the dramatic pressure events frequently observed in the region. On the east facing coasts of Newfoundland and Labrador ocean swells often reach heights exceeding 10 m, with correspondingly large wave lengths and periods. Waves of this magnitude are observed to project their force well into an ice regime and it is common to see rolling waves many miles inside an ice field.
Propelled by prevailing winds and the Labrador Current this pack drifts southeastward and by late March is covering a large portion of the northern Grand Banks. This east coast pack is not constricted or impeded by land barriers and is generally more mobile with many open water leads. Consequently, its drift movements are often more rapid and unpredictable, particularly during storm events. During severe winter storms large ocean swells combine with wave actions from the prevailing winds. This combination often creates extreme sea states, with waves that can penetrate deep into the ice pack. Under these conditions significant deterioration of an ice field can occur in a short period of time, and the entire ice regime can undergo a major transformation.
The operational risks and ice management impacts which arise from wave penetration into an existing ice pack are described below, as detailed by the Commanding Officer of the Canadian Coast Guard icebreaker (CCGS) Henry Larsen.
Transformation of the Ice Regime
When waves penetrate an ice field, the first noticeable effect is the impact on floe size. Waves flowing through an ice field will induce a bending force that will cause ice floes to crack into smaller pieces. This breaking effect will be variable and will depend on both the thickness and strength of the prevailing ice cover and the size of the wave moving through the ice pack. For ships transiting through an ice field the downsizing of the ice floes within the pack may have some initial advantages. The smaller floes are easier to move through with less friction between the hull and the ice. The loosened pack also allows the ship to gain more forward momentum. Unfortunately the initial advantages are often short lived as another consequence of the wave action takes effect. The smaller floes, which are under directional pressure from the waves and other drifting forces, often override each other creating a layering effect. The overriding and up- ending of the smaller floes increases the effective thickness and depth of the pack, and increases the localized concentration. This is particularly common in areas where the movement of the ice field is restricted by a coastline, however it can also occur in offshore areas where there are competing drift forces, such as strong wind from a direction which opposes the influence of the swell.
On the Grand Banks much of the structural deformation of the ice regime is a result of large ocean swells. The swell will induce a directional force into the ice field which will likely vary from the other driving forces. Although wind, wave and current rarely have the same directionality, this can be the case along the Newfoundland coast during prolonged spring storm events. These storms are typically characterized by extended periods of north-easterly winds coinciding with a strong southward flowing current and a large swell from the north east. This combination of driving forces act in concert to propel the ice pack rapidly southward to cover a large portion of the Grand Banks. The northern ice pack frequently obstructs the high marine traffic areas surrounding the oil fields and encroaches on the transatlantic shipping lanes passing south of Cape Race.
THE ICE DETERIORATION MODEL
An empirical formulation that accounts for ice deterioration due to wave action is incorporated in an existing high-resolution sea ice dynamics forecast model. Details of the existing model, including the governing equations and the numerical solutions, have been described in a number of past publications (see Kubat et al., 2016). Recent efforts have focused on addressing the observed deterioration of ice fields during high sea states.
based on wave enhanced heat flux was derived by Crocker and English (1997) and a thorough analysis of this formulation was performed by Savage (1999). This approach considers the wave Reynold’s number, the ratio of ice piece length to wave height, and the wave steepness, all of which is relevant for the wave enhanced heat flux of sea ice. However, one must consider the dense packing of sea ice and the effect this has on the heat transfer of individual ice floes. While multiple bergy bits and growlers can be present in a given region, the areal concentration (i.e. the fraction of the sea surface covered by ice) is not nearly as dense as that of individual ice pieces in an ice field. The dense packing of an ice field will act to limit the lateral heat transfer, and associated lateral melt, of individual ice pieces. To model sea ice melt deterioration it is therefore necessary to account for concentration and floe diameter as this will dictate the perimeter and lateral surface area of the ice field. The wave enhanced heat flux for sea ice is given by Eq. 1. The first three terms of the RHS of Eq. 1 follow the formulation of Crocker and English (1997) and Savage (1999) and the last term is introduced to account for the effect of concentration.
Q k δTH = B H ν H g . (DH) Exp[C − conc ] (1)
Where Q is the heat flux (W/m2), k is the thermal conductivity of sea water (W/m/°C), δT is
the difference between the sea water temperature at the surface and the melting ice temperature (°C), H is the wave height (m), is the wave period (s), is the sea water kinematic viscosity (m2/s), g is gravitational acceleration (m/s2), D is the average ice floe
diameter (m), and conc is the average ice concentration as a decimal fraction. B and C are constants used to calibrate the overall wave enhanced heat flux based on field observations. The following dimensionless parameters are considered in the equation: Q k δTH⁄ is the dimensionless heat flux, H ⁄ is a wave Reynold’s number, H g⁄ is a wave steepness term, and D H⁄ is the ratio of ice piece length to wave height. The effect of sea ice concentration on wave-enhanced heat flux is accounted for by the exponential term. At a concentration of 10/10th (full ice cover with no open water) conc = and the exponential
term equals 1. As concentration decreases the exponential term will increase, effectively increasing the overall wave enhanced heat flux.
The total volume loss of an ice floe due to wave enhanced heat flux then follows thermodynamic principles for rate of heat transfer, as shown in Eq. 2.
δV = − Q
iΓ δt (2)
Where δV is the total volume loss (m3) for a given time step,
i is the density of sea ice
(kg/m3), Γ is the latent heat of fusion of ice (J/kg), and δt is the time step (s).
There is very little information regarding the ratio of lateral melt to vertical melt. Steel’s (1992) analysis dealt with different floe size and different conditions, but is the only source to guide us. We employ a linear relationship to reflect that the ratio �, decreases with increasing � ℎ⁄ , as reported by Steele. The ratio of lateral melt to total melt of an individual ice floe is presented in Eq. 3.
r = k − k Dh (3) Where r is the ratio of lateral melt to total melt, h is the ice thickness (m), and k and k are constants used for calibration. The volume loss due to side melt and vertical melt (m3) can
then be calculated using Eq. 4 and Eq. 5, respectively.
δVs = rδV (4)
δV = − r δV (5)
Assuming circular ice floes, the change in floe diameter (m) and ice thickness (m) are calculated using Eq. 6 and Eq. 7, respectively.
δD = δVs
hD (6)
δh = δVD (7)
For a collection of circular ice floes the ice concentration will be proportional to the floe diameter squared. A proportionality factor, α, is defined by Eq. 8.
α =concD (8)
Taking the derivative of the proportionality factor, α, allows us to solve for the change in concentration due to side melt as a function of the change in diameter. This is shown by Eq. 9.
δconc = αDδD (9)
It should be noted that this formulation for ice deterioration does not account for sea ice deterioration due to thermodynamics or other heat fluxes (e.g. Semtner, 1984).
OBSERVED ICE DETERIORATION EVENT
A severe and sustained storm on the Grand Banks in the spring of 2017 provided ideal conditions for assessment of the effect of extreme waves on ice deterioration. During the storm pack ice was forecasted to drift southeast, in direct proximity of offshore oil and gas fields. The presence of sea ice near offshore oil fields is of great concern to operators as it can impede operations and prevent the safe deployment of lifeboats. To ensure the safety of
persons onboard, it may be necessary to curtail or even fully shut-in production. In contrast to the forecasted southeast drift, the offshore pack ice was observed to rescind westward away from the oil fields. It is suspected that high sea states reported during the storm resulted in significant deterioration of the ice regime.
A 24 hour period from April 1 to April 2, 2017 is used as a test case. The two daily ice charts issued by the Canadian Ice Services (CIS) for these dates show a dramatic deterioration of the ice over the Grand Banks. The ice concentration maps for April 1 and April 2 are provided in Figure 1 and Figure 2, respectively. The spatial variation in ice concentration from St. John’s harbour (0 km) along a straight path 400 km east-southeast over the Grand Banks, as depicted by the white dashed line in the concentration maps, is plotted in Figure 3. Over the course of 24 hours the leading ice edge rescinded roughly 125 km towards shore and the average concentration decreased from as high as 9/10th to as low as 2/10th.
Figure 2: Ice concentration distribution (CIS ice chart), 2 April 2017 at 2:30PM NST
Figure 3: Spatial variation in ice concentration from St. John’s harbour east-southeast over the Grand Banks on April 1 and 2, 2017 at 2:30PM NST
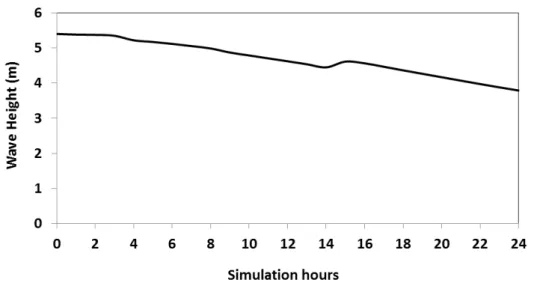
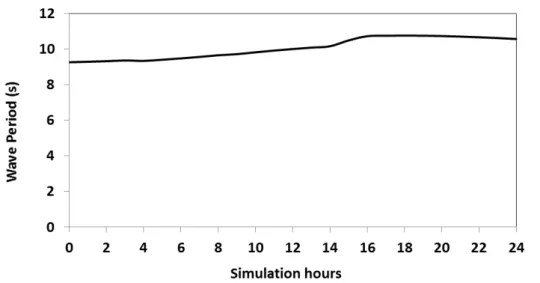
Sea state conditions over the 24 hour period were obtained from ERA5 reanalysis datasets through the European Centre for Medium-Range Weather Forecasts (ECMWF), generated using Copernicus Climate Change Service Information (2017). Figure 4 presents the wave height distribution over the Grand Banks on 1 April 2017 at 2:30PM NST along with a 200 km radius circle which has been used for analysis of the temporal variation in wave properties and sea surface temperature over the 24 hour simulation period. The corresponding time series for wave height, wave period, and sea surface temperature, averaged over the 200 km radius circle, are presented in Figure 5 to Figure 7, respectively. Average wave height decreased from 5.4 m to 3.8 m while average wave period grew slightly over the 24 hour period, increasing from 9.3 s to 10.6 s. Average sea surface temperatures decreased
from -0.7 °C to -1.0 °C after 3 hours and then remained constant.
Figure 4: Wave height distribution, 1 April 2017 at 2:30PM NST, with a 200 km radius circle used for analysis of temporal variation in wave properties and sea surface temperature
Figure 5: Average wave height on the Grand Banks over the 24 hour period starting 1 April 2017 at 2:30PM NST
Figure 6: Average wave period on the Grand Banks over the 24 hour period starting 1 April 2017 at 2:30PM NST
Figure 7: Average sea surface temperature on the Grand Banks over the 24 hour period starting 1 April 2017 at 2:30PM NST
ICE DYNAMICS SIMULATIONS
A hindcast of ice conditions during the observed deterioration event was done using an ice dynamics model. Simulations covering the Grand Banks and northeast coast of Newfoundland were done for a 24 hour period starting on 1 April 2017 at 2:30PM NST. Ice cover conditions were initialized using the CIS digital daily ice chart. Wind velocities were obtained from Environment Canada’s Canadian Meteorological Centre (CMC). Surface water current velocities were provided by the Bedford Institute of Oceanography – Department of Fisheries and Oceans Canadian East Coast Ocean Model (CECOM). The initial case presented here did not account for any wave action.
The resulting ice concentration distribution after 24 hours is presented in Figure 8. It can be seen that the leading edge of the ice pack drifts further offshore. When compared against the observed ice conditions, as reported in the CIS ice chart for 2 April 2017 (Figure 2), in the absence of input wave action the hindcast ice edge extended significantly further from the coast by roughly 190 km in a south-southeast direction. This preliminary simulation
suggested that extreme waves observed during this period may have significant influence on the evolution of ice conditions over the Grand Banks.
Figure 8: Ice concentration distribution after 24 hours when no wave action is modelled, 2 April 2017 at 2:30PM NST
The Role of Extreme Wave Effects
The preceding results did not account for any wave action or associated ice deterioration. To illustrate the role of ice deterioration due to wave action another case is presented here where ice deterioration was considered in the ice dynamics model. The following results employed empirical formulations for ice deterioration due to wave action. Wave height, wave period, and sea surface temperature were provided by ECMWF (Copernicus Climate Change Service Information, 2017), as detailed in the previous section. That approach appeared to give results that align with observations reported through regional ice charts, specifically the deterioration of the eastern extent of the pack ice.
Tests were done to examine the sensitivity of the results to wave properties and sea surface temperature. We present here in detail a case accounting for ice deterioration due to extreme wave action on the Grand Banks. The coefficients for the ice deterioration equations were calibrated based on analysis of the observed deterioration event. The coefficients in Eq. 1 are defined as B = 0.12, C = 0.5, and the coefficients in Eq. 3 are defined as k1= 0.1, and
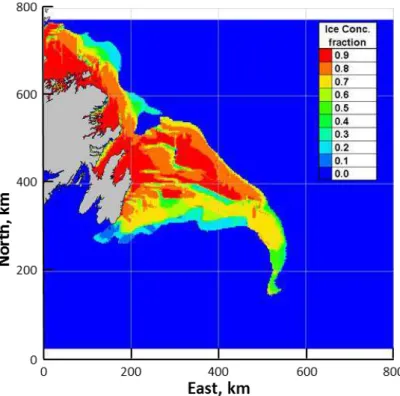
k2= -0.0001. Figure 9 to Figure 11 show the resulting distributions of ice concentration, ice
thickness, and floe diameter, respectively, on 2 April 2017 at 2:30PM NST after 24 hours of simulation.
Comparing the ice concentration distribution in Figure 9 against the CIS ice chart for 1 April 2017 (Figure 1) shows that after 24 hours of simulation the leading ice edge has retreated 150 km in a northwest direction toward the coast line. This represents significant deterioration of the eastern extent of the ice pack and aligns with observed ice conditions reported in the CIS ice chart for 2 April 2017 (Figure 2).
Deterioration of the eastern extent of the ice pack due to the wave action has been captured by the hindcast. However the input waves do not effectively deteriorate ice in the interior of the ice pack where ice concentration values remain relatively high. Referring to Figure 2, the observed ice concentration values on 2 April 2017 were primarily 2/10th coverage, with the
exception of some high concentration areas closer to shore. The simulation results in Figure 9 show high concentration values throughout the ice pack ranging from 5/10th near the ice edge and increasing to 9/10th closer to shore.
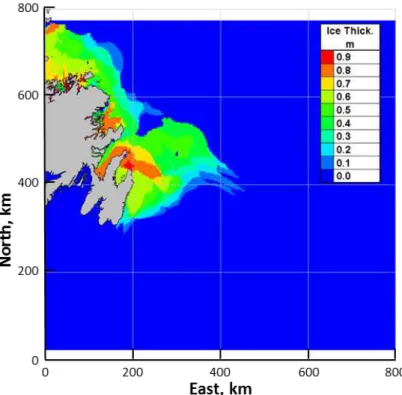
Similar results can be seen in the modelled ice thickness and floe diameter distributions (Figure 10 and Figure 11, respectively). There is significant deterioration of the eastern extent of the pack ice but there is some misalignment between the forecasted values and those reported in the CIS ice chart for 2 April 2017. Figure 10 shows ice thickness values ranging from <0.1 m near the ice edge to 1 m closer to shore and Figure 11 shows ice floe diameters of 10 m near the ice edge and 100 m closer to shore. The CIS ice chart for 2 April 2017 reports ice thickness values ranging from 0.3 to 1.2 m and floe diameters between 2 m and 500 m.
The discrepancy in ice conditions, particularly near shore, is evidently a result of decreases in wave height and wave period closer to shore. Further investigation including analysis of additional deterioration event test cases, different geographical regions, and refinement of the coefficients of the ice deterioration algorithms is necessary.
Figure 9: Ice concentration distribution after 24 hours of simulation, 2 April 2017 at 2:30PM NST
Figure 10: Ice thickness distribution after 24 hours of simulation, 2 April 2017 at 2:30PM NST
Figure 11: Floe diameter distribution after 24 hours of simulation, 2 April 2017 at 2:30PM NST
CONCLUSIONS
the Commanding Officer of the CCGS icebreaker Henry Larsen, who has extensive experience navigating and assisting vessels in ice on the East Coast of Canada and in the Eastern Arctic. These first hand observations emphasize the impact that waves in ice have on vessel operations and the need to incorporate deterioration due to wave action in sea dynamics models.
On 1 April 2017 a severe spring storm on the Grand Banks, offshore Newfoundland, resulted in significant deterioration of the ice pack and provided an ideal test case for analysis of the effects of extreme waves on ice deterioration. An empirical formulation for the deterioration of sea ice due to wave action was introduced and incorporated into an existing high-resolution sea ice dynamics model. Model simulation results gave ice extent and ice conditions over the Grand Banks during the 24 hour analysis period. Results show that deterioration of pack ice under extreme wave action can be accurately modelled. The extent of the ice edge was effectively captured. Ice concentration was higher than observations, evidently due to the input wave heights. Analysis of additional test cases including different geographical regions is needed to enhance confidence in the predictions.
The results show that proper modelling of deterioration due to wave action is required for accurate prediction of the evolution of ice conditions during severe storms. Field observations and ice dynamics modelling show that wave action can result in significant transformation of coastal ice regimes.
ACKNOWLEDGEMENT
The authors would like to acknowledge the National Research Council Canada – Ocean, Coastal, and River Engineer Research Centre for funding this study.
REFERENCES
Crocker, G. & English, G., 1997. Verification and implementation of a methodology for predicting bergy bit and growler populations. Contract report prepared for Ice Services, Environment Canada, C-Core Contract 97 – C13, 46 pp.
Kubat, I., Watson, D., & Sayed M., 2016. Ice Compression Risks to Shipping over Canadian Arctic and Sub-Arctic Zones. Arctic Technology Conference, St. John’s, NL, Canada, ATC 2016
Savage, S. B., 1999. State of the art review: Prediction of iceberg deterioration and drift. Report prepared for Canadian Ice Service, Environment Canada, Contract KM149-8-S028/001/SS
Steele, M., 1992. Sea ice melting and floe geometry in a simple ice-ocean model. Journal of
Geophysical Research, 97(17), pp.729-738
Semtner, A. J., 1984. On modelling the seasonal thermodynamic cycle of sea ice in studies of climatic change. Climatic Change, 6, pp.27-37
Wadhams, P. & Squire, V.A., 1980. Field experiments on wave-ice interaction in the Bering Sea and Greenland waters, 1979. Polar Record, 20(125), pp.147-158