ÉNERGIE ET INNOVATION : RECHERCHE / ÉTUDE & SYNTHÈSE
Nº 121
IFP SCHOOL - IFPEN JUIN • 2018
LES CAHIERS DE
L’ÉCONOMIE
P O L I C Y M E A S U R E S
T A R G E T I N G A M O R E
I N T E G R A T E D G A S
M A R K E T
RECHERCHE
Based on a French case study, this article
answers the question whether a merger of
gas trading zones contributes to the
devel-opment of liquid trading activities through
a more efficient allocation and pricing of
natural gas and an increased competition
Ekaterina Dukhanina
Olivier Massol
La collection “Les Cahiers de l’Économie” a pour objectif de présenter les travaux réalisés à IFP Energies nouvelles et IFP School qui traitent d’économie, de finance ou de gestion de la transition énergétique. La forme et le fond peuvent encore être provisoires, notamment pour susciter des échanges de points de vue sur les sujets abordés. Les opinions exprimées dans cette collection appartiennent à leurs auteurs et ne reflètent pas nécessairement le point de vue d’IFP Energies nouvelles ou d’IFP School. Ni ces institutions ni les auteurs n’acceptent une quelconque responsabilité pour les pertes ou dommages éventuellement subis suite à l’utilisation ou à la confiance accordée au contenu de ces publications.
Pour toute information sur le contenu, contacter directement l’auteur.
The collection “Les Cahiers de l’Économie” aims to present work carried out at IFP Energies nouvelles and IFP School dealing with economics, finance or energy transition management . The form and content may still be provisional, in particular to encourage an exchange of views on the subjects covered. The opinions expressed in this collection are those of the authors and do not necessarily reflect the views of IFP Energies nouvelles or IFP School. Neither these institutions nor the authors accept any liability for loss or damage incurred as a result of the use of or reliance on the content of these publications.
For any information on the content, please contact the author directly.
Pour toute information complémentaire For any additional information
Victor Court
IFP School
Centre Economie et Management de l’Energie Energy Economics and Management Center
victor.court@ifpen.fr Tél +33 1 47 52 73 17
Policy measures targeting a more integrated gas
market: Impact of a merger of two trading zones on
prices and arbitrage activity in France
☆Ekaterina DUKHANINA a,* Olivier MASSOL b,c,d François LÉVÊQUE a
Abstract
Under way to a European integrated energy market, policymakers need to find efficient measures aimed at increasing liquidity in local natural gas markets. The paper answers the question whether a merger of gas trading zones contributes to the development of liquid trading activities through a more efficient allocation and pricing of natural gas and an increased competition between market players. We analyse the effects of a policy decision to merge two gas trading zones in France on the observed degree of spatial market integration and the efficiency of the spatial arbitrage activity between the northern and southern French gas markets. An extended parity bounds model confirms a positive impact of the zone merger on the market’s spatial equilibrium and indicates the causes of remaining market inefficiencies. The model offers a tool for the assessment of the efficiency of policy decisions in the context of policy initiatives to create an integrated and liquid natural gas market in Europe.
Keywords: Natural gas; Market integration; Spatial equilibrium; Merger of market zones.
__________________________________
☆ We are grateful to two anonymous referees and to Yannick Le Pen, Florian Perrotton and Arthur Thomas for
several suggestions that helped us to substantially improve the paper. In addition, we thank conference participants at ISEFI 2018 (Paris, 24 May 2018) for useful discussions. Of course, any remaining errors are ours. This research has been supported by the Chair “The Economics of Natural Gas”. The views expressed herein are strictly those of the authors and should not be construed to reflect the opinions of IFP Énergies Nouvelles.
a CERNA, Mines ParisTech, 60 bd. Saint-Michel, F-75272 Paris Cedex 06, France. b IFP Énergies Nouvelles, 1-4 av. de Bois Préau, F-92852 Rueil-Malmaison, France.
c Center for Energy Economics and Management, IFP School, 228-232 av. Napoléon Bonaparte, F-92852 Rueil-Malmaison, France.
d Department of Economics, City, University of London, Northampton Square, London EC1V 0HB, UK. * Corresponding author. E-mail address: ekaterina.dukhanina@mines-paristech.fr
2
1. Introduction
In Europe, fostering the integration of the interior market is a major public policy objective that underlies the institutional reforms that completely restructured the natural gas sector. An important element of these reforms has been the definition of the zonal balancing mechanisms retained for gas pipeline systems. That, together with the adoption of the entry-exit pipeline tariff system, prompted the emergence of a collection of regional spot markets for natural gas (Miriello and Polo, 2015). By design, these so-called “gas hubs” are aimed at intensifying the competition among gas market participants and at generating an efficient allocation and pricing of natural gas within each entry-exit zone (ACER and CEER, 2017). As the hubs are interconnected throughout the pipeline system, they also enable spatial arbitrage between them. The development of liquid trading activities both at each hub and between these hubs is thus key to supporting the desired integration of the EU internal gas market.
However, the degree of trading maturity attained at some of these spot markets remains desperately low (Heather and Petrovich, 2017) and there are doubts about whether the observed lack of liquidity can be corrected without structural reforms (ACER and CEER, 2015). To circumvent this problem, European regulators are currently favouring the merger of adjacent illiquid trading zones to create a broader, and possibly transnational, regional market area (CEER, 2011; ACER and CEER 2015). It is expected that the price formed in that larger market will reflect the processed information of a larger number of market participants and will, in turn, encourage the development of competitive spatial arbitrage activities with other adjacent hubs. The fundamental public policy question examined in this paper is therefore: “Is the regulator’s conjecture about the positive effects of zone mergers on spatial integration valid or not?”
To investigate this question, we consider the case of the trading zone merger implemented in 2015 between France’s two southern gas markets and examine how that merger affected the trade of natural gas between the northern and the southern parts of the country.
3
After a preliminary analysis of the time series properties of the northern and southern spot gas prices, we apply a new empirical methodology in order to assess the impact of the policy decision to merge trading zones on the spatial arbitrage activity performed between the northern and southern gas markets in France and to evaluate the degree of market integration. This methodology, which is consistent with the theory of spatial equilibrium (Enke, 1951; Samuelson, 1952; Takayama and Judge, 1964, 1971), suggests that the market integration can be time-varying: we can observe (i) perfectly integrated equilibrium periods, meaning the spatial price spread corresponds to the transaction costs, so that there is no profitable arbitrage opportunities because the arbitrage rent is zero; (ii) imperfectly integrated equilibrium or barriers to trade, when the price spread is higher than the transaction costs, which indicates unexploited arbitrage opportunities due to a positive arbitrage rent; and (iii) autarky periods, during which the transaction costs exceed the spatial price difference, forming a negative arbitrage rent. In the latter case no trading flows should be observed in equilibrium. The goal of the analysis is to estimate the probabilities of observing a particular market state before and after the policy implementation.
For that purpose, we follow Massol and Banal-Estañol (2018) and propose an adapted Parity Bounds Model (PBM) aimed at estimating the transaction costs with the help of non-price data (i.e. transportation tariffs, volumes and capacity data). We extend their model so as to be able to assess the efficiency of the policy measure, following Negassa and Myers (2007). The specification developed in our paper allows us to figure out how the market spatial equilibrium changes after the zone merger and conclude about the degree of market integration before and after the policy measure.
Besides the assessment of the policy efficiency, in this paper we address several questions. Firstly, we evaluate how well the French northern and southern spot gas markets are linked to each other, which has not been done in the academic literature. Moreover, while testing for market spatial efficiency, the methodology enables us to detect periods of inefficiency in the market and indicates its causes. In addition, we estimate the intermarket transaction costs, determine the unobservable part of
4
arbitrage costs and test the hypothesis of the competitive nature of the arbitrage activity between these two markets.
To sum up, this work contributes to the literature on market integration in several ways. First, it assesses the efficiency of the policy decision to merge two French southern trading zones, which has not been evaluated yet. Second, we apply a theory-based methodology and specify additional regimes of equilibrium, compared to the classical model specification (Sexton et al., 1991). Third, we include in our analysis non-price variables such as transportation tariffs, volumes and capacity constraints. There has been limited use of such variables in previous research. Fourth, we test the model for the competitive nature of arbitrage activity.
The paper is organised as follows. In section 2, we briefly review the empirical challenges faced when assessing the degree of market integration and provide a condensed presentation of the intellectual connection between the theory of spatial equilibrium and the specification of a PBM model. The third section presents our methodology applied to the North-South arbitrage activity. Section 4 provides an overview of the institutional organisation of the natural gas markets in France and then describes the data and some preliminary analyses. Section 5 presents our empirical results. The last section concludes.
2. Market integration: Definition and assessment
The section first provides a condensed review of the challenges faced when attempting to empirically assess the degree of spatial integration between two natural gas markets. It then presents the theoretical background of our empirical analysis.
2.1. Empirical challenges
An early definition of an integrated market is given by Cournot (1838) who points out that prices should be equal within the market. Marshall (1890) extends the notion by allowing the local price at
5
two distinct locations to differ, provided the spatial price spread equals the intermarket transportation costs. This is the so-called “law of one price”.
In a recent survey of the empirical methodologies1 examining the degree of spatial integration
among a collection of natural gas markets, Dukhanina and Massol (2018) discuss the challenges that emerge when attempting to operationalise this seemingly simple theoretical definition. For example, they note that information about the various components that constitute the arbitrage costs incurred by market participants is seldom available to modellers. Another problem is related to the fact that, in some cases, trade can be hampered by the presence of congested infrastructures. Indeed, pipeline capacity constraints can limit intermarket trade and thus moderate the level of market integration for some observations. As transported flows exhibit substantial variations across time, congestion is also likely to be time-varying, which calls for adapted empirical representations. Finally, they note that, with few exceptions (e.g. Cuddington and Wang, 2006), most of the existing contributions apply time series specifications that are only loosely connected to the microeconomics of spatial arbitrage. 2.2. The theory of spatial equilibrium
To clarify the microeconomics, one can refer to the theory of spatial market equilibrium first developed by Enke (1951), Samuelson (1952) and Takayama and Judge (1964, 1971). That theory indicates that the relations between local equilibrium prices can be deduced from the first-order condition for the optimality of a perfectly competitive arbitrager’s profit-maximisation problem. If one examines the direction-specific arbitrage that can be performed from market j to market i at time t and let and respectively denote the intermarket marginal transaction costs and the
1 The list includes: (i) the early correlation assessment of Doane and Spulber (1994); (ii) the application of either
cointegration techniques (e.g. De Vany and Walls, 1993; Walls, 1994; Serletis, 1997, Asche et al., 2001; 2002; 2013; Siliverstovs et al., 2005) or Granger causality test in Vector Error Correction Models (e.g. Nick and Thoenes, 2014; Bachmeier and Griffin, 2006; Park et al., 2008; Brown and Yücel, 2008; 2009; Olsen et al., 2015; Growitsch et al., 2015); (iii) the application of the Kalman filter (King and Cuc, 1996; Neumann et al., 2006; Neumann, 2009; Renou-Maissant, 2012; Neumann and Cullmann, 2012, Mu and Ye, 2018); (iv) price convergence estimations (Li et al., 2014, Mu and Ye, 2018) or (v) an auto-regressive modelling of the price differentials (Cuddington and Wang, 2006).
6
intermarket flow then the equilibrium prices and must verify the following complementarity condition:
0 ≤ , − − ≤ 0 and − − = 0 (1)
This condition indicates that if the spatial price spread is less than the transaction costs, the two markets are spatially segmented, i.e. there is no trade flow between these markets ( = 0) and the arbitrage rent is negative − − < 0. The markets are linked by spatial arbitrage (i.e. ≥ 0) when the arbitrage condition is binding, which indicates that the price spread equals the intermarket transaction costs, which corresponds to zero arbitrage rent. Indeed, if the price spread exceeds the transaction costs it creates arbitrage opportunities which are immediately exploited by traders. Thus, the arbitrage activity narrows the price spread, bringing the arbitrage rent to zero.
In agricultural economics, the empirical works of Sexton et al. (1991) and Barrett and Li (2002) develop the Parity Bounds Model (PBM), a switching regression specification that is consistent with the theory of spatial equilibrium. For example, Sexton et al. (1991) consider a typology of three possible trade regimes. The “efficient arbitrage” regime is such that the observed spatial price spread equals the intermarket transaction costs. The “barrier to trade” regime reveals the presence of unexploited profitable arbitrage opportunities because the spatial price spread is larger than the transaction costs. Lastly, the “relative glut” regime is such that the price formed at the destination market is depressed below the sum of the price at the origin market and the transaction costs.
Massol and Banal-Estañol (2018) show how that modelling framework can be adapted to investigate the integration of natural gas markets. They underline that there is a need to account for the specific role of pipeline capacity constraint, as observing a “barrier to trade” does not have the same implications depending on whether the interconnection infrastructure is congested or not. In the former case, the theory of spatial equilibrium stipulates that pipeline congestion can result in the observation of large spatial price spreads. In contrast, if the infrastructure is not congested, observing the presence of both unexploited profitable arbitrage opportunities and spare pipeline capacity is not
7
consistent with that theory. They thus propose further decomposing the “barrier to trade” regime by dividing it in two, depending on whether the infrastructure capacity constraint is binding or not.
However, in their model the probabilities of observing a particular regime of trade are supposed to be time-invariant. With the development of natural gas markets, supported by regulatory reforms, it is possible to see these probabilities evolving with time. Negassa and Myers (2007) allow for dynamic shifts in regime probabilities. Their specification enables evaluation of effects of policy measures and allows estimation of the length of the adjustment period.
In our paper we extend the model of Massol and Banal-Estañol (2018) by introducing policy dummy variables, following Negassa and Myers (2007), in order to analyse the change in the degree of the market integration before and after the merger of trading zones in France, which enables us to ascertain the efficiency of the policy.
Summing up, in this paper we build a parity bounds model with four regimes. We estimate the arbitrage costs with the help of traded volumes and transmission tariffs data, allowing the transaction costs to vary over time. We introduce policy variables in order to shed light on the effects of the zone merger. To the best of our knowledge we are the first to upgrade a parity bounds model with policy dummies, applying it to the natural gas markets. In addition, we test the assumption of a competitive arbitrage for the North-South trading activity.
3. Methodology
In this section, we present the methodology used in our empirical investigations. We first define an adapted typology of four distinct trade regimes and explain how the probability of observing each of them can be estimated using a switching regression framework. We then show how this parity bounds model can be extended to allow shifts in the estimated coefficients following the zone merger.
We let denote the unit intermarket transaction costs incurred when performing a spatial arbitrage aimed at transporting natural gas from market j to market i at time t. These unit costs include
8
both observable (e.g. the tariffs charged by the TSO for the intermarket pipeline infrastructure) and non-observable components. Following Sexton et al. (1991), we posit that these transaction costs can be modelled as follows:
= + + + , (2) where is the observable tariff charged for the pipeline interconnection, and are unknown coefficients to be estimated, is a vector of exogenous variables and is a random error that accounts for all non-observable shocks. The error is assumed to be i.i.d. normally distributed with a zero mean and a standard deviation . Hence, the unobservable portion of the unit transaction costs
is: + + .
Let and be the wholesale market price for natural gas and ∆ ≔ − denote the price spread between the two markets. We now model the relations between the price spread and the unit transaction costs using a switching regression model that considers the following typology of four mutually exclusive trade regimes.
In Regime I, the price spread is said to be “at the parity bounds”. The expected value of the spatial arbitrage condition binds and the spread equals the unit transaction costs:
∆ = + + + . (3)
By construction, Regime I is consistent with the conditions for the profit maximisation of a spatial arbitrageur.
In Regime II, the spatial price difference is below the unit transaction cost and hence “inside the parity bounds”:
∆ = + + + − , (4)
where is an error term drawn from a zero-centered normal distribution truncated below at 0 with a standard deviation . By construction, measures a deviation from arbitrage equilibrium and
9
indicates the amount to which the prices fall short of the parity bounds. In this regime, there is no profitable arbitrage and the markets are not integrated. The regime is efficient if there is no trade – this is the autarky situation – and inefficient if positive trade flows are observed from market j to i.
Sexton et al. (1991) and Negassa and Myers (2007) also consider a third regime to model the case of a spatial price spread which is “outside the parity bounds” (i.e. above the unit transaction costs). In a recent application to interconnected natural gas markets, Massol and Banal-Estañol (2018) underline that this regime should be further decomposed according to another characterising element: the possible presence of bottlenecks along the infrastructure connecting the two markets. They show that observing a spatial price differential above the unit transaction costs is consistent with the logic of spatial equilibrium theory if the pipeline capacity constraint is binding. In contrast, if there is spare capacity in that infrastructure, observing a spatial price spread “outside the parity bounds” implies the existence of unexploited arbitrage rents that can be due to a lack of information, barriers to entry or market power. We hereafter retain that distinction and introduce a dedicated dummy variable ! that
takes the value 1 whenever pipeline congestion is observed and 0 elsewhere.
In Regime III, the price spread is above the unit transaction costs and hence “outside the parity bounds” and there is spare capacity in the pipeline infrastructure (i.e. !=0):
∆ = + + + + , (5) where the error term measures by how much the price difference exceeds the unit transaction costs and thus the effects of the barriers to trade that are not generated by infrastructure bottlenecks.2
In Regime IV, the price spread is also above the unit transaction costs but the pipeline infrastructure is congested (i.e. !=1):
2 We follow Sexton et al. (1991) and Negassa and Myers (2007) and assume that the error terms in regimes II
and III have the same distribution. In the application discussed below, we relax that assumption to allow possibly different standard deviation coefficients for these two regimes and conduct a likelihood ratio test for the null hypothesis of an identical parameter value for the two regimes. As that hypothesis was not rejected at the 10% significance level, we decided to maintain the assumption of the same distribution for error terms in regimes II and III.
10
∆ = + + + + " , (6) where the error term " is a positively valued shock drawn from a zero-centered normal distribution truncated below at 0 with standard deviation #. By construction, " measures the congestion charge, that is, the price of capacity (in excess of the unit transaction cost), which is positive when the demand for pipeline transportation services exceeds supply (i.e. the infrastructure capacity offered to shippers).
For notational simplicity, we let: $ : = ∆ − − − denote the marginal profit from spatial arbitrage at time t, & = (&(, &((, &(((, &(*) denote the vector of the probabilities of observing the four regimes and , = ( , , , , , #) denote the other parameter vector to be estimated. As regime probabilities sum to one, we have &(* = 1 − &(− &((− &(((.
The joint density function for $ over all trading regimes is the mixture distribution: ($ |&, ,) = &( (($ |,) + &(( ((($ |,) + (1 − !)&((( (((($ |,)
+ !/1 − &(− &((− &(((0 (*($ |,). (7)
where the distribution functions for the observations are as follows: ( is the density function of a normal random variable and ((, ((( and (* are the density functions for the sum of a symmetric normal random variable and a truncated normal random variable. The latter distribution was first derived by Weinstein (1964) and is also detailed in Sexton et al. (1991).
The likelihood function for a sample of 1 observations is: 2(&, ,) = ∏4 / ($ |&, ,)0
56 . (8)
The model parameters – namely the transaction costs parameters, the standard deviations and the regime probabilities – can be estimated by maximising the logarithm of this likelihood function subject to the constraints that the regime probabilities lie in the unit interval and that the standard deviation parameters are positive.
11
In that PBM, regime probabilities and distributional parameters are posited to remain time-invariant during the full estimation period. However, we follow the methodology first introduced by Park et al. (2002) and Negassa and Myers (2007) in agricultural economics and relax that assumption by allowing possible dynamic shifts in these coefficients in response to an exogenous regulatory intervention. Concretely, we let denote the date on which the full effects of the new regulatory policy are realised and define the dummy variable 7 that takes a value of 0 for all observations
8 < and 1 otherwise. We use it to allow possible shifts in both the vector of regime probabilities and the distribution parameters:
& = (1 − 7)&97+ 7&:7, (9)
= (1 − 7) 97+ 7 :7, (10)
= (1 − 7) 97+ 7 :7, (11)
# = (1 − 7) #97+ 7 #:7. (12)
where the superscripts < and ≥ respectively denote the coefficients for the period before and after the policy implementation. The specification of the extended PBM is then obtained by inserting these time-varying parameters in (8). The extended model can then be estimated by maximising that enriched log-likelihood function subject to the constraints that all regime probabilities lie in the unit interval and that the standard deviation parameters are positive.
The original PBM is a restricted version of the specification used for the extended PBM. Therefore, likelihood ratio (LR) tests make it possible to test for the absence of structural change in the regime probabilities and/or the distribution parameters.
One can wonder whether the arbitragers’ response to the policy change is immediate since there can be a delay between the official implementation date of that new policy and its effect. In the application discussed below, we successively allow to be any date from the first day of the policy change (which corresponds to an instantaneous adjustment) to the first day of the next month under
12
that new policy (which gives a one-month adjustment period). We estimate and compare these 31 models and select the date that provides the highest log-likelihood.
Lastly, it should be noted that these specifications do not account for the possible effects of serial correlation. As un-modelled serial correlation can result in inefficient estimates, we supplement them with a correction for the presence of first-order serial correlation in the error term. For concision, we detail that correction in Appendix A.
4. Application
The extended PBM is applied to the French natural gas market to examine the effects of the zone merger implemented in 2015. We begin with a condensed overview of the organisation of the French natural gas markets and then present the data and some preliminary analyses.
4.1. Background: The French gas market
The two European gas directives (see directives 1998/30 and 2003/55) prompted France to implement a series of reforms aimed at gradually liberalising the domestic gas sector. The most important ingredients of this restructuring include: the establishment of an independent regulator, the Commission de Régulation de l’Energie (CRE); a privatisation of the incumbent operator; the unbundling of its previously vertically integrated activities; the implementation of transparent and non-discriminatory third-party access to infrastructures; and a series of regulatory measures favouring the emergence of competitive wholesale and retail markets for natural gas. As a result, the pipeline transportation system is now operated by two regulated Transmission System Operators (TSOs), namely Gestionnaire de Réseau de Transport Gaz (GRTGaz), that operates the country’s largest system, and Teréga,3 a regional operator that controls the southwestern pipeline system.
13
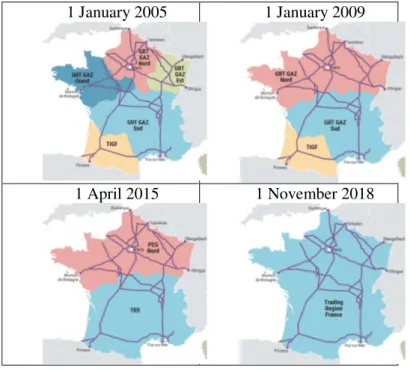
In 2005, the CRE compelled the TSOs to implement an entry-exit tariff system which imposes a contractual division of the territory into five balancing zones4 (see Figure 1). As the capacity of the
pipeline systems connecting the northern, western and eastern zones was deemed to be large enough, the regulator imposed a first zone merger in 2009. These three zones were regrouped into a single northern zone for which a unique balancing market named Point d’Échange de Gaz (PEG) Nord was created. Liquid trading rapidly emerged at PEG Nord. That zone accounts for about two-thirds of the country’s consumption and has a favourable (i.e. pro-competitive) endowment in infrastructures, as the zone is connected to the trunkline systems supplying gas produced in Norway, Benelux and Russia and also has two large import terminals for liquefied natural gas (LNG).
Figure 1. The geographic delineation of the gas balancing zones in France (Source: CRE)
1 January 2005 1 January 2009
1 April 2015 1 November 2018
The situation prevailing in the two southern markets – namely PEG Sud in the southern zone operated by GRT Gaz and TIGF in the southwest – was radically different and represented an important source of regulatory concern. During the years 2009–2014, market participants recurrently
4 For concision, we refer to David and Percebois (2004) for a comprehensive discussion on the entry-exit pricing
mechanisms and simply highlight here that an interconnection charge is applied whenever shippers demand a transport service that involves crossing the zone borders.
14
deplored both the high prices (compared with the ones at PEG Nord) and the low degree of liquidity at the two southern markets. Pipeline congestion was frequently observed in the infrastructures connecting the two zones with northern France5 thereby limiting the inflow of gas from north-west
Europe. Furthermore, these two southern markets have either little (Spain) or no (Switzerland, Italy) pipeline connection to adjacent countries and can only import LNG using a regasification terminal located in Fos-sur-Mer near Marseille.
In 2014, that situation convinced the regulator to authorise GRTGaz to invest in a new pipeline system aimed at better connecting its northern and southern infrastructures. As the completion of the new infrastructure was not expected before 2018, the CRE also considered an institutional fix that could deliver some short-term but tangible benefits to southern consumers: a merger of the two southern zones PEG South and TIGF. The merger occurred on 1 April 2015. Thereafter, southern France had only one wholesale market for natural gas: the newly created Trading Region South (TRS). That situation prevailed until November 2018 when the pipeline expansion project commissioned in 2015 was finally completed and the two remaining markets, PEG Nord and TRS, merged to form a single hub, named Trading Region France.
In the present paper, we conduct an “ex post” analysis of the situation that prevailed during the years 2011–2017 and empirically examine the effects of the 2015 southern zone merger on the observed level of spatial integration between the country’s northern and southern markets.
4.2. Data
We focus on the day-ahead prices for natural gas formed in France’s northern and southern wholesale markets: namely PEG Nord and PEG Sud (the latter market is named TRS after the zone merger implemented on 1 April 2015). We use the end-of-day price series reported by Powernext. The prices are denominated in euros per MWh. The price differential (also indifferently named price spread hereafter) is calculated as the price in the South minus that in the North.
15
We consider the period covering 1 July 2011 to 30 June 2017. Although the prices are available for earlier periods, market design considerations impose the use of that starting date as it corresponds to the implementation of the so-called “market coupling mechanism” – the congestion management procedures governing the allocation of interconnection capacities to network users for the North-South pipeline infrastructure. Prior to that date, the market rules, the definition of the transportation rights and, as a consequence the economics of the spatial arbitrage performed between these two markets, were noticeably different.
Regarding trade flow data, we use the daily commercial net flows on the North-South link reported by GRTGaz. The data is measured in TWh/day and, by convention, a positive value indicates that the gas is transported from the North to the South. During our sample period, that flow direction is clearly dominant as only two observations have negative flow figures. These two observations were dropped in the sequel.
The transmission tariff charged for the North-South link is set by the French regulatory agency. During our sample period it was revised twice, from €1.04 to €0.87 per MWh in the beginning and to €0.58 per MWh at the end of 2013.
Our whole sample period has a total of 2,188 observations and can be partitioned into two subperiods that respectively gather all the observations before (1,366 observations) and after (822 observations) the zone merger implemented on 1 April 2015.
For each observation, we also consider the daily infrastructure capacity for the North-South link – i.e. the maximum quantity of natural gas that can be transported during that day – communicated by GRTGaz to traders. We use it to evaluate the load rate (i.e. the ratio of the commercial net flows to the transportation capacity available that day). In the sequel, that ratio is used to determine the dummy congestion variable ! that takes the value one whenever the load rate hits 100% – which is the case for 519 observations – and zero elsewhere. The mean value of the load rate is 90% over the whole sample period.
16
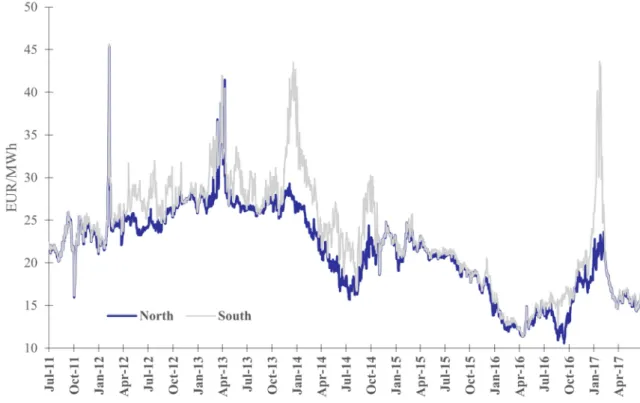
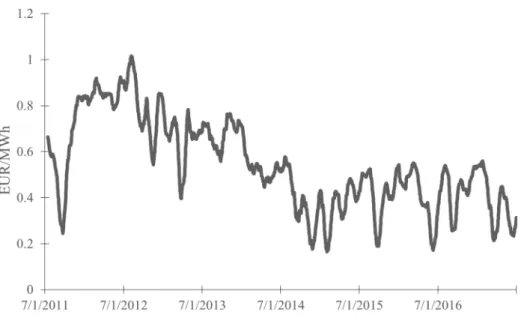
Figure 2 provides plots of the two price series in levels. A visual inspection of the price plots suggests that the prices in the two market areas share a common pattern and that both series do not exhibit a mean reverting behaviour. This point will be investigated more formally in the sequel. That said, the prices in the South are higher than the northern ones and they also exhibit a series of transitory peaks with greater amplitude. These visual remarks suggest that gas markets in the North and South were not perfectly aligned, at least during the years 2012–2014.
Figure 2. North and South gas prices, EUR/MWh (Source: Powernext)
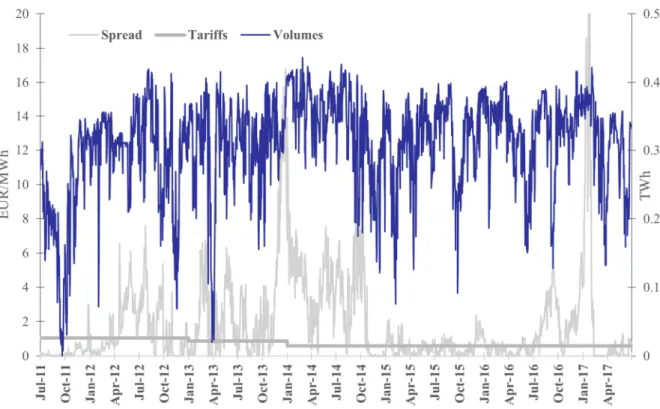
The plot of the South-North price spread is given in Figure 3. We note the presence of peaks during the heating season but not every year. Hence, one can wonder whether seasonality is a driving factor as the two markets are located in the same country and thus share similar seasonal patterns. The seasonal components of the two individual price series are thus likely to cancel out when considering the price spread series. Higher spreads are observed before 2015 and persist during the winter of 2013/2014. The short spike in January 2017 is due to insufficient LNG supply in the South of France coupled with congestion along the North-South link.
17
Figure 3. South/North spread (EUR/MWh), tariffs (EUR/MWh) and volumes (TWh, RHS). Source: Powernext, GRTgaz.
Table 1 summarises the descriptive statistics for our series. The mean, median, maximum and minimum statistics confirm that the southern prices are higher than the northern ones. The distributional properties of the North and South price series also differ as the southern price series exhibits larger standard deviation and kurtosis figures. For the sequel, one can keep in mind that the average spread is around €2.0 per MWh over the whole sample period.
Table 1. Descriptive statistics of the series. South/North/spread/tariffs in EUR/MWh, volumes in TWh.
Price
North South Price Spread Price Tariffs Volumes
Mean 21.39 23.26 1.88 0.74 0.31 Median 21.84 23.14 0.78 0.58 0.32 Maximum 45.40 45.70 21.65 1.04 0.44 Minimum 10.56 11.37 -0.98 0.58 0.00 Standard Deviation 4.96 6.03 2.69 0.20 0.07 Skewness -0.06 0.32 2.84 0.54 -1.20 Kurtosis 2.85 3.12 14.62 1.49 4.64
18
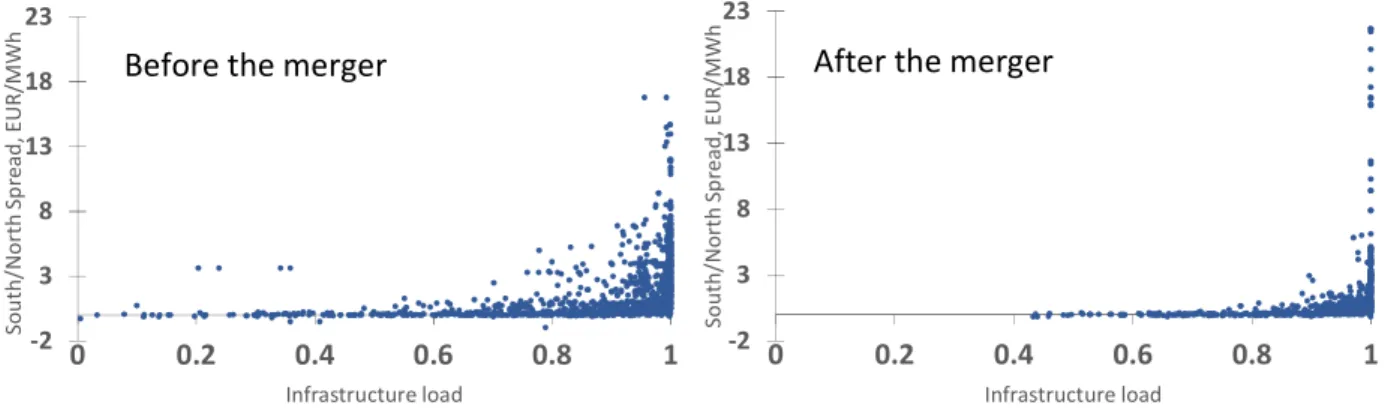
To graphically examine the relation between the observed price differential and infrastructure use, Figure 4 provides scatter plots of the price spread and the load rate before and after the zone merger. There is a stark visual difference between the two plots. Before the zone merger, numerous observations exhibit both the presence of spare pipeline capacity and a high price spread (i.e. higher than the sample average). The fact that there are no signs of congestion for these observations strongly questions the efficiency of the spatial arbitrage performed between the two markets. In contrast, after the zone merger, we notice that the price spreads observed in case of spare capacity are comparatively lower. One can also note that the load rates observed after the zone merger are higher, which can be interpreted as signs of an increased infrastructure use. Overall, these graphical observations call for further analyses aimed at exploring whether the magnitude of the spreads observed in the case of spare infrastructure capacity is commensurate with the intermarket transaction costs or not.
Figure 4. Scatter plots of the load rate (X axis) and the price spread (Y axis) before and after the zone merger.
4.3. Preliminary analyses a – Unit root tests
As a preliminary step in our econometric analysis, we check the data-generating properties of the series under investigation. Identifying a time series as stationary means that the shocks have no permanent effects as the series reverts to its mean after a shock. In contrast, a series is integrated if it has a unit root (i.e. a stochastic trend) which indicates that shocks have permanent effects. An
-2 3 8 13 18 23 0 0.2 0.4 0.6 0.8 1 S o u th /N o rt h S p re a d , E U R /M W h Infrastructure load Before the merger
-2 3 8 13 18 23 0 0.2 0.4 0.6 0.8 1 S o u th /N o rt h S p re a d , E U R /M W h Infrastructure load After the merger
19
integrated time series does not revert to its pre-shock level. The application of standard regression techniques to an integrated time series is known to generate misleading results.
To formally investigate these properties, we conduct four different unit root/stationarity tests. We first test for the presence of stationarity using the KPSS test of Kwiatkowski et al. (1992). After that, we evaluate two unit root test statistics, namely MZa and MZt proposed in Ng and Perron (2001), to examine whether the null hypothesis of a unit root can be rejected in favour of the alternative of either mean stationarity or trend stationarity. Lastly, as it is often argued that unit root tests have a low power to reject the unit root null in the presence of structural breaks, we also consider the LLS unit root test with a structural break proposed by Lanne, Lütkepohl and Saikkonen (2002).
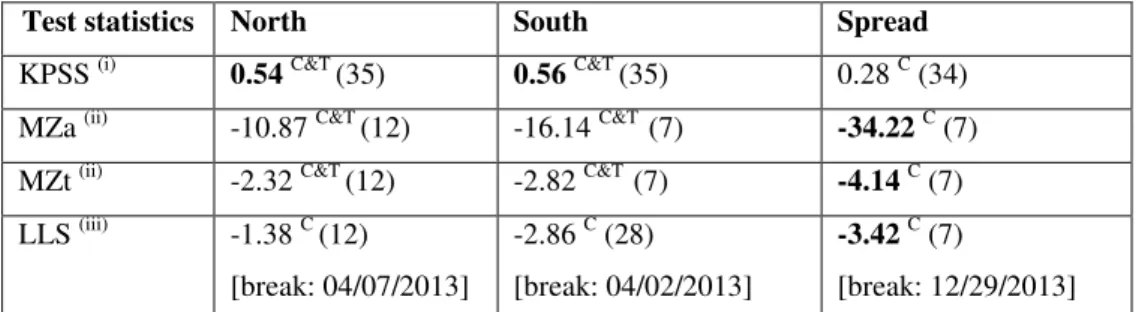
The test results are presented in Table 2. With the test size of 5%, both the KPSS and the unit root tests indicate that the two local price series can be described as non-stationary processes whereas the price spread is stationary (i.e. I(0)). This result suggests that there is an equilibrium (i.e. stationary) spread between these two prices which, following Cuddington and Wang (2006), can be interpreted as a positive sign for market integration between these two hubs.
Table 2. Unit root tests.
Test statistics North South Spread
KPSS (i) 0.54C&T (35) 0.56C&T (35) 0.28 C (34)
MZa (ii) -10.87 C&T (12) -16.14 C&T (7) -34.22C (7)
MZt (ii) -2.32 C&T (12) -2.82 C&T (7) -4.14C (7)
LLS (iii) -1.38 C (12) [break: 04/07/2013] -2.86 C (28) [break: 04/02/2013] -3.42C (7) [break: 12/29/2013]
Note: Number in bold indicates rejection of the null hypothesis at the 5% significance level. C and T indicate the inclusion
of a constant and a trend, respectively. We follow the general-to-specific approach that consists of first including a trend and a constant and successively dropping them whenever the estimated coefficients are not statistically significant at the 5% level. (i) KPSS is the Kwiatkowski–Phillips–Schmidt–Shin statistic for testing the null hypothesis that the series are
I(0). The number in parenthesis denotes the lags using the Newey–West bandwidth. The 5% crit. values are 0.146 (with trend) and 0.463 (with constant). (ii) MZa and MZt are the modified versions of the Phillips–Perron unit root test in Ng and
Perron (2001) with a lag length (in parenthesis) given by the modified AIC. The 5% crit. values for the MZa (respectively, MZt) test stat. are: with trend -17.3 (resp. -2.91), with constant -8.1 (resp. -1.98). (iii) LLS is the GLS-detrended modified
ADF test for the null of a unit root proposed by Lanne, Lütkepohl and Saikkonen (2002). The number in parenthesis is the optimal lag suggested by the Akaike Information Criterion. The test allows for a structural break in the form of a shift dummy at an unknown date (in brackets). The 5% crit. value is -2.88.
20
The LLS test indicates the presence of a structural break in April 2013 for the two price series and in December 2013 for the price spread. The former break points to a colder-than-anticipated spell of weather observed in North-West Europe during the first weeks of April 2013. Regarding the latter break for the price spread series, it corresponds to the very large peak observed in the South when power generation deficiencies required a larger-than-anticipated use of the southern gas-fired thermal generators (see Figure 5).
b – Granger causality
To gain insights on the interactions between the local price series, we thus perform pairwise Granger causality tests using a bivariate Vector Auto-Regression (VAR) model for the first-differenced price series.
Table 3. Pairwise Granger causality tests for the first-differenced price series.
Null hypothesis Full sample Before the zone merger
After the zone merger
Southern price variations do not Granger cause Northern ones
1.755 (0.105) 1.347 (0.233) 2.086 * (0.052)
Northern price variations do not Granger cause Southern ones
2.894 *** (0.008) 3.143 *** (0.005) 2.146 ** (0.046)
Note: This table reports the F-statistics for the null hypothesis of no Granger causality among the first-difference price series. The tests are conducted for the whole sample period and for the two subperiods delineated by the date at which the zone merger became effective (1 April 2015). Numbers in parentheses are p-values. Asterisks indicate rejection at 0.1*, 0.05** and 0.01*** levels, respectively. The lag length for the variables in the VAR model is six. This is the smallest lag length such that the residuals do not exhibit signs of un-modelled serial correlation.
The results are presented in Table 3. The test statistics obtained for the whole sample period indicate that northern price movements play a significant role in explaining variations in the southern price, but not vice versa. This conclusion is consistent with both the relative sizes of the two markets and the presence of interconnection capabilities connecting northern France with other North-West European markets, while the southern French market has limited interconnections. To gain insights into whether the zone merger has impacted these interactions, we also report the results obtained for the two subperiods that respectively include all the observations before and after the zone merger.
21
Before the merger, the high p-value of the test statistics indicates that previous southern price variations have little effect on the current northern price changes. In contrast, after the zone merger, the p-value is then very close to the usual 5% significance level, indicating that this null hypothesis is only mildly rejected. This finding suggests that two markets become more closely connected following the policy decision to merge the southern trading zones.
5. Empirical results
The extended parity bounds model described in section 3 is applied to the French gas markets to examine the implications of the 2015 zone merger. In this paper the unobservable portion of the intermarket transaction costs is estimated using constant and the daily volumes of natural gas transported from the North to the South (in TWh).
The estimation procedure involves the constrained maximisation of the log-likelihood function (8). That non-linear optimisation problem is solved numerically using a hill-climbing solution algorithm.6
As discussed in section 3, we first successively solve 31 instances of the optimisation problem defining our extended PBM specification – one for each possible date between 1 April and 1 May 2015 – to determine the optimal date . We find that the model with the highest Log-Likelihood (LL) value is obtained with = 2 April 2015 (LL=-3,536.61). This result suggests a very short delay of one day between the implementation of the policy and its full effects. Market participants thus quickly adjusted their behaviour to the new trading conditions created by the policy measure. We then perform a likelihood ratio (LR) test for the joint hypothesis of no change in both the regime probabilities and the distribution parameters (that is, H0: &97 = &:7, 97 = :7, 97= :7 and
#97= #:7). The chi-square test statistic and the associated p-value are reported in Table 4. We
6 Estimations were performed using STATA and an iterative hill-climbing procedure that performs 3 iterations
of the Newton-Raphson (NR) method, then switches to the Davidson-Fletcher-Powell (DFP) one for the next 17 iterations, then switches back to NR for 3 iterations, and so forth.
22
observe that these restrictions are firmly rejected by the data which reveals that the merger substantially affected the spatial arbitrage between the northern and southern markets. Hereafter, we consider the extended PBM with the shift date 2 April 2015 as our preferred specification.
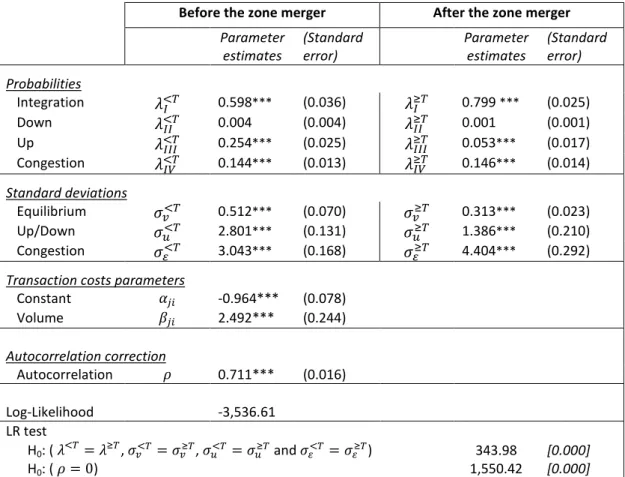
Table 4 reports the estimation results for that model. That table details the estimated regime probabilities for the periods before and after 2 April 2015; estimates of the parameters of the unobserved transaction costs and of the first-order autocorrelation parameter ;; and the estimated standard deviations for the different trade regimes. Before commenting on the estimates, we simply stress that the estimated autocorrelation parameter ; is highly statistically significant and that the result of the LR test for the null hypothesis (H0: ; = 0) clearly confirms a need to correct for the
presence of first-order serial correlation in this application.
Table 4. Estimation results for the extended PBM.
Before the zone merger After the zone merger Parameter estimates (Standard error) Parameter estimates (Standard error) Probabilities
Integration &97( 0.598*** (0.036) &(:7 0.799 *** (0.025) Down &97(( 0.004 (0.004) &((:7 0.001 (0.001) Up &97((( 0.254*** (0.025) &(((:7 0.053*** (0.017) Congestion &97(* 0.144*** (0.013) &(*:7 0.146*** (0.014)
Standard deviations
Equilibrium 97 0.512*** (0.070) :7 0.313*** (0.023) Up/Down 97 2.801*** (0.131) :7 1.386*** (0.210) Congestion #97 3.043*** (0.168) #:7 4.404*** (0.292)
Transaction costs parameters
Constant -0.964*** (0.078) Volume 2.492*** (0.244) Autocorrelation correction Autocorrelation ; 0.711*** (0.016) Log-Likelihood -3,536.61 LR test
H0: ( &97= &:7, 97= :7, 97= :7 and #97= #:7) 343.98 [0.000]
H0: ( ; = 0) 1,550.42 [0.000]
Note: Significance tests are based on asymptotic standard errors that have been computed using the Hessian matrix of the log-likelihood function. The standard errors are in parentheses. Asterisks indicate significance at 0.10*, 0.05** and 0.01***
23
From these estimation results, several findings can be highlighted regarding the regime probabilities. First, there are notable shifts in the estimated regime probabilities. Before the zone merger, the probability &97( of observing spatial integration, i.e. the market state with zero marginal
rent to spatial arbitrage, was about 60%. The probability of that regime is substantially higher once the policy is in place as &:7( attains nearly 80%. This finding indicates that the French markets
become more spatially integrated after the zone merger as we observe North-South spatial arbitrage opportunities exploited 80% of time.
Second, the probability to observe “barriers to trade” not generated by pipeline congestion (i.e. Regime III) drops drastically from 25% to 5%. That clearly reveals an improvement in the spatial efficiency of the market. This result documents the fact that fewer inefficiencies, such as unexploited arbitrage opportunities, which cannot be explained by pipeline bottlenecks, are observed in the market after the extension of the Southern trading zone. Thus, the policy decision to merge the two southern trading zones removed unexplained barriers to trade. Indeed, a bigger market size and a larger number of market participants allows a more transparent price formation and prevents strategic manipulation in the market. These changes induce a more efficient spatial arbitrage activity between the northern and southern markets.
Third, it should be noted that, in contrast, the estimated probability &(*97 (& (*
:7 after the zone
merger) to observe barriers to trade due to a saturated transport infrastructure does not change over time and remains close to 15%. This result is not surprising, as there was no substantial variation in the capacity of the pipeline infrastructure over the whole sample period. Indeed, it should be emphasised that the policy decision to merge the southern trading zones was taken as a short-run remedy (see the discussion in section 4.1). High price spreads explained by technical constraints, which in our case is the last remaining obstacle for the market integration, will hopefully be eliminated once the additional infrastructure capacity is provided.
Lastly, we also note that the regime probabilities &((97 and & ((
:7 of observing autarky prices (i.e.
24
finding is not surprising as we observe an almost uninterrupted trade flow of natural gas from the North to the South during the whole sample period.
Regarding standard deviations, our estimates for the congestion regime #97 and
#:7 are higher
than the ones obtained for the barriers to trade regime 97 and :7, particularly after the zone
merger. This result indicates that the deviations of the spatial price differential from equilibrium transaction costs are larger when the infrastructure is saturated. Interestingly, one can also remark that the standard deviation of the congestion regime # increases from 3.0 to 4.4 after the zone merger. This finding reveals a rising social cost of congestion and confirms a growing need for infrastructure expansions aimed at alleviating pipeline bottlenecks. After the merger, we observe a lower estimate for the standard deviation of the positive shocks in equation (5), which is coherent with the hypothesis that the markets become more integrated and efficient afterwards.
An examination of the estimation results obtained for the components of the transaction costs also provides several insights. One can note that the values of the standard deviations of the unobservable shock of the unit transaction cost 97 and :7 are relatively low. It is also interesting to
see that this standard deviation is substantially lower after the zone merger. The variability of the arbitrage cost incurred by spatial arbitragers thus decreases after the policy measure. This finding could reflect an improvement in the liquidity observed in the southern market as the presence of a greater number of market participants lowers the variability of the transaction costs incurred by arbitragers.
We then examine the expected value of the estimated total transaction costs that includes both an observable portion and an estimate of non-observable one.7 This expected value is as follows:
7 The chosen specification for the unobservable portion solely includes a constant and the gas volumes
transported from the North to the South. It was selected among a number of candidates that combine other possible explanatory variables (e.g. seasonality variables, week-day dummies). Our preferred specification was selected using a general-to-specific approach aimed at identifying the most parsimonious model that is not rejected by the data (using likelihood ratio tests). It is important to highlight that our main conclusions regarding the merger effects on regime probabilities also hold with these more general models. For the sake of brevity, we
25
= − 0.964∗∗∗+ 2.492∗∗∗ BC DE (13)
The estimated costs coefficients are significant at the 1% level. The constant parameter is found to be negative but this should not be surprising as it captures a number of un-modelled effects (e.g. market and macroeconomic issues). Other costs, such as a fixed fee for the hub access in each zone or hedging and information costs, are also incorporated in the constant. The volume coefficient also conveys important findings. Massol and Banal-Estañol (2018) prove that a positive and significant value for the volume coefficient reveals the presence of market power in spatial arbitrage. Indeed, in our case the null hypothesis of competitive North-South spatial arbitrage is firmly rejected as the t-stat of that coefficient is 10.21.
We now discuss both the magnitude and the evolution of the estimated transaction costs across time. The average sample values for the tariffs and the transported volumes variable (i.e. 0.74 and 0.31, respectively) yield an expected value of €0.55 per MWh for that transaction cost. To gain insights on its evolution over time, Figure 5 depicts the one-month centered moving average of the estimated transaction costs. We note that this cost is generally lower after the merger than before. A visual inspection of that plot also suggests that there was a downward trend during the early years but not after 2014.
Figure 5. Estimated total transaction costs in EUR/MWh (1-month centered moving average).
do not report the estimation results obtained with these models. Of course, the results obtained with these broader specifications are available from the authors upon request.
26
We now use our transaction costs estimates to evaluate the arbitrage rent perceived by spatial arbitragers (see Table 5). Comparing the values before and after the implementation of the regulatory policy, we document a subsequent €0.71 per MWh reduction in the average arbitrage rent, as well as a slight decrease in the average transaction costs of €0.22 per MWh. Thus, before the merger, the estimated arbitrage rent accounted, on average, for 72% of the price spread, whereas that proportion is reduced to 69% after the merger. Taking into account a substantial reduction in the average price spread, these results show an increased spatial efficiency between the considered markets following the creation of a unique southern market.
Table 5. Mean price differentials, estimated transaction costs and arbitrage profits for North-South arbitrage.
Mean, EUR/MWh Price spread Transaction cost Arbitrage rent
Full sample 1.877 0.543 1.334
Before the merger 2.225 0.624 1.601 After the merger 1.300 0.409 0.891
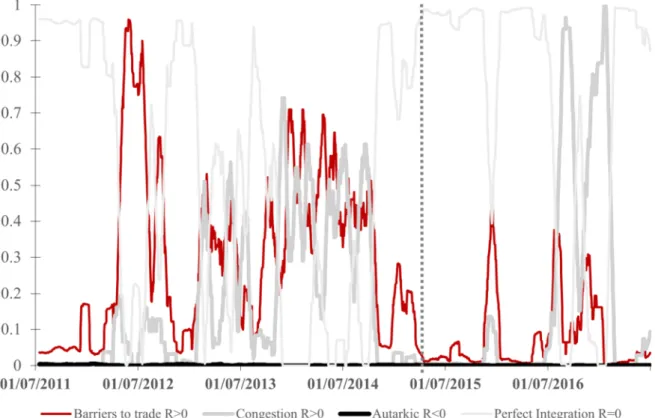
Following the approach first discussed in Kiefer (1980) and Spiller and Wood (1988, p.889–90), we now use our parameter estimates to determine, for each observation t, the probability Probar
t that
27
Probar
t =&F F($ |,) /∑ &⁄ H H H($ |,)0. Figure 6 depicts the one-month centered moving average
value of these probabilities. We find that, after the zone merger, we mostly observe the integrated equilibrium regime and a few short periods of the congestion regime.
Figure 6. One month centered moving average estimates of regime probabilities. The vertical dashed bar marks the zone merger.
Summing up, we find an improved market efficiency and increased market integration after the policy decision to merge the two southern gas trading zones, even if our analysis reveals the imperfectly competitive nature of the arbitrage activity between the northern and southern natural gas markets. We also find that the infrastructure is used more efficiently after the policy measure, as we observe unexploited arbitrage opportunities along with spare infrastructure capacity prior to the zone merger, while afterwards almost all the cases with positive arbitrage rent are explained by capacity
28
constraints. Thus, the remaining inefficiencies in the market could be eliminated by infrastructure expansion.
6. Conclusions and policy implications
In Europe, over the last two decades a series of regulatory reforms were carried out to foster both the emergence of liquid regional gas hubs and their economic integration. The most recent example of such reforms concerns the regional mergers of gas trading zones that are presumed to allow a more efficient allocation and pricing of natural gas and an increased competition between market participants. This paper represents, to the best of our knowledge, one of the very first attempts to verify the validity of that postulate by examining the effects of that institutional reform on the efficiency of the spatial arbitrage conducted between the affected regional trading area and other adjacent wholesale markets for natural gas.
Our investigations focus on the case of France and more specifically on the 2015 decision to merge the country’s two southern hubs and on its repercussions on the spatial arbitrage conducted between the northern and southern markets. For this purpose, we develop an adapted empirical method: the extended Parity Bounds Model that has its intellectual roots in the theory of spatial equilibrium. Its application to the French case provided us with an opportunity to obtain a series of original findings that have important policy implications.
Our results document the positive impact of that institutional reform on the spatial efficiency of the markets because (i) the average arbitrage rent for the North-South trading activity is considerably reduced, (ii) the spatially integrated equilibrium state, meaning that spatial arbitrage opportunities between the Northern and Southern markets are exploited, is observed 80% of time after the zone merger, compared to only 60% before, and (iii) the probability of observing unexploited arbitrage opportunities, meaning unexplained barriers to trade that are not caused by transportation bottlenecks, drops significantly from 25% to 5%. Another important result is that, following the merger, we observe a higher load rate of the infrastructure connecting the northern and southern markets.
29
Moreover, unexploited arbitrage opportunities are predominantly explained by transportation bottlenecks after the extension of the southern trading zone, which was not the case before the reform. Our result also indicates the presence of imperfect competition in the observed spatial arbitrage activity which calls for a close regulatory monitoring of the behaviour of market participants.
Overall, our results indicate that trading zone mergers are an interesting policy instrument that encourages competition between market participants and improves the liquidity of the gas hubs. Such reforms can lower the inefficiencies and barriers to trade between adjacent markets. Of course, in the case of congested networks, the reform has to be completed through physical infrastructure expansions in order to alleviate the effect of pipeline bottlenecks. That said, zone mergers positively contribute to the development of a spatially efficient and perfectly integrated European gas market.
References
ACER and CEER, 2015. European Gas Target Model Review and Update. January 2015. www.acer.europa.eu
ACER and CEER, 2017. Annual Report on the Results of Monitoring the Internal Electricity and Gas Markets in 2016: Gas Wholesale Markets Volume. www.acer.europa.eu
Asche, F., Osmundsen, P., Tveteras, R., 2001. Market integration for natural gas in Europe. International Journal of Global Energy Issues 16 (4), 300–312.
Asche, F., Osmundsen, P., Tveteras, R., 2002. European market integration for gas? Volume flexibility and political risk. Energy Economics 24 (3), 249–265.
Asche, F., Misund, B., Sikveland, M., 2013. The relationship between spot and contract gas prices in Europe. Energy Economics 38, 212–217.
30
Bachmeier, L.J., Griffin, J.M., 2006. Testing for market integration, crude oil. Coal and natural gas. Energy Journal 27, 55–72.
Barrett, C.B., Li, J.R., 2002. Distinguishing between Equilibrium and Integration in Spatial Price Analysis. American Journal of Agricultural Economics 84(2), 292–307.
Brown, S.P.A., Yücel, M.K., 2008. Deliverability and regional pricing in U.S. natural gas markets. Energy Economics 30(5), 2441–2453.
Brown, S.P.A., Yücel, M.K., 2009. Market arbitrage: European and North American natural gas prices. The Energy Journal Special Issue, 167–185.
CEER vision for a European Gas Target Model – Conclusions Paper, 2011. Ref: C11-GWG-82-03. 1 December 2011.
Cournot, A.-A., 1838. Recherches sur les Principes Mathématiques de la Théorie des Richesses, ch. IV, p 55.
Cuddington, J.T., Wang, Z., 2006. Assessing the degree of spot market integration for US natural gas: evidence from daily price data. Journal of Regulatory Economics 29(2), 195–210.
David L., Percebois J., 2004. Access pricing on gas networks and capacity release markets: Lessons from North American and European experiences. Energy Studies Review 12(2), 125–142.
De Vany, A., Walls, W.D., 1993. Pipeline Access and Market Integration in the Natural Gas Industry: Evidence from Cointegration Tests. The Energy Journal 14(4), 1–19.
Doane, M.J., Spulber, D.F., 1994. Open Access and the Evolution of the U. S. Spot Market for Natural Gas. Journal of Law and Economics 37(2), 477–517.
Dukhanina, E, Massol, O., 2018. Spatial Integration of Natural Gas Markets: a Literature Review. Current Sustainable Renewable Energy Reports 5(2), 129–137.
31
Enke, S., 1951. Equilibrium among Spatially Separated Markets: Solution by Electric Analogue. Econometrica 19(1), 40–47.
Growitsch, Ch., Stronzik, M., Nepal, R., 2015. Price Convergence and Information Efficiency in German Natural Gas Markets. German Economic Review 16(1), 87–103.
Heather, P., Petrovich, B., 2017. European traded gas hubs: an updated analysis on liquidity, maturity and barriers to market integration. Oxford Institute for Energy Studies. Energy Insight, 13 May 2017.
Kiefer, N.M., 1980. A Note on Switching Regressions and Logistic Discrimination. Econometrica 48(4), 1065–1069.
King, M., Cuc, M., 1996. Price Convergence in North American Natural Gas Spot Markets. The Energy Journal 17(2), 17–42.
Kwiatkowski, D., Phillips, P. C. B., Schmidt, P., Shin, Y., 1992. Testing the null hypothesis of stationarity against the alternative of a unit root. Journal of Econometrics 54 (1–3), 159–178.
Lanne, M., Lütkepohl, H., Saikkonen, P., 2002. Comparison of unit root tests for time series with level shifts, Journal of Time Series Analysis.
Li, R., Joyeux, R., Ripple, R.D., 2014. International natural gas market integration. The Energy Journal 35(4), 159–179.
Massol, O., Banal-Estañol, A., 2018. Market Power and Spatial Arbitrage between Interconnected Gas Hubs. The Energy Journal 39(2), 67–95.
Massol, O., Hache, E., 2016. Sanctions against Iran: An assessment of their global impact through the lens of international methanol prices. City University London. Working Paper.
Marshall, A., 1890. Principles of economics. Book Five: General Relations of Demand, Supply and Value. Chapter 1.
32
Miriello, C., Polo, M., 2015. The development of gas hubs in Europe. Energy Policy 84, 177– 190.
Mu, X., Ye, H., 2018. Towards an Integrated Spot LNG Market: An Interim Assessment. The Energy Journal 39(1), 211–233.
Ng, S., Perron, P., 2001. Lag Length Selection and the Construction of Unit Root Tests with Good Size and Power. Econometrica 69(6), 1519–1554.
Negassa, A., Myers, R.J., 2007. Estimating Policy Effects on Spatial Market Efficiency: An Extension to the Parity Bounds Model. American Journal of Agricultural Economics 89(2), 338–352.
Neumann, A., Siliverstovs, B., von Hirschhausen, C., 2006. Convergence of European spot market prices for natural gas? A real-time analysis of market integration using the Kalman Filter. Applied Economics Letters 13(11), 727–732.
Neumann, A., 2009. Linking Natural Gas Markets – Is LNG Doing its Job? Energy Journal. Special Issue 30, 187–199.
Neumann, A., Cullmann, A., 2012. What's the story with natural gas markets in Europe? Empirical evidence from spot trade data. 9th International Conference on the European Energy Market.
Nick, S., Thoenes, S., 2014. What drives natural gas prices?—A structural VAR approach. Energy Economics 45, 517–527.
Olsen, K.K., Mjelde, J.W., Bessler, D.A., 2015. Price formulation and the law of one price in internationally linked markets: an examination of the natural gas markets in the USA and Canada. The Annals of Regional Science 54(1), 117–142.
33
Park, A., Jin, H., Rozelle, S., Huang, J., 2002. Market Emergence and Transition: Arbitrage, Transaction Costs, and Autarky in China’s Grain Markets. American Journal of Agricultural Economics 84, 67–82.
Park, H., Mjelde, J.W., Bessler, D.A., 2008. Price interactions and discovery among natural gas spot markets in North America. Energy Policy 36(1), 290–302.
Renou-Maissant, P., 2012. Toward the Integration of European Natural Gas Markets: A timevarying Approach. Energy Policy 51, 779–790.
Samuelson, P.A., 1952. Spatial Price Equilibrium and Linear Programming. The American Economic Review 42(3), 283–303.
Serletis, A., 1997. Is There an East-West Split in North American Natural Gas Markets? The Energy Journal 18(1), 47–62.
Sexton, R., Kling, C., Carman, H., 1991. Market Integration, Efficiency of Arbitrage and Imperfect Competition: Methodology and Application to U.S. Celery. American Journal of Agricultural Economics 73(3), 568–580.
Siliverstovs, B., L'Hégaret, G., Neumann, A., von Hirschhausen, C., 2005. International market integration for natural gas? A cointegration analysis of prices in Europe, North America and Japan. Energy Economics 27(4), 603–615.
Spiller, P.T., Wood, R.O., 1988. The Estimation of Transaction Costs in Arbitrage Models. Journal of Econometrics. North-Holland 39, 309–326.
Takayama, T., Judge, G.C., 1964. Equilibrium among Spatially Separated Markets: A Reformulation. Econometrica 32(4), 510–524.
Takayama, T., Judge, G.C., 1971. Spatial and Temporal Price and Allocation Models. North- Holland, Amsterdam.
34
Walls, D., 1994. Price Convergence across Natural Gas Fields and City Markets. The Energy Journal 15(4), 37–48.
Weinstein, M.A., 1964. The sum of values from a normal and a truncated normal distribution. Technometrics 6, 104–105 (with some additional material, 469–470).