OATAO is an open access repository that collects the work of Toulouse
researchers and makes it freely available over the web where possible
Any correspondence concerning this service should be sent
to the repository administrator:
[email protected]
This is an author’s version published in:
http://oatao.univ-toulouse.fr/27594
To cite this version:
Freyria, Francesca S. and Marocco, Antonello and Esposito, Serena and Bonelli,
Barbara and Barrera, Gabriele and Tiberto, Paola and Allia, Paolo and Oudayer,
Pauline and Roggero, Aurélien
and Matéo-Vélez, Jean-Charles and Dantras, Eric
and Pansini, Michele Simulated Moon Agglutinates Obtained from Zeolite Precursor by
Means of a Low-Cost and Scalable Synthesis Method. (2019) ACS Earth and Space
Chemistry, 3 (9). 1884-1895. ISSN 2472-3452
iron (np Fe0).4,7
With respect to component sizes, in 1991, McKay et al. defined “lunar regolith” as the ensemble of components with <1 cm size deriving from disaggregation phenomena, and should basically coincide with the so called “lunar soil”.8
Since 2006, the term“lunar soil” has been instead applied only to the <1 mm fraction.7,9The components size is important: former Apollo missions reported some toxic effects, like dermal irritation, penetration, and ocular damages as well as pulmonary and cardiovascular diseases,5because the finest part of lunar soil (i.e., those components with an aerodynamic diameter < 10μm) can damage the human respiratory system. Particularly, the fraction with 2.5−10 μm diameter can deposit within the trachea and bronchiole ducts, thefine fraction (0.1− 2.5μm) can penetrate the respiratory zone, and the ultrafine fraction (less than 0.1 μm) can interact with mucous membranes or be trapped by macrophages.10,11
The absence of atmosphere, the solar wind, and the continuous chemical reduction can confer electrostatic charge to the lunar soil and create three main fractions, namely, levitated dust (<10μm at altitudes of 10−30 cm), ejecta, and meteoroids.3,12Besides being harmful to humans, the various fractions may interact with surfaces both electrostatically and mechanically (owing to its degree of abrasiveness, penetration, and friction ability).2,13 Moreover, in airless environment, under constant UV radiation and regular and hypervelocity bombardment by meteorites and micrometeorites, small
fractions of the lunar regolith may melt, and their surface may become highly reactive: the molten phase quenches to a glass that welds the mineral and lithic particles into aggregate grains, giving rise to the aforementioned “agglutinates”,14 characterized by the size of a few nanometers to several micrometers and containing plenty of Fe particles.1,15,16The latter occur either as larger“globules” (average size of 120 ± 20 nm)17or as smaller metallic iron nanoparticles, i.e., np Fe0
with dimensions in the 3−33 nm range and average size of 7 nm.18 At variance with terrestrial minerals, in lunar agglutinates, iron cannot occur as Fe3+ species, but only as
Fe0and/or Fe2+species,14
which may produce reactive oxygen species dangerous to human cells.19,20Consequently, aggluti nates can dissolve into body fluids, giving rise to dangerous Fenton’s reaction,10,11,21 and can be harmful to astronauts, whereas the abrasive and magnetic properties may be harmful to spacecraft devices.
Notwithstanding the need of studying in detail the lunar regolith properties, the scarcity of the actual Moon soil has resulted in the creation of several lunar regolith/soil simulants,22 some of which are listed in Table 1. Since the first simulant, named JSC 1, standardized by NASA in 1994,5
many simulants have been produced and studied. At the end of 2010, the LEAG CAPTEM simulant working group wrote an exhaustive report about the state of the art of the simulants and their utilization.23Afterward, new simulants (e.g., CLDS i and Table 1. List of the Most Common and/or Recently Developed Lunar Regolith/Soil Simulantsa
simulant name country
presence of agglutinates with
np-Fe0 modification purpose ref yearb
JSC-1/1A/1AF/1AC/2A Johnson Space Center
USA no np-Fe0embedded in a glassy matrix by sol gel synthesis,
followed by reduction at high temperature16
general 23,34,
35
1994 LHS-1 Lunar Highlands
Simulant
USA no general 33 since
2014
LMS-1 Lunar Mare Simulant USA no general 33 since
2014
OPR series USA not clear own agglutinates (OPR-H/L 2W) general 36 since
2015
GSC-1 USA no general 37 2008
NU-LHT/1M/2M/3M/2C/ 1D
USA pseudoagglutinate and“good” glass general 38 2009
OB-1 Canada fayalitic olivine slag glass general 39 2008
CHENOBI Canada glassy component from plasma-melted Shawmere
anorthosite
general 40 2009
CAS-1 Chinese Academy of Sciences
China no general/
geotechnical
41 2009
CLRS-1/2 China not clear general 23,33 2009
NEU-1 Northeastern University Lunar Simulant
China no general 42 2017
TJ-1/2 Tongji University China no general/
geotechnical
43 2010
BHLD20 Lunar Dust Simulant
China no glassy component from material partially melted in a muffle furnace
general 44 2017
CLDS-i China yes general/
toxicological 45 2016 NAO-1 National Astronomical Observatories China no general 46 2009
Oshima Simulant Japan no general 47 2008
FJS-1/2/3 Fuji Japanese Simulant
Japan no general 48,49 1998
Kohyama Simulant Japan no general 47 2008
DNA-1 De NoAntri Italy no general/3D
printing
50 2014
aThose simulants developed only for geotechnical or optical purposes (having mineral and/or chemical composition) are not reported here. Other,
BHLD20)21,22have been developed to betterfigure out all the possible drawbacks that lunar regolith/soil can cause.
As shown inTable 1, the available simulants often lack the agglutinates fraction, likely because it is the most difficult to reproduce. An efficient (but expensive and scarcely scalable) method to synthesize agglutinitic glasses is based on a sol−gel synthesis, starting from silica organosilanes (e.g., TEOS) or precondensed silica commercial solutions, used as precursors of the glassy matrix, and nitrates, used as precursors of oxides and np Fe0: the so produced agglutinates were sometimes
added to the JSC 1Af simulant (Table 1).12 In 2010, Spray proposed instead the use of a friction welding apparatus for the production of a lunar regolith agglutinate simulant (lacking the np Fe0 component) and suitable for lunar engineering applications: the author mentioned that the inclusion of np Fe0 would have been a further improvement, facilitating the ISRU extraction technologies and making the agglutinate simulant more realistic from the point of view of electrostatic properties.4
To the best of our knowledge, only the CLDS i simulant already contains agglutinates with embedded metallic iron (obtained from basalts and metallic iron targets bombarded at low pressure in nitrogen environment),21and according to the literature the production of a reliable and inexpensive simulant is still far for being fulfilled.22Here, we report the synthesis and characterization of simulated Moon agglutinates containing embedded np Fe0 and having physicochemical features
comparable to the actual agglutinates, by means of a smart process24,25for the production magnetic nanocomposites. The process envisages two steps, i.e., a heavy metal (Fe, Ni, or Co) cation exchange of a commercial zeolite and a thermal treatment at relatively mild temperatures (773−1123 K range) under reducing atmosphere (2.0 vol % H2 in
Ar).26−30The nanocomposites were already successfully used for other biochemical and environmental applications.31,32In this work, two np Fe0rich nanocomposites, obtained from two
commercial zeolites (Na A and Na X), were characterized by means of physicochemical, structural, magnetic, and electric techniques, in order assess whether they have the proper
features to be considered as simulants of the lunar regolith agglutinates.
2. MATERIALS AND METHODS
2.1. Chemicals and Materials Synthesis. Carlo Erba (Italy) reagent grade chemicals were used. 4A zeolite (framework type LTA, Na12Al12Si12O48·27H2O, hereafter
referred to as “Na A zeolite”) and 13X zeolite (framework type FAU, Na86Al86Si106O384·264H2O, hereafter referred to as
“Na X zeolite”) were used as parent zeolites. Their cation exchange capacity was determined by the “batch exchange method”51,52 and was very close to the calculated cation exchange capacity of Na A and Na X zeolite, i.e., 5.48 and 4.73 mequiv g−1, respectively.
Scheme 1 shows the adopted preparation procedure: the parent zeolite was contacted with a 0.1 M Fe2+ solution,
prepared by dissolving FeSO4·7H2O (99.5 wt %) in doubly
distilled water (solid/liquid weight ratio = 1/50 g/g; contact time t = 40 min). To prevent Fe2+oxidation, the temperature was kept at about 280 K and Ar was continuously bubbled into the solution.53The solid was then recovered byfiltration and contacted again with a fresh solution: this step was repeated eight andfive times with Na A and Na X zeolite, respectively, due to their different exchange capacity.54,55 The resulting powders were washed with doubly distilled water, dried for about 1 day at 353 K and eventually stored for at least 3 days in a 50% relative humidity environment, to allow water saturation of the zeolite. Afterward, the Fe2+exchanged zeolites (hereafter
referred to as Fe A and Fe X zeolite) were treated in a Pt crucible at 1023 K for 2 h (heating rate 10° min−1) byflowing
a 2 vol % H2 in Ar mixture inside an Al2O3 tubular furnace
(inner diameter = 6.9 cm, height = 91 cm). Afterward, the furnace was switched off and the samples were left to cool down to room temperature. The two nanocomposites from the Na A and Na X zeolites will be hereafter referred to as SMA A and SMA X, respectively (SMA = simulated moon aggluti nate).
2.2. Characterization Methods. The Fe2+and (residual)
Na+contents of both Fe A and Fe X zeolites were determined Scheme 1. Sketch (Not in Scale) of the Preparation Procedure of Both SMA A and SMA X Nanocomposites by Fe2+Exchange
by atomic absorption spectrophotometry (AAS, PerkinElmer Analyst 100 apparatus) after dissolving the solids in a 40 wt % HF and 14 wt % HClO4aqueous solution.56,57
The powder materials were characterized by X ray powder diffraction (XRPD) on a Philips X’Pert diffractometer equipped with a Cu Kα radiation (λ = 1.5406 Å; 2θ range = 5°−100°; step = 0.02° 2θ; time per step = 1 s); phase identification was performed by referring to the PDF 2 Release 2002 database. The full profile Rietveld method was applied to the diffraction patterns, with LaB6 powder as the internal
standard (to evaluate crystalline and/or amorphous phases) and by using the High Score Plus v 3.0e software (Malvern Panalytical).
N2adsorption/desorption isotherms at 77 K were measured
on samples previously outgassed at 523 K for 4 h to remove water and other atmospheric contaminants (Quantachrome Autosorb 1 instrument). The samples specific surface area was calculated according to the Brunauer−Emmett−Teller (BET) method (SBET); total pore volume (Vp) and micropore volume
(Vmp) were determined from the amount of adsorbed N2at P/
P0= 0.9 and according to the t plot method, respectively (see
Table 2).
Transmission electron microscopy (TEM) analysis was carried out on a JEOL 3010 UHR instrument operating at 300 kV and a FEI TECNAI instrument operating at 120 kV, both equipped with LaB6 filaments. To obtain a good dispersion, the powders were either briefly contacted with lacey carbon Cu grids (resulting in the mere electrostatic adhesion of some particles to the sample holder) or predispersed in ethanol and then dropped on carbon Cu grids. Average size of np Fe0was obtained by considering more
than 100 particles on the TEM images (at least 5 different images).
Differential centrifugal sedimentation method was applied to calculate the particle size distribution on a CPS disc centrifuge: before the measurements, the powders were dispersed in water and sonicated for 5 min.
2.3. Magnetic and Electrical Properties Measure-ment. The magnetic properties of the SMA A and SMA X nanocomposites were studied at both room temperature and 5 K (low T) on a SQUID magnetometer operating in the 0−70 kOe range. The FC/ZFC curves of the magnetic nano composites were obtained under a field of 200 Oe in the temperature interval 10−300 K using the Lakeshore VSM.
The electrical properties of the nanocomposites were studied using broadband dielectric spectroscopy (BDS) and DC conductivity measurements techniques.58,59In both types of measurement, samples made of dust layers were approximately 200 μm thick and confined between two metallic electrodes. Isotherm dielectric spectroscopy measure ments were carried out under dry N2 flow at atmospheric
pressure at the CIRIMAT laboratory (Toulouse, France) in the 133−423 K temperature range and in the 10−2−106 Hz frequency range. By steps of 283 K, sinusoidal voltages U* (amplitude 1 V, 10 points per frequency decade) were isothermally applied to the sample. The measurements of
both the induced current (I*) and its phase shift relative to the applied voltage yielded the complex impedance (Z*) values as a function of temperature and frequency. The complex dielectric permittivity ε* (eq 1) and electrical conductivity σ* (eq 2) formalisms were used to represent the BDS data.
i i C Z ( ) ( ) ( ) 1 ( ) 0 ε ω ε ω ε ω ω ω * = ′ − ″ = * (1.1) C A l 0 0 ε = (1.2)
whereε′ and ε″ are the real and imaginary parts of ε*, ω is the angular frequency, and C0 is the capacitance of the vacuum
filled capacitor formed by the two electrodes of area A separated by the sample thickness l (ε0 is the vacuum
permittivity), whereσ′ and σ″ are the real and imaginary parts ofσ*.
i i
( ) ( ) ( ) 0 ( )
σ* ω = ′σ ω + σ ω″ = ωε ε* ω (2)
DC conductivity measurements were carried out under secondary vacuum (<10−6 mbar) at the ONERA laboratory (Toulouse, France) with a constant voltage between the electrodes and with temperature from 298 to 423 K. Dust layer density was around 0.6 g cm−3.
3. RESULTS AND DISCUSSION
3.1. Physicochemical Characterization. As determined by AAS analysis, the Fe A zeolite contains 4.51 mequiv g−1 Fe2+and 0.58 mequiv g−1Na+, and the Fe X zeolite contains
3.54 mequiv g−1 Fe2+ and 1.15 mequiv g−1 Na+. The corresponding cation equivalent fractions were calculated as xFe= 0.89 and xNa= 0.11 (Fe A), and xFe= 0.75 and xNa= 0.25
(Fe X). The wt % Fe was 16.9 and 13.1 wt % in SMA A and SMA X, respectively, as calculated from the Fe2+ content of the Fe2+exchanged zeolites by considering the nanocompo
sites as completely dehydrated materials. The different iron content in the two Fe2+exchanged zeolites is probably
determined by their different cation exchange capacity, open windows, cage size, and pore structure: Na A has, indeed, larger cation exchange capacity (5.48 mequiv g−1) and smaller pore window (0.41 nm) than Na X (4.74 mequiv g−1and 0.74 nm).
Figure 1reports the X ray diffraction (XRD) patterns of (i) the parent Na A and Na X zeolites, (ii) the Fe2+exchanged ones (Fe A and Fe X), and (iii) the nanocomposites (SMA A and SMA X). Comparison between the XRD patterns of the parent zeolites and the Fe2+exchanged ones shows (i) a slight
shift of some diffraction peaks toward larger 2θ angles, (ii) a decrease of the intensity of most of the peaks, and (iii) an increase of the intensity of some minor peaks in Fe A and Fe X XRD patterns. Such findings may be reasonably ascribed to small changes of the zeolite unit cell volume upon Fe2+ exchange and/or to a larger X ray absorption coefficient of Fe2+ions, as previously found with Ba2+exchanged A zeolite.60 In the XRD patterns of both SMA A and SMA X, the sharp peak at 44.6 2θ is ascribed to the most intense diffraction of Table 2. Results of QPA as Obtained by Rietveld Refinement (Phase wt %)a
parent zeolite (wt %) Fe0(wt %) Fe
2SiO4(wt %) amorphous phase (wt %) SBET(m2g1) Vp(cm3g1) Vmp(cm3g1)
SMA_A 1.031 2.631 7.031 89.431 9.50 0.055 0.007
SMA_X 1.6 98.4 19.03 0.066 0.029
aSpecific surface area (S
the α Fe0phase (d
011), whereas the broad signal centered at
about 24 2θ is due to the occurrence of an amorphous phase. Some broad (and weak) peaks ascribable to residual parent zeolite are only detected with the SMA A pattern (being instead absent with SMA X) along with two peaks at ca. 35.8 2θ and 31.6 2θ (asterisks) that are assigned to the two most intense diffractions (d121 and d301) of fayalite (Fe2SiO4, vide infra).
As confirmed by XRD results, during the reductive thermal treatment, Fe2+ cations are reduced to their zerovalent state, while the zeolite framework releases oxygen with formation of water vapor and consequent collapse of the microporous crystalline structure (eq 3):31
Fe O2 zeo+H2(g)→Fe(s)+H O2 (g) +
(3)
Quantitative phase analysis (QPA) results, as obtained by the Rietveld method, are reported inTable 2: the reductive thermal treatment was unable to reduce all the iron occurring in the exchanged zeolites (16.9 and 13.1 wt %, respectively), in that the amount of Fe0in the nanocomposites was 2.6 wt %
(SMA A) and 1.6 wt % (SMA X), the remaining iron mainly occurring in the amorphous phase (89.4 and 98.4 wt %, respectively) resulting from the zeolite thermal collapse. The QPA showed that, with respect to SMA X, a smaller amount of amorphous phase was found with SMA A, in which also small amounts of parent zeolite (1.0 wt %) and of fayalite (Fe2SiO4, 7.0 wt %) were present.
The higher amount of Fe0in the SMA A nanocomposite is
in agreement with previous work concerning similar nano composites obtained by thermal reduction of Ni2+exchanged
A and X zeolites.61Comparable results were, indeed, obtained,
in that QPA showed the occurrence of some residual zeolite in the A zeolite derived nanocomposites, where the reduction of Ni2+species was more extensive than in X zeolite derived ones.
On the basis of those results, the higher Fe0content in SMA A is ascribed to a more facile reduction of the transition metal ions in the A zeolite structure.
The zeolite structure collapse is confirmed by the values of specific surface area (SBET), total pore volume (Vp), and
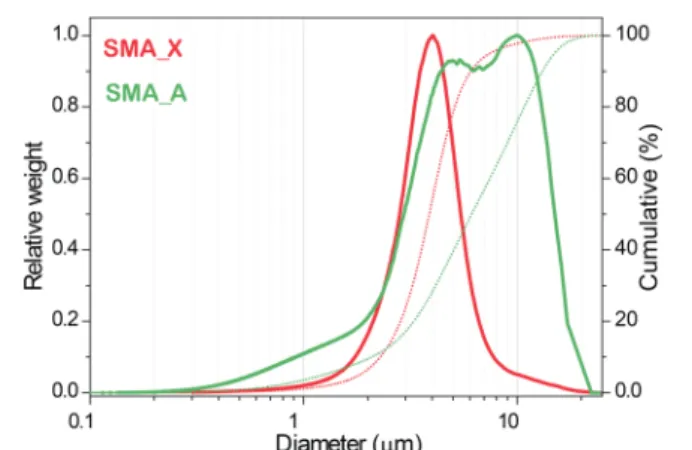
micropore volume (Vmp) (Table 2) obtained from the N2 isotherms at 77 K (not reported): the low surface and porosity of the two nanocomposites (SBET values of SMA A and SMA X are 2 orders of magnitude smaller than those of the parent zeolites) reflect the occurrence of a densification phenomenon due to zeolite collapse, which should also affect the grain size. Figure 2 reports the corresponding grain size
distributions: the normalized distribution of SMA A (green curve) shows two maxima of similar intensity at about 4.5 and 10μm, with 50 wt % grains smaller than 6.1 μm (dotted green curve), whereas the normalized distribution of SMA X (red curve) shows only one peak at about 3.5 μm, with 50 wt % grains smaller than 3.8 μm (dotted red curve). The parent zeolites had larger average grain size (ca. 10−12 μm)62,63than the nanocomposites did, which indeed shows grain size similar to that of the lunar soil coarse fraction (2.5−10 μm), but still larger than that of thefine (0.1−2.5 μm) and ultrafine (<0.1 μm) fractions. For studies requiring smaller grain size (for instance, the breathable, and thus dangerous, fraction with aerodynamic diameter <10 μm)6,7 proper ball milling procedures applied to the present nanocomposites could allow decreasing the grain size down to 300 nm.64
The TEM images (Figure 3) of the two nanocomposites show partially homogeneous samples, where np Fe0of different sizes, embedded within a glassy matrix, are detected: SMA X shows, indeed, np Fe0 with an average diameter of 4.4 ± 1.8 nm, whereas SMA A shows slightly larger np Fe0 (average
diameter of 6 nm), as reported previously.31 Though some larger and crystalline Fe0particles (ca. 50−150 nm) were also
detected in both samples (not reported), both types of Fe0 particles had average size compatible with the particle size distribution of Fe0globules in agglutinitic glass.1
3.2. Magnetic and Electric Properties of SMA A and SMA X. The higher amount of Fe0 in the SMA A
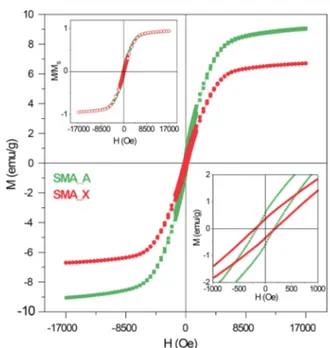
nanocomposite is confirmed by the results of magnetization measurements carried out at room temperature (Figure 4):
Figure 1.(a) XRD patterns of Na A (black curve), Fe A (blue curve), and SMA A (green curve; asterisks: diffraction peaks assigned to fayalite). (b) Powder XRD patterns of Na X (black curve), Fe X (blue curve), and SMA X (red curve).
Figure 2.Normalized grain size distribution plots (solid curves) and cumulative curves (dotted curves) of SMA A (green curves) and SMA X (red curves).
SMA A shows an extrapolated saturation magnetization Ms =
9.6 emu g−1, whereas SMA X has Ms= 7.1 emu g−1, with quite similar coercive fields (Hc = 166 and 190 Oe, respectively;
lower inset to Figure 4). As a matter of fact, the room temperature loops for the two nanocomposites only differ in
their amplitudes (as shown in the upper inset to Figure 4, where the reduced magnetization M/Ms is depicted). The
similarities in coercive field, magnetic permeability, loop closure field (about 4000 Oe), and overall loop shape (including a nonsaturating trend above 10 kOe) indicate that the magnetization processes are basically the same in the two nanocomposites. In particular, the magnetic signal is expected to be dominated by the contribution of large, multidomain nanoparticles (as those of 50−150 nm size that were observed in SMA A)61 where the magnetization process involves domain wall motion and magnetization rotation and deter mines Hc, lowfield permeability and closure field values. The high value of Hc is related to the hindrances to domain wall motion provided by quenched in stress in large np Fe0. On the
other hand, the nonsaturating behavior of the M(H) curves is related to the magnetic response of smaller np Fe0, which were
detected by TEM in SMA A (size in the 2−10 nm range).61 At room temperature, such nanoparticles are expected to be in the superparamagnetic phase. In principle, a nonsaturating trend of the highfield magnetization could also be ascribed to a contribution from paramagnetic fayalite (Fe2SiO4); however,
the maximum fayalite content (7 wt % in SMA A) is too small to be responsible of the observed slope of the M(H) curve at highfield; moreover, no fayalite was detected in SMA X.
Though both nanocomposites have a larger Fe content than other lunar soil simulants do,65the magnetic properties of the SMA A and SMA X (Fe rich) nanocomposites are com parable to those of the simulants, which contain large np Fe0.
Typically, lunar soil is characterized by a complex magnetic behavior related to the presence of different Fe rich compounds66 and strongly affected by the sampling site on
Figure 3.Selected TEM micrographs of SMA X and SMA A.
Figure 4.Magnetization curves at room temperature of SMA A and SMA X after subtraction of the diamagnetic signal from the host matrix. Upper inset: reduced (M/Ms) magnetization curves; lower inset: magnification of the low field region of the M(H) curves.
Table 3. Room Temperature Values of Typical Magnetic and Electric Properties of the SMA A and SMA X Nanocomposites, As Compared to the Ones Actually Measured on Lunar Samples and Reported by the Literature
property
σ(S/m) ∼ 293 K Ea(eV)
material Ms(emu/g) Mr(emu/g) Hc(Oe) BDS DC BDS DC ref
SMA_A 9.1 0.64 217 ∼10−10 ∼5 × 10⁻¹² 0.51 0.48 this work
SMA_X 6.9 0.34 188 a ∼1.4 × 10⁻¹⁴ 0.79 b this work
lunarfines (#10084-89) 1.27 8.4× 10⁻² 36 66
lunar microbreccia (#10088) 0.44 6.7× 10⁻² 125 66
small soils (min/max) 2 2.2 0.10 0.46 not available 67
breccia 2 0.11 62 67
soils (min/max) 0.20 1.70 1.4× 10⁻² 0.46 18 88 67
A17 soils (min/max) 0.125 15.15 9× 10⁻³ 0.95 8 94 68
A14 soil 14163,131 10−15 10−14 0.4 0.9 (0.58) 58
A15 soil 15301,38 6.2.10−15 0.32 76
the Moon surface.67 At room temperature, a quasi super paramagnetic behavior is often observed, with coercivefields much lower than those measured in our nanocomposites,66,68 possibly indicating that the magnetic nanoparticles have smaller average size in actual lunar soils. The magnitude of
Ms in both nanocomposites is typically larger than the values measured in either lunar soils or simulants (Table 3): this is related to the amount of iron included in the diamagnetic matrix, which is higher in our nanocomposites. To this respect, the issue of the total iron content could be addressed by
Figure 5.(a) Temperature behavior of highfield magnetization, (b) coercive field, and (c) high field susceptibility in SMA A (green curves) and SMA X (red curves).
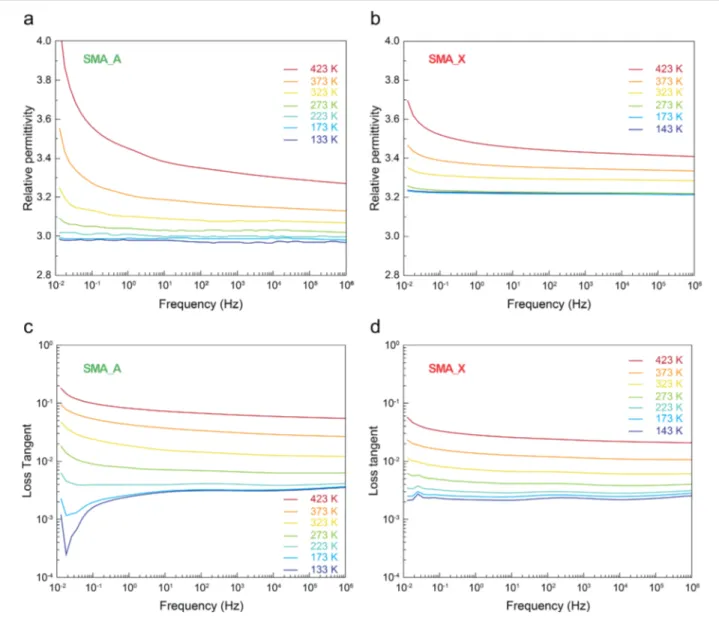
Figure 6.(a) Isothermal relative permittivity spectra of SMA A, (b) isothermal relative permittivity spectra of SMA X, (c) isothermal loss tangent spectra of SMA A, and (d) isothermal loss tangent spectra of SMA X.
changing the cation exchange conditions, as the adopted preparation method allows tuning the iron content by varying, for instance, the concentration of the exchange solution and/or the parent zeolite.
In view of lunar resource exploitation, it is useful to study how much does the magnetic response of the nanocomposites change as a function of temperature within the extremes measured on the Moon surface (direct in situ measurements give average values of 392 K at noon and 99 K at midnight).69 Therefore, hysteresis loops of the two nanocomposites were measured at T = 100, 200, 300, and 400 K. The behavior of highfield magnetization, coercive field, and high field suscept ibility is shown inFigure 5. These quantities steadily decrease with increasing temperature; the linear behavior of both M17 kOe and Hc (Figure 5a,b) is fully compatible with a high Curie temperature of multidomain nanoparticles, whereas the nonsaturating behavior of magnetization at high fields, measured by the highfield susceptibility (Figure 5c), is simply explained in terms of field induced ordering of surface
magnetization states rather than in terms of superparamagnetic contribution from the smaller particles: in the latter case, the slope of the M(H) curve should change much more than what actually observed between 100 and 400 K. In any case, the measured differences in magnetic properties of lunar soil between day and night are truly remarkable: this should be taken into account in the design and the fabrication of sensors/ actuators based on the detection or influenced by the stray magneticfields generated from lunar soil.
The relative permittivity and loss tangent as a function of frequency obtained by BDS at various temperatures are shown inFigure 6. For frequencies higher than 10−2Hz, the relative permittivity varies from 3 to 3.3 between 133 and 423 K for SMA A and from 3.2 to 3.4 between 143 and 423 K for SMA X.
A relative permittivity of 3 is expected for lunar samples.70 Lunar sample 14163,131 exhibited a permittivity of approx imately 2.4 over a frequency range of 102−105Hz. Here, at low frequencies and high temperatures, a sharp increase in the
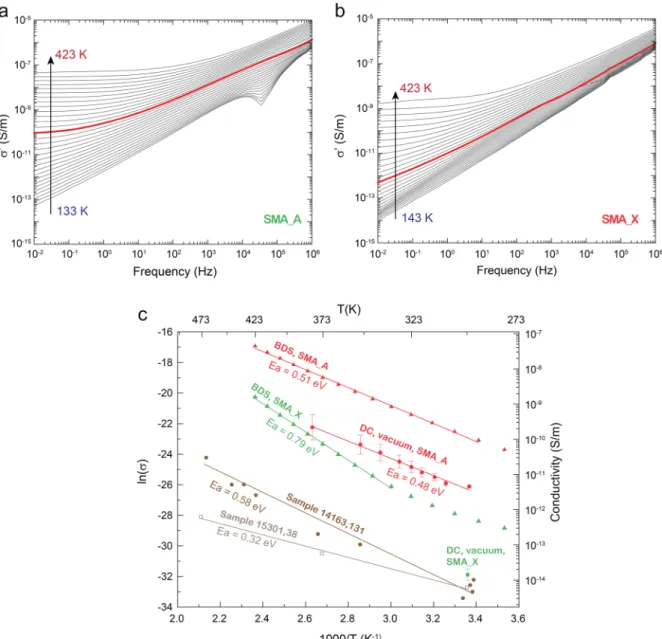
Figure 7.Isothermal electrical conductivity spectra of SMA A (a) and SMA X (b) (measurements at 293 K are reported as red curves). (c) Arrhenius diagrams of SMA A and SMA X as obtained by BDS and DC techniques. The BDS curves correspond to the DC plateaus (measured at 0.01 Hz). Conductivity mesurements done on 14163,131 and 15301,38 samples are also reported as comparison.58,75
relative permittivity of both SMA A and SMA X is observed, which is ascribed to the accumulation of electrical charge carriers either around the particles (Maxwell−Wagner Sillars phenomenon)71,72 or at the sample/electrode interfaces (electrode polarization effect).73Such accumulation is possible at high temperatures due to an increase in conductivity, leading to the formation of macro dipoles that are able to preferentially align along the electricfield lines only at low frequencies. The loss tangent quantifies the dissipation of energy of dielectric materials. It is constant above 1 Hz, for both SMA A and SMA X, and it varies with temperature between 0.003 to almost 0.1 for SMA A and between 0.002 and 0.3 for SMA X, in the studied temperature range. More precisely, at ambient temperature, the loss tangent is 0.01−0.02 and 0.006−0.008 for SMA A and SMA X, respectively. In comparison, the loss tangent of lunar sample 14163,131 varies between 0.05 and 0.001 at room temperature in the 102−104 Hz frequency
range.58
Figure 7shows the isothermal electrical conductivity spectra of SMA A (a) and SMA X (b). BDS electrical conductivity shows the so called universal power law behavior typical of disordered dielectrics.74The conductivity follows a powerlike trend that can be described byeq 4
A n, 0 n 1
DC
σ′ =σ + ω < < (4)
whereσ′ is the conductivity, σDCis the frequency independent
DC conductivity, A is a constant andω the angular pulsation. At higher temperatures and lower frequencies,σDCplateaus are
observed, independent of frequency, which are representative of carrier free transport. They are reached approximately above 293 and 353 K for SMA A and SMA X, respectively. At lower temperatures, the transition to DC plateaus is expected at frequencies below the lower limit of the BDS range. TheσDC component of SMA A at 293 K can be approximated by the value ofσ′ at 0.01 Hz, i.e. 10−10S m−1. TheσDCcomponent of SMA X cannot be extracted at 293 K from this experiment since no plateau is reached at 0.01 Hz.
Figure 7c shows the trend ofσ′ at 0.01 Hz as a function of temperature, as obtained by BDS. The electrical conductivity follows an Arrhenius law (eq 5, where Ea is the activation
energy, kBis the Boltzmann constant, T is the temperature, and σ∞ is a pre exponential factor) approximately above 293 and
353 K for SMA A and SMA X, respectively:
T E k T
( ) exp( /( ))
DC a B
σ =σ∞ − (5)
The activation energy Ea of SMA A and SMA X is approximately 0.5 and 0.8 eV, respectively: SMA A is ca. 2 orders of magnitude more conductive than SMA X, possibly in relation to the different iron content.
As for DC measurements, SMA A also follows an Arrhenius law above 293 K with activation energy of 0.5 eV. Further tests show a slight increase in the DC conductivity under nitrogen with respect to vacuum. The DC conductivity of SMA A under vacuum at 293 K ranges between 5 × 10⁻¹² and 1 × 10⁻¹¹ S m−1, i.e., about 1 order of magnitude lower than the DC conductivity determined from BDS measurements performed at 0.01 Hz. Obtained SMA X results are also presented, but due to long relaxation time (SMA X being much less conductive than SMA A) the DC conductivity value can only be obtained at room temperature. Electrical DC conductivity of SMA X is about 1.4 × 10⁻¹⁴ S m−1, and the BDS activation energy is 0.8 eV. Considering the high complexity of charge transport through a dust layer, as well
as the set of experimental parameters that are very difficult to repeat from one facility to another (e.g., vacuum vs nitrogen, dust packing and electrical contacts), a factor of several tens between BDS and DC results is satisfactory.
For comparison, inFigure 7c, the electrical conductivities of lunar samples 14163,131 and 15301,38 are also reported. Under vacuum, conductivity of lunar sample 14163,131 ranges from 0.2× 10⁻¹⁴to 1.0× 10⁻¹⁴S m−1at 298 K to 10−10S m−1 at 523 K58and conductivity of 15301,38 sample ranges from 6.2× 10⁻¹⁵S m−1at 298 K to 6.2× 10⁻¹³S m−1at 473 K.76As for SMA A and SMA X nanocomposites, both lunar samples follow an Arrhenius law for temperatures ranging from 298 to 473 K. The activation energy of the 14163,131 sample ranges from 0.4 to 0.9 eV.58 Our numerical estimation of the activation energy of the 14163,131 and 15301,38 samples is 0.6 and 0.3 eV, respectively, which is in line with published data for the 14163,131 sample, from 0.4 to 0.9 eV.58
At 298 K, the 14163,131 and 15301,38 samples have an average conductivity of 6.2 × 10⁻¹⁵ S m−1. BDS and DC measurements of SMA A simulant are, respectively, 4 and 3 orders of magnitude higher than values from literature. DC conductivity value of SMA X nanocomposite is higher than the average conductivity by a factor of 2.
Electrical properties of lunar dust can vary from a region to another: for instance, sample 14163,131 was collected during the Apollo 14 mission and is described as a“soil sample”, i.e., composed of both dusts and very small rocks.77 At 298 K, under vacuum, the electrical conductivity of the 14163,131 sample is around 10−15−10−14S m−1and strongly depends on temperature. A correlation between the electrical conductivity and the iron content of a sample was found.78 The higher conductivity of SMA A with respect to the one measured on the 14163,131 and 15301,38 lunar samples could be ascribed to the higher iron content of SMA A. The chemical composition of sample 14163,131 is ∼10 wt % FeO79 and 15301,38 is ∼ wt % FeO.80 To this respect, the proposed synthesis method may be properly tuned in order to vary the type and amount of phases (i.e., Fe0and FeO) present in our nanocomposites, by changing, for instance, temperature and duration of the reductive thermal treatment.61
As a whole, the DC conductivity value of SMA X is very close to literature values, and thus, from the electrical point of view, SMA X is representative of the electrical properties of lunar samples. Another point that should be stressed is that the grains of SMA samples are smaller than 25 μm, whereas 14163,131 and 15301,38 samples have a particle mean size of 73 and 65 μm, respectively. This should be also considered while evaluating the conductivity values.
However, on the basis of the literature and of the physicochemical characterization of SMA A and SMA X nanocomposites, they should not be considered lunar simulants as such, but could be mixed to other simulants to obtain a composition as close as possible to the various typologies of actual lunar samples.
4. CONCLUSIONS
Two nanocomposites containing Fe0nanoparticles embedded in a glassy matrix were obtained by means of an efficient, inexpensive, and scalable synthesis method. Both nano composites showed proper physicochemical properties to be considered as suitable materials to simulate the agglutinitic fraction of regolith, lacking in most of lunar simulants. The so obtained simulated Moon agglutinates (SMA) nanocomposites
(22) Witze, A. NASA Seeks Better Fake Space Dirt. Nature 2017, 547, 146−147.
(23) LEAG CAPTEM. Status of Lunar Regolith Simulant and Demand for Apollo Lunar Samples; Marshall Space Flight Center: Huntsville, AL, 2010.
(24) Esposito, S.; Marocco, A.; Bonelli, B.; Pansini, M. Produzione Di Materiali Compositi Metallo Ceramici Nano Strutturati Da Precursori Zeolitici. Italian Patent MI 2014A000522, 2014.
(25) Esposito, S.; Marocco, A.; Bonelli, B.; Pansini, M. Production of Magnetic Metal Nanoparticles Embedded in a Silica Alumina Matrix. World Patent WO 2015/145230 A1, 2015.
(26) Marocco, A.; Dell’Agli, G.; Esposito, S.; Pansini, M. Metal Ceramic Composite Materials from Zeolite Precursor. Solid State Sci. 2012, 14 (3), 394−400.
(27) Ronchetti, S.; Turcato, E. A.; Delmastro, A.; Esposito, S.; Ferone, C.; Pansini, M.; Onida, B.; Mazza, D. Study of the Thermal Transformations of Co and Fe Exchanged Zeolites A and X by“in Situ” XRD under Reducing Atmosphere. Mater. Res. Bull. 2010, 45 (6), 744−750.
(28) Barrera, G.; Tiberto, P.; Esposito, S.; Marocco, A.; Bonelli, B.; Pansini, M.; Manzoli, M.; Allia, P. Magnetic Clustering of Ni2+ Ions in Metal Ceramic Nanocomposites Obtained from Ni Exchanged Zeolite Precursors. Ceram. Int. 2018, 44 (14), 17240−17250.
(29) Esposito, S.; Dell’Agli, G.; Marocco, A.; Bonelli, B.; Allia, P.; Tiberto, P.; Barrera, G.; Manzoli, M.; Arletti, R.; Pansini, M. Magnetic Metal Ceramic Nanocomposites Obtained from Cation Exchanged Zeolite by Heat Treatment in Reducing Atmosphere. Microporous Mesoporous Mater. 2018, 268, 131−143.
(30) Barrera, G.; Tiberto, P.; Allia, P.; Bonelli, B.; Esposito, S.; Marocco, A.; Pansini, M.; Leterrier, Y. Magnetic Properties of Nanocomposites. Appl. Sci. 2019, 9 (2), No. 212.
(31) Pansini, M.; Dell’Agli, G.; Marocco, A.; Netti, P. A.; Battista, E.; Lettera, V.; Vergara, P.; Allia, P.; Bonelli, B.; Tiberto, P.; et al. Preparation and Characterization of Magnetic and Porous Metal Ceramic Nanocomposites from a Zeolite Precursor and Their Application for DNA Separation. J. Biomed. Nanotechnol. 2017, 13 (3), 337−348.
(32) Pansini, M.; Sannino, F.; Marocco, A.; Allia, P.; Tiberto, P.; Barrera, G.; Polisi, M.; Battista, E.; Netti, P. A.; Esposito, S. Novel Process to Prepare Magnetic Metal Ceramic Nanocomposites from Zeolite Precursor and Their Use as Adsorbent of Agrochemicals from Water. J. Environ. Chem. Eng. 2018, 6 (1), 527−538.
(33) CLASS Exolith Lab. Planetary Simulant Database; https:// sciences.ucf.edu/class/exolithlab/.
(34) Mckay, D. S.; Carter, J. L.; Boles, W. W.; Allen, C. C.; Allton, J. H. Jsc 1: A New Lunar Soil Simulant. Lunar Planet. Inst., Twenty Fourth Lunar Planet. Sci. Conf. 1993, 963−964.
(35) Taylor, L. A.; Pieters, C. M.; Britt, D. Evaluations of Lunar Regolith Simulants. Planet. Space Sci. 2016, 126, 1−7.
(36) Roux, V.; Roth, M. Off Planet Research, LLC.
(37) Taylor, P. T.; Lowman, P. D.; Nagihara, S.; Milam, M. B.; Nakamura, Y. Jurassic Diabase from Leesburg, VA: A Proposed Lunar Simulant. In NLSI Lunar Science Conference, July 20−23, 2008, NASA Ames Research Center, Moffett Field, California; LPI Contribution No. 1415, Abstract No. 2054; 2008.
(38) Stoeser, D. B.; Wilson, S.; Rickman, D. L. Design and Specifications for the Highland Regolith Prototype Simulants NU LHT 1M and 2M; National Aeronautics and Space Administration, Marshall Space Flight Center: Marshall Space Flight Center: Huntsville, AL, 2010.
(39) Battler, M. M.; Spray, J. G. The Shawmere Anorthosite and OB 1 as Lunar Highland Regolith Simulants. Planet. Space Sci. 2009, 57 (14−15), 2128−2131.
(40) Kruzelecky, R. V.; Aïssa, B.; Wong, B.; Haddad, E.; Jamroz, W.; Cloutis, E.; Rosca, I. D.; Hoa, S. V.; Therriault, D.; Ellery, A.; et al. Project Moondust: Characterization and Mitigation of Lunar Dust. In 41st International Conference on Environmental Systems 2011, ICES 2011; 2011; pp 1−19.
(41) Zheng, Y.; Wang, S.; Ouyang, Z.; Zou, Y.; Liu, J.; Li, C.; Li, X.; Feng, J. CAS 1 Lunar Soil Simulant. Adv. Space Res. 2009, 43 (3), 448−454.
(42) Liu, A.; Shi, Z.; Hu, X.; Gao, B.; Wang, Z. Lunar Soil Simulant Electrolysis Using Inert Anode for Al Si Alloy and Oxygen Production. J. Electrochem. Soc. 2017, 164 (2), H126−H133.
(43) Jiang, M.; Li, L.; Sun, Y. Properties of TJ 1 Lunar Soil Simulant. J. Aerosp. Eng. 2012, 25 (3), 463−469.
(44) Sun, H.; Yi, M.; Shen, Z.; Zhang, X.; Ma, S. Developing a New Controllable Lunar Dust Simulant: BHLD20. Planet. Space Sci. 2017, 141, 17−24.
(45) Tang, H.; Li, X.; Zhang, S.; Wang, S.; Liu, J.; Li, S.; Li, Y.; Wu, Y. A Lunar Dust Simulant: CLDS I. Adv. Space Res. 2017, 59 (4), 1156−1160.
(46) Li, Y.; Liu, J.; Yue, Z. NAO 1: Lunar Highland Soil Simulant Developed in China. J. Aerosp. Eng. 2009, 22 (1), 53−57.
(47) Sueyoshi, K.; Watanabe, T.; Nakano, Y.; et al. Reaction Mechanism of Various Types of Lunar Soil Simulants by Hydrogen Reduction. Earth Space 2008 2008, No. 1991, 1−8.
(48) Kanamori, H.; Udagawa, S.; Yoshida, T.; Matsumoto, S.; Takagi, K. Properties of Lunar Soil Simulant Manufactured in Japan. Space 98 1998, 462−468.
(49) Matsushima, T.; Katagiri, J.; Uesugi, K.; Tsuchiyama, A.; Nakano, T. 3D Shape Characterization and Image Based DEM Simulation of the Lunar Soil Simulant FJS 1. J. Aerosp. Eng. 2009, 22 (1), 15−23.
(50) Cesaretti, G.; Dini, E.; De Kestelier, X.; Colla, V.; Pambaguian, L. Building Components for an Outpost on the Lunar Soil by Means of a Novel 3D Printing Technology. Acta Astronaut. 2014, 93, 430− 450.
(51) Marocco, A.; Pansini, M.; Dell’Agli, G.; Esposito, S. Parameters Expediting the Thermal Conversion of Ba Exchanged Zeolite A to Monoclinic Celsian. Adv. Mater. Sci. Eng. 2010, 2010, 683429.
(52) Marocco, A.; Dell’Agli, G.; Esposito, S.; Pansini, M. The Role of Residual Na+ and Li+ on the Thermal Transformation of Ba Exchanged Zeolite A. Solid State Sci. 2011, 13 (5), 1143−1151.
(53) Weidenthaler, C.; Zibrowius, B.; Schimanke, J.; Mao, Y.; Mienert, B.; Bill, E.; Schmidt, W. Oxidation Behavior of Ferrous Cations during Ion Exchange into Zeolites under Atmospheric Conditions. Microporous Mesoporous Mater. 2005, 84 (1−3), 302− 317.
(54) Breck, D. W. Zeolite Molecular Sieves: Structure, Chemistry, and Use; Wiley, 1973.
(55) Dyer, A. An Introduction to Zeolite Molecular Sieves by Alan Dyer; Stewart, A., Ed.; Wiley: Chichester, 1988; Vol. 14.
(56) Dell’Agli, G.; Ferone, C.; Mascolo, G.; Pansini, M. Crystallization of Monoclinic Zirconia from Metastable Phases. Solid State Ionics 2000, 127 (3−4), 223−230.
(57) Esposito, S.; Marocco, A.; Dell’Agli, G.; De Gennaro, B.; Pansini, M. Relationships between the Water Content of Zeolites and Their Cation Population. Microporous Mesoporous Mater. 2015, 202, 36−43.
(58) Strangway, D. W.; Chapman, W. B.; Olhoeft, G. R.; Carnes, J. G. Electrical Properties of Lunar Soil Dependence on Frequency, Temperature and Moisture. Earth Planet. Sci. Lett. 1972, 16, 275−281. (59) Alvarez, R. Lunar Powder Simulator under Lunarlike Conditions Dielectric Properties. J. Geophys. Res. 1973, 78, 6833− 6844.
(60) Marocco, A.; Dell’Agli, G.; Spiridigliozzi, L.; Esposito, S.; Pansini, M. The Multifarious Aspects of the Thermal Conversion of Ba Exchanged Zeolite A to Monoclinic Celsian. Microporous Mesoporous Mater. 2018, 256, 235−250.
(61) Esposito, S.; Dell’Agli, G.; Marocco, A.; Bonelli, B.; Allia, P.; Tiberto, P.; Barrera, G.; Manzoli, M.; Arletti, R.; Pansini, M. Magnetic Metal Ceramic Nanocomposites Obtained from Cation Exchanged Zeolite by Heat Treatment in Reducing Atmosphere. Microporous Mesoporous Mater. 2018, 268, 131−143.
(62) Marocco, A.; Liguori, B.; Dell’Agli, G.; Pansini, M. Sintering Behaviour of Celsian Based Ceramics Obtained from the Thermal
Conversion of (Ba, Sr) Exchanged Zeolite A. J. Eur. Ceram. Soc. 2011, 31 (11), 1965−1973.
(63) Bryan, N.; Lasseuguette, E.; van Dalen, M.; Permogorov, N.; Amieiro, A.; Brandani, S.; Ferrari, M. C. Development of Mixed Matrix Membranes Containing Zeolites for Post Combustion Carbon Capture. Energy Procedia 2014, 63, 160−166.
(64) Charkhi, A.; Kazemian, H.; Kazemeini, M. Optimized Experimental Design for Natural Clinoptilolite Zeolite Ball Milling to Produce Nano Powders. Powder Technol. 2010, 203 (2), 389−396. (65) Liu, Y.; Thompson, J. R.; Taylor, L. A.; Park, J. Magnetic Properties of Unique Apollo 17 Soil 70051. In 37th Annual Lunar and Planetary Science Conference, League City, Texas, 2006.
(66) Nagata, T.; Ishikawa, Y.; Kinoshita, H.; Kono, M.; Syono, Y.; Fisher, R. M. Magnetic Properties and Natural Remanent Magnet ization of Lunar Materials. In Geochimica et Cosmochimica Acta Supplement, Vol. 1. Proceedings of the Apollo 11 Lunar Science Conference 5−8 January; Pergamon Press, Inc.: New York; Houston, TX, 1970; pp 2325−2340.
(67) Pearce, G. W.; Strangway, D. W.; Gose, W. A. Magnetic Properties of Apollo Samples and Implications for Regolith Formation. In 5th Lunar Science Conference; March 18−22, 1974; Pergamon Press, Inc.: New York; Houston, TX, 1974; pp 2815−2826. (68) Brecher, A.; Menke, W. H.; Morash, K. R. Comparative Magnetic Studies of Some Apollo 17 Rocks and Soils and Their Implications. In 5th Lunar Science Conference; March 18−22, 1974; Pergamon Press, Inc.: New York; Houston, TX, 1974; pp 2795−2814. (69) Cremers, C. J. Thermal Conductivity of Apollo 12 Fines at Intermediate Density. Moon 1972, 4 (1−2), 88−92.
(70) Howard, H. T.; Tyler, G. L. Bistatic Radar Observations of the Lunar Surface with Apollos 14 and 15. Abstr. Lunar Planet. Sci. Conf. 1972, 3, 398.
(71) Wagner, K. W. Erklärung Der Dielektrischen Nachwirkungs vorgänge Auf Grund Maxwellscher Vorstellungen. Arch. Elektrotech. 1914, 2 (9), 371−387.
(72) Sillars, R. W. The Properties of a Dielectric Containing Semiconducting Particles of Various Shapes. Inst. Electr. Eng. Proc. Wirel. Sect. Inst. 1937, 12 (35), 139−155.
(73) Sidebottom, D. L.; Roling, B.; Funke, K. Ionic Conduction in Solids: Comparing Conductivity and Modulus Representations with Regard to Scaling Properties. Phys. Rev. B: Condens. Matter Mater. Phys. 2000, 63 (2), 024301.
(74) Jonscher, A. K. The ‘Universal’ Dielectric Response. Nature 1977, 267, 673.
(75) Olhoeft, G. R.; Frisillo, A. L.; Strangway, D. W. Electrical Properties of Lunar Soil Sample 15301,38. J. Geophys. Res. 1974, 79 (11), 1599−1604.
(76) Olhoeft, G. R.; Frisillo, A. L.; Strangway, D. W. Electrical Properties of Lunar Soil Sample 15301,38. J. Geophys. Res. 1974, 79 (11), 1599−1604.
(77) Lunar Sourcebook: A User’s Guide to the Moon; Heiken, G. H., Vaniman, D. T., French, B. M., Eds.; Press Syndicate of the University of Cambridge: New York, 1991.
(78) Schwerer, F. C.; Huffman, G. P.; Fisher, R. M.; Nagata, T. Electrical Conductivity of Lunar Surface Rocks Laboratory Measurements and Implications for Lunar Interior Temperatures. In Lunar Science Conference, 5th, Houston, Tex., March 18−22, 1974; Pergamon Press, New York, 1974; pp 2673−2687.
(79) Meyer, C. 14163 Bulk Soil Sample 7,776 Grams. The Lunar Sample Compendium, 2011.
(80) Meyer, C. 15301 Soil 1244.1 Grams. The Lunar Sample Compendium, 2010.