Any correspondence concerning this service should be sent
to the repository administrator:
[email protected]
This is an author’s version published in:
http://oatao.univ-toulouse.fr/27026
To cite this version: Van der Laan, Adrie and Boyer, Valérie and
Epherre, Romain and Estournès, Claude Simple method for the
identification of electrical and thermal contact resistances in spark
plasma sintering. (2021) Journal of the European Ceramic Society, 41
(1). 599-610. ISSN 0955-2219
Official URL
DOI :
https://doi.org/10.1016/j.jeurceramsoc.2020.08.073
Open Archive Toulouse Archive Ouverte
OATAO is an open access repository that collects the work of Toulouse
researchers and makes it freely available over the web where possible
Original Article
Simple method for the identification of electrical and thermal contact
resistances in spark plasma sintering
A. Van der Laan
a,
h,
V. Boyer
\
R. Epherre
h,
C. Estoumès
a'
*
• CIRIMAT, Universi.té de Toulouse, CNRS, Université Toulouse 3 - Paul Sabatier, 118 Route de Naibonne, 31062, Toulouse cedex 9, France b Norimn� 51 Rue de !'Innovation, 31670, Labège, France
ABSTRA CT
Keywords:
Spark plasma sintering Contact resistances Complex shapes Modelling
The electrical and thermal contact resistances are key parameters for obtaining an accurate electro-thermal mode! of the spark plasma sintering (SPS) process. However, due to the Jack of a general expression, these pa rameters are usually determined empirically. Thus, they are only valid for a specific material and SPS config uration. A simple method based on a limited amount of experiments as well as a new formulation of the electrical and thermal contact resistances are developed. First, the evolution of those resistances is optimized on simple shapes (pellets) experiments. They are then transferred into the electro-thermal simulation of complex shapes configurations, which showed a good agreement between the experimental and computed data.
1. Introduction
Spark plasma sintering (SPS) is a powder consolidation technique that can produce fully dense materials within minutes and at lower production costs compared to other conventional techniques [1]. The application of uniaxial pressure combined with a pulsed direct current allows the sintering of powders or porous materials such as ceramics, refractory metals, or intermetallics at a temperature lower than their melting temperature [2,3]. Compared to conventional sintering, the SPS allows to lower the consolidation temperature as well as the processing time. One of the benefits is to keep a fine microstructure throughout the process, which can enhance the mechanical properties of the material
[4-6].
Since the 2000s the number of publications regarding numerical modeling of SPS has significantly increased because it can offer several benefits and possibilities [7]. One is the determination of the tempera ture and the current that goes through the SPS column ( comprised of the electrodes, spacers, punches, die and sample) [3]. After a thorough calibration, it allows a better understanding of the mechanisms involved and the mode! can then be used as a predictive tool for other experi ments. Such a tool would then help reducing thermal gradients in the sample, which would lead to more homogeneous densification and microstructure.
Severa! authors have identified the electrical and thermal contact resistances (ECR and TCR respectively) as crucial parameters to obtain a
* Corresponding author.
E-mail address: [email protected] (C. Estournès).
good thermo-electrical model of the process [8]- [13]. Those resistances can be found at each interface between each part of the SPS apparatus (tooling parts and sample). A theoretical expression of the ECR and TCR could be used [10,14], but is difficult to implement in the mode! due to the presence of parameters like the lateral pressure or the specific sur face area of the contact that cannot be determined experimentally. Thus, they are usually evaluated empirically and are only valid for a specific machine, configuration, or material. A formulation developed with a certain configuration of the SPS apparatus are usually not transposable to another machine or material. Therefore, the objective of this study is to develop a simple approach based on an optimization algorithm to determine the ECR and TCR of an SPS apparatus. With this method, an accurate electrothermal mode! of the sintering of a material by SPS can be obtained with only one experimental trial. Furthermore, the contact resistances numerically identified can then be used for any complex configuration provided that the same tooling (die and punches) and experimental conditions (pressure and heating rate) are employed. The benefits of this method are its ease of use as well as its versatility in terms of materials, which are not only limited to ceramics. To validate the mode! and demonstrate its feasibility, it is first calibrated on three different configurations of alumina samples and one titanium aluminide pellet. Then, the contact resistances optimized on simple pellets are tested on more complex bi-material configurations to show the effi ciency of the approach.
2. Materials and methods
Ail the sintering experiments were performed on the SPS machine Dr. Sinter 2080 (Japan) located at the Plateforme Nationale CNRS de Frit tage Flash (University of Toulouse III - Paul Sabatier).
The graphite used for the dies, spacers and punches was provided by Toyo Tanso©. For ail experiments, a 200 µm graphite foil (PERMA FOIL®Toyo Tanso) was placed to cover the inside wall of the die, as well as at the interfaces between the punches/sample and spacers/electrodes. A graphite felt is placed ail around the outside wall of the die to mini mize the heat loss during the experiment. The two different materials used, were one ultra-pure alumina (99.9 %, spray-dried granulates with an average crystallite size of 150 nm and a mean granulate size of 35 µm, from Nanoe) and a titanium aluminide powder (Ti-4822-9, with an average grain size of 75.4 µm, from Praxair).
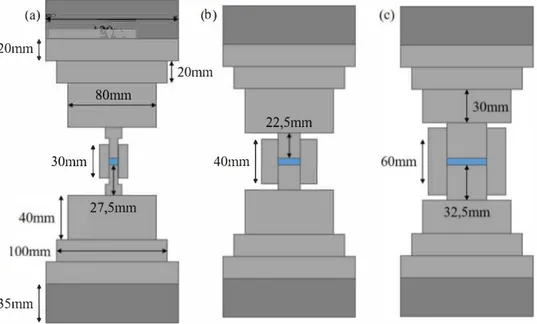
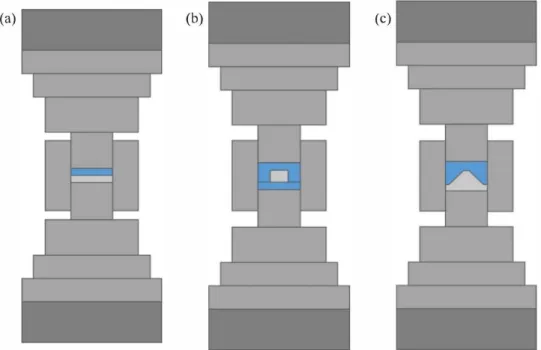
Two different sets of experiments were performed in this work. The first one is conducted to calibrate the thermo-electrical model and the second one to test its efficiency on more complex configurations. The first set of experiments consists in the sintering of 3 mm thick pellets of alumina and TiAl inside dies of different diameters (i.e. 8, 20 and 36 mm). The different setups are illustrated Fig. 1. For the 8 mm setup, T shaped punches were used for the stability of the assembly. The second set of experiment, on which the model will be tested consists in three different configurations illustrated Fig. 2. The first configuration con sists in the sintering of a bi-material pellet composed of a pre-sintered alumina pellet on top of a TiAl powder. For the three configurations, the alumina part was pressed and then sintered at 1000 °C for 1 h in a Nabertherm© oven up to a 50 % density. The goal ofthis step is to pre sintered the alumina so that it acquires a minimal mechanical strength. This allows its manipulation and facilitates the setting up of the bi material samples. The second set-up is composed of a 15 mm diameter TiAl pellet (in powder form) enclosed in a pre-sintered alumina part (which is composed of two pieces as illustrated Fig. 2b). The last configuration is a TiAl star-shaped object placed under an alumina counter-part. This set-up relies on the patented sintering technique developed in the work of C.Manière et al. [15] that allows the fabrica tion of complex shapes by SPS. The counter-part is first pressed in a 36 mm die with a suitable punch and then pre-sintered. The TiAl powder is then introduced in the counter-part and the whole assembly is then sintered.
For ail configurations, the current delivered by the SPS generator, during ail the thermal cycle is acquired by the SPS machine. It is
(a) 20nun
l
11 ,,;a 0i -
- -\-:• -_
-80mm
(b) 20mmimportant to note that the current measured by the SPS machine cor responds to the average value of the current. The actual current responsible for Joule heating of the apparatus corresponds to the root mean squared (rms) value of the current [14,16]. To switch from the average to the rms value of the current the same corrective factor as A. Pavia et al. [16] was used since it was determined on the same SPS machine. For the experimental validation, the choice bas been made to work with the current and not the voltage, since the SPS machine used in this study is a current generator and not a voltage generator. A previous study of the machine has showed that a precise current measurement is easier [16]. However, depending on the machine, in some cases it is better to work with the voltage instead of the current [17].
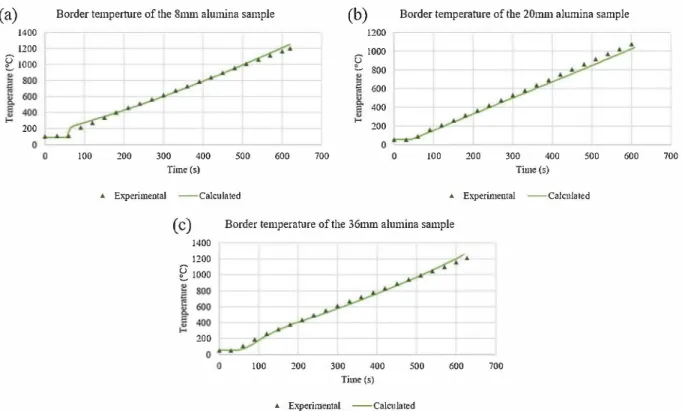
For the first set of experiments, the temperature was measured at three different locations in the die (as illustrated Fig. 3 (a)) with K thermocouples. One is placed in a hole located in the outside wall of the die (1.5 mm in diameter and 3 mm in depth) to measure the control temperature, which is used by the SPS machine for the current regula tion. For each configuration, the two other thermocouples are placed inside the powder sample. One in the middle and one located 1 mm away from the inside wall of the die (Fig. 3 (b) and (c)), through holes drilled across the die walls. The three thermocouples are placed 120° away from each other, as showed Fig. 3 (a). These two measurements are used to fit the thermo-electrical model.
For the second set of experiments, besides the control temperature being measured in the die (like the previous one), the temperature was also measured in the TiAl powder and the pre-sintered alumina. For the bi-material pellet, the temperature was measured at the center of each pellet (Fig. 3 (d)). For the TiAl pellet enclosed in the alumina, the temperature was measured in the center of the TiAl and 5 mm away from the inside wall of the die (Fig. 3 (e)). For the last configuration the temperature was taken in the middle of the star-shaped TiAl and 3 mm away from the inside wall of the die (Fig. 3 (f)).
For each experiment, the pressure is applied linearly from O to 25 MPa in 3 min. The higher the applied pressure is, the lower the contact resistance is. However, since holes were drilled across the die wall, an important pressure is more likely to break it. Then, the pressure is held for the rest of the experiment. For the calibration trials, after the pres sure build-up, the setpoint temperature (measured on the die outside wall) is set to increase at a rate of 100 °C/min from room temperature up to 1200 °c, the thermocouple upper use limit. For the three complex configurations, the pressure was linearly applied during the first five minutes of temperature rise. Ail experiments where stopped whenever
22,5mm
30nun
I
40mm [27,5mm
35mm
I
(a) (b) (c)
Fig. 2. Cross section of the three complex configuration - (a) bi-material alumina/TiAI pellet, (b) TiAl pellet encapsulated in alumina and (c) TiAl star-shaped object with an alumina counter-part.
--- tilermocouple
(b)
-
---
(c),---,
(e)
---(d)
---Fig. 3. Position of the thermocouples in the die for the calibration trials (a), the alumina pellet (b), the TiAI pellet (c), the bi-material pellet (d), the TiAI encapsulated (e) and the star-shaped object (f).
one of the thermocouples used as reached the 1200 °C. The regulation of the set-point temperature is obtained through PID regulation on the root mean square of the current delivered during the SPS experiment [18]. Thanks to a good PID regulation, the measured temperature (as well as the calculated one) accurately follows the set-point temperature. Thus, to facilitate easy reading of the results, the temperature of the outside wall of the die will not be showed in the results.
3. Theory/calculation
All the computational work was done on Comsol Multiphysics© software. The SPS process was modeled using a finite element analysis considering only the thermal and electrical aspects of the process. The model used for the FEM calculations is 2D-axisymetric and the geometry was treated as a union. For each simulation, in addition to the materials parameters, the input variable is the setpoint temperature taken on the outside wall of the die (heating ramp oflO0 °C/min up to 1200 °C) while the output parameters are the Current and Temperatures (at the border and center of the sample). Even though powder was used for the ex periments, the sintering aspect of the process was neglected. A pre liminary unpublished study has showed that the creep and sintering considerations have a very limited effect on the calculated temperature
and current (only a difference of less than 1 o/o is introduced). 3.1. Thenno-electrical simulation
During the SPS, most of the heat is generated by Joule heating when the current flows through the colurnn. The constitutive thermal and electrical equations, as well as their coupling, has been widely studied in the literature [3, 19]. The general heat equation applied to a volume V with a surface S can be written as follow:
Where p is the density, Cp the specific heat, T the temperature and k the thermal conductivity. This equation is usually paired with the charge conservation equation [19]:
'ï!J =0 (2)
The coupling between the thermal and the electrical aspect of the problem is achieved by the second term on the right-hand side ofEq. (1), which describes Joule heating. It depends on the electrical field Ê and
the current density
J
as follow:qe = Ê.J (3)
The boundary conditions are contained in the last term ofEq. (1).
q,,
CÏconv• CÏr et cie, are respectively the thermal conduction, convection and radiation and the heat transfer induced by imperfect contacts between the bodies of the SPS column. The last one will be developed later in this paper. The heat is radiated to the surroundings from the surface of each component, whereas the cooling of the two electrodes is obtained by convection using a water cooling circuit:(4)
Where cr, is the Stefan-Boltzman constant, e the emissivity and hc the convection coefficient. Te is the emission surface temperature, Ta the chamber temperature, T5 the electrode surface temperature and Tw the
water cooling temperature.
The convection coefficient is set at 200 W/(m2.K) and the emissivity
of the electrodes, the graphite tooling and the graphite felt are 0.71, 0.8 and 0.3 respectively [20]. The electrical and thermal properties of graphite, Inconel, alumina and TiAI used in the simulation of the process are summed up in Table 1 [21]. The porosity dependence of the prop erties for the alumina and titanium aluminide was the same as in the work of R.Orrù et al. [3]. As a first approximation the porosity was assumed constant and equal to the compacted bulk density of the powders, which are 50 % for the alumina and 65 % for the titanium aluminide. Furthermore, it is important to note that compared to bulk graphite, which is isotropie [22], the electrical and thermal conductivity of the graphite foi! are respectively about 40 and 140 times superior parallel to the surface according to the producer Toyo Tanso©. 3.2. Theory on contact resistances
Thermal and electrical contact resistances (TCR and ECR respec tively ), are induced by imperfect contacts between two interfaces. In an ideal situation, when two objects are in contact, the current can flow freely through the interface from one element to the other. Thus, there is neither current nor temperature discontinuities at the interface. How ever, in a real contact, only a fraction of the surface allows the current flow due to surface asperities. This is called the specific surface area. It leads to a discontinuity of the electrical potential and the temperature. Though, it is easier to work with the expression of the electric and thermal fluxes at the interface since it is difficult to experimentally determine the specific surface area.
{ f = Œg(V1 - V2)
IÎc = h8 (T1 -T2) (5)
Where Œg and hg are the electrical and thermal contact conductance, and Vx and Tx are the electrical potential and the temperature on both sides (x = 1 & 2) of the interface.
Table 1
Physical properties of inconel, graphite, alumina and TiAI.
Material Heat Thermal Electrical Density
capacity (J. conductivity (W. resistivity (Q.m) (kg. m-3) kg-'. r') m-1• K-1) Inconel 344 + 2.50 10.1 + 1.57 X 9.82 X 10-7 + 1.60 8430 X 10-l T 10-2 T X 10·10 T Graphite 34.27 +2.72 123 - 6.99 10-2 1.70 X 10-S - 1.87 1904-T- 9.60 X T + 1.55 X 10·5 X 10·• T + 1.26 X 0.01414 T 10-•r T2 10·!1 T2 - 2.44 X 10-IST3 Alumina 850 39,500 T - 1.26 8.70 X 10¹⁹ r482 3899 TiAI 583 + 9.40 9.47 + 1.19 X 4. 06 X 10-7 + 6.45 3900 X 10-2 T 10-2 T X 10·10 T
All the contact resistances that were considered in the mode! are summed up in Fig. 4. For all the horizontal contacts: electrode/spacer, spacer/spacer, spacer/punch and punch/sample, the values of the electrical and thermal resistances used were the ones developed by C. Manière et al. [12]. However, it has been showed that the impact of the contact resistances on the final electrothermal simulation is negligible at high pressures (>10 MPa) [19,23]. Thus, even if it does not fully correspond to the actual values of the resistances, it would only have a negligible impact on the outcome of the simulation.
The crucial parameters in the thermo-electrical mode! are therefore, the vertical TCR and ECR punch/die and sample/die. The graphite foi! placed on the inside wall of the die greatly influences the electro-thermal behavior of the SPS column. A great amount of current flows through it which leads to a localized heating of the foi! due to the TCR between the graphite foi! and the die, punches and sample [21]. Thus, the contact resistances were considered on both side of the graphite foi!. Those re sistances, directly linked to the pressure between the two objects in contact, are very difficult to evaluate experimentally. However, vertical contact resistances in the SPS have been studied in the literature. First, they were considered as constants with temperature and pressure [8,9]. However, the contact pressure varies over the SPS trial as the temper ature increases and thus as the materials creep. Then, a temperature and pressure dependence were introduced in the expression of the ECR and the TCR [10,14]. However, most of the time those expressions are difficult to implement in the mode! due to the presence of unknown parameters that cannot be determined experimentally. Thus, the ex pressions of the ECR and TCR can be determined empirically while keeping a temperature dependence [11,13]. Nevertheless, those ex pressions only correspond to a specific SPS configuration or material. To have a good grasp on the issue, the evolution of the current and tem peratures in alumina samples with sizes of 8, 20 and 36 mm was modelled using the ECR and TCR determined by C. Manière et al. [12]: {
ECRpunch/die (O.m2) = dpap(l, 7(.10-3 -9
�:��0�
7:))Fe
TCRpunch/die (m2.K/W) =d
pap 80+50 T-SO Fr
(6)
Where dpap is the thickness of the graphite foi!, and F, and Fr are dimension dependent factors.
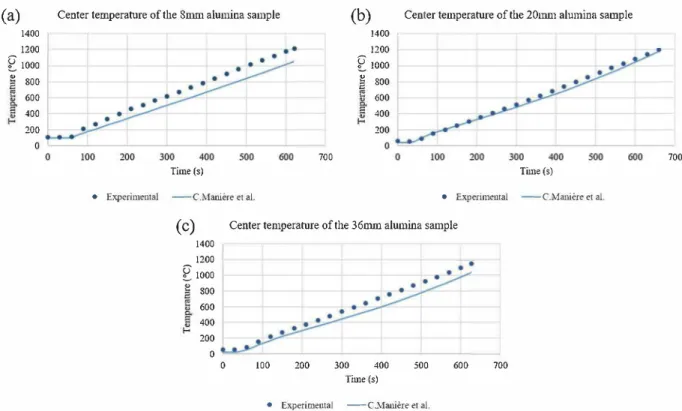
Fig. 5, Fig. 6, Fig. 7 illustrate the difference between the experi mental and calculated data. In their work those resistances where also determined with alumina samples and on the same machine used for this study. However, C. Manière et al. [12] work was performed on samples sizes of 10, 20 and 30 mm in diameter, with homothetic dies configu rations, which is not the case in the present study.
ECR & TCR electrode/spacer
ECR & TCR spacer/punch ECR & TCR punch/sample
ECR & TCR sample/die
ECR & TCR punch/die
(a)
500 400 � 300 il !:; 200 G(a)
1400 1200t
1000�
800 E 600 400 200 0Current delivered through the SPS column - 8mm
alumina sample
(b)
Current delivered through the SPS column - 20mmalumina sample100 200 300 400 500 600 700 Time (s) 2000 � 1500
5
� 1000B soo
!00 200 300 400 500 Time(s)• Experimemal --C.Manière et al. • Experimental --C.Manière et al.
(c)
3500 3000<
2500 i2000 1; 1500 8 1000 500 0 0Current de!ivered tlu:ough the SPS co!umn - 36mm alumina sample
100 200 300 400 500 600
Time (s)
• Experimentnl --C.Manière et al.
700
600
Fig. S. Evolution of the current through the SPS column for 8 mm (a), 20 mm (b) and 36 mm (c) diameter alumina samples.
Center temperature of the 8mm alumina sample
Time (s)
• Experimental --C. Manière et al.
700
(b)
Center temperature of the 20mm alumina sample 1400 1200t
1000�
800 E 600 400 200 Tune (s) • Experimeotal --C.Manière et al.(c)
Center temperature of the 36mm alumina sample 1400 1200t
1000�
800 600 400 200 0 0 100 200 300 400 500 600 700 Tune (s)• Experimental --CJ,1anière et al.
Fig. 6. Evolution of the temperature at the center of alumina pellets with a 8 mm (a), 20 mm (b) and 36 mm (c) diameter.
3.3. Detennination of the ECR and TCR
700
700
The significant difference with the experimental data shows that the expression developed by C. Manière et al. [12] only corresponds to a certain type of configuration, specific to a die, spacer, punch and sample size. Since a general formulation for the contact resistance has not been found yet, it is important to develop an effective way to determine the vertical ECR and TCR in any configuration.
Looking at the expressions of the TCR and ECR Eq. (6), it appears that they are both decreasing function with temperature. However, the ECR is a linear function, which is an issue above 1500 °c because the resis tance becomes negative. For the scope of this study, a new form of the TCR and ECR was introduced. For both expressions, a decreasing
(a)
Border temperture of the 8mm alumina sample 1400 1200E
1000 !:! 800 600 400 200 700 Tune (s)" Experimeutal -C.Manière et al.
(b)
1400 1200E
1000 !:! 800l
600 ~ 400 f-s 200Border temperature of the 20mm alumina sample
100 200 300 400 500 600 700 Time (s)
" Experimental -C.Manière et al.
(c)
Border temperature of the 36nun alumina sample1400 1200
E
1000 !:! 800 600 400 i!! 200 0 0 100 200 300 400 500 600 700 Time(s)• Experimental -C.Manière et al.
Fig. 7. Evolution of the temperature 1 mm away from the side of alumina pellets with a 8 mm (a), 20 mm (b) and 36 mm (c) diameter. exponential fonction was chosen as follow:
{
ECR �Q.m2)=
aeexp(
-
be.T)TCR (m .K/W)
=
arexp(-
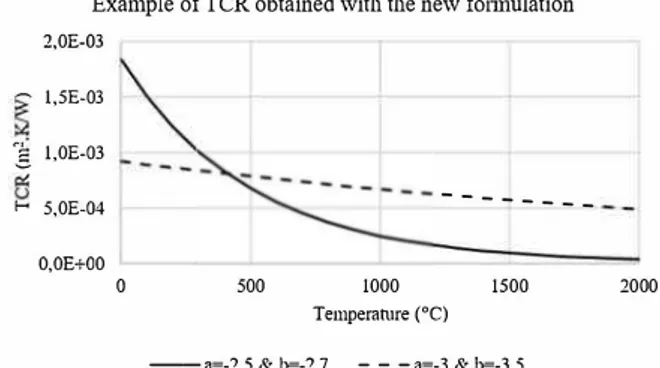
br.T) (7)The a,,, be, ar and br are parameters to be determined and ECR and TCR are strictly positive. The benefit of this expression is that given the right couple of parameters a and b, it can approximate the two types of fonction seen previously, as illustrated Fig. 8.
First, only the sample of alumina is considered. Due to its low elec trical conductivity it is assumed that no current flows between the graphite and the sample. Thus, only the ECR punch/die, and the TCR punch/die and sample/die need to be determined, which means there are six parameters to be found. A Nelder-Mead algorithm with bounded variables was used to calculate those six parameters [24,25]. This al gorithm is used to minimize a least square fonction, which compares the calculated values to the experimental ones. The data used for the opti mization are the evolutions of the current and the temperatures at the center and the border of the sample. The initial guess for the parameters, required by the algorithm, was chosen according to the approximated values found in the literature [12]. Then, the ECR punch/die is
Example ofTCR obtained with the new fonnulation
2,0E-03 - l,5E-03
§
1,0E-03 f-- 5,0E-04 0,0E+00 0 500----
----1000 Temperamre (°C) 1500
--a--2.5 & lr-2.7 - - -a--3 & lr-3.5
2000
Fig. 8. Illustration of the different functions that can be obtained with the new formulation of contact resistance.
optimized thanks to the experimental current values, and the TCR punch/die and sample/die thanks to the temperature values. Since all the vertical ECR and TCR are intricate (a change in the TCR or the ECR can affect the current or the temperature respectively), after the two optimizations, a global one with all the parameters and experimental data (with the updated initial guesses) is run to verify the convergence of the algorithm.
4. Results and discussion
The end goal of this study is to obtain an accurate thermo-electrical model of the sintering of complex shapes by SPS. The principle of the method developed in this work is to optimize the ECR and TCR on simple shapes (that requires few experimental tests). This needs to be done on both materials that are used in the complex shapes configuration, because the ECR and TCR might differ from one material to another. Then, the optimized ECR and TCR are used to predict the thermo electrical behavior of complex shape configurations. For example, with only one experimental trial on a 36 mm alumina pellet and one on a 36 mm titanium aluminide pellet, it is possible to obtain an accurate electrothermal model of any complex configuration using the same materials, configuration (with identical die, punches and spacer sizes) and experimental conditions (pressure, heating rate).
4.1. Calibration results for the alumina samples
The comparison between the experimental and the calculated values of the current and the temperatures with the new expression of the ECR and TCR are plotted Fig. 9, Fig. 10, Fig. 11. The experimental and calculated voltage was also added in Fig. 9 but to facilitate easy reading of the results, only the current will be shown for the rest of the study. In the same way as the current, the calculated voltage was obtained using a corrective factor determined by A. Pa via et al. [16]. This factor allows to model the actual voltage measured outside the power source by the SPS machine. The experimental measurements show that the 20 mm alumina sample reach a lower temperature than the two other config urations. This could be due to the ratio internai diameter/thickness of
(a)
Evolution of the current and voltage for an 8mm aluminasample
(b)
Evolution of the current and voltage for an 20nun alumina sample400 � 300 � 200
a
100(a)
1400 1200 � 1000 � 800 ë 600 400 200 0 0 -1 700"
Ë' ë 1500 1250 � 1000 E 750�
ë 500 250 0j
l
-11
100 200 300 400 500 600 0 Titre de l'axe 100 200 300 400 Titre de l'axe 500 600 700■
Current: experimental --Current: calculated• Voltage: e xperimental--Voltage: calculated
■
Current: experimental --Current: calculated• Voltage: experimental--Voltage: calculated
(c)
Evolution of the current and voltage for an 36mm aluminasam.ple 3500 3000
<
2500 ';' 2000g
1500 ê 1000 500 3 � 2 � 0 0 -=---�---'---'---'---'- -1 0 100 200 300 400 500 600 Titre de l'axe■
Current: experimental --Current: experimental• Voltage: experimental --Voltage: calculated
700
Fig. 9. Evolution of the voltage and the current through the SPS column for 8 mm (a), 20 mm (b) and 36 mm (c) die sizes.
o
Center temperature of the 8mm alumina sample
(b)
Center ternperantre of the 20mm alumina sample100 200 300 400 500 600 700 Time (s) • E,perimental --Calculated 1200 � 1000 u !!- 800 f:: a 600
ia"'
400 � 200 100 200 300 400 500 Timc (s) • Experimental --Calcula ted(c)
Center temperature of the 36mm alumina sample1400 1200
E
1000�
800 600 400"
200 0 0 100 200 300 400 500 600 700 Time (s) • Experimentol --CalculatedFig. 10. Temperature at the center of alumina samples with a size of 8 mm (a), 20 mm (b) and 36 mm (c).
•
600 700
the die that is not homothetic compared to the two other configurations. For ail three configurations (diameters of 8, 20 and 36 mm), there is a good agreement with the experimental value, which is much better than the one showed in Fig. 5, Fig. 6 and Fig. 7. The evolution of the current, the voltage and the border temperature are well simulated by the mode!. As for the temperature in the middle of the samples, the mode! is a bit Jess effective, but the results are still acceptable and give a good
approximation of the experimental values. This shows the efficiency of this method thanks to its dual identification through both current and temperature. Thus, only one experiment is needed to assess the contact resistance, and therefore the thermo-electrical behavior of the SPS apparatus.
To make sure the Nelder-Mead algorithm converged to an adequate solution, a mapping of the error with the experimental current values
(a)
1400 1200
E
1000 200Border temperture of the 8mm alwnina sample
100 200 300 400 500 600 700
Time (s)
• Experimenral -Cakulated
(b)
1200 � 1000 u � 800 600 400 f--200Border temperature of the 20mm alumina sample
100 200 300 400 500 600 700
Time (s)
• Experimental -Calcnlared
( c)
Border temperature of the 36mm alumina sample1400 1200
E
1000 200 100 200•
300 400 500 600 700 Time (s) • Experimental -CakularedFig. 11. Temperature 1 mm away from the border of alumina samples with a size of 8 mm (a), 20 mm (b) and 36 mm (c). was plotted for the different (ae, be) couples the algorithm explored. The
mapping was also completed with a Monte-Carlo algorithm, which calculated the same error but chose random (a., be) couples within the bounds fixed. Fig. 12 shows that the algorithm converged to the best solution within the bounds.
The evolution of the ECR punch/ die and TCR punch/ die and sample/ die are plotted in Fig. 13. The fact that there is no obvious relationship between the parameters can be explained by the non-homothetic rela tion between the three configurations. If the expressions here only depend on the temperature, the influence of the pressure and the specific surface area is implicitly contained in those equations. If the uniaxial pressure is identical for the three configurations, the lateral pressure on the die differs, and thus the contact resistances are different.
4.2. Calibration results with the TiAl samples
The contact resistance assesses the ability of an interface to let the current flow or conduct temperature. Hence, the ECR and TCR punch/
-1.5 -2.0 -2.5
"'
.Q -3.0 -3.5 -4.0 -4.5Cumulated error on the
experimental current
-7.5 -7.0 -6.5 -6.0 -5.5 -5.0 -4.5 ae 8.75 8.50 8.25-...
8.00 O... ...
7.75 !=!,_ Cl 7.50 .2 7.25 7.00Fig. 12. Illustration of the cumulated error between the experimental and calculated values for several aefbe couples.
606
die will be considered as identical for an alumina sample and a TiAI one. Actually, there could be a slight difference since the two sample do not have the same dilation coefficient. The TiAl tend to apply a higher pressure on the die due to its higher dilation coefficient. Thus, the lateral pressure at the interface between the punch and the die could be slightly lower with a TiAI sample, but this effect is neglected in this work.
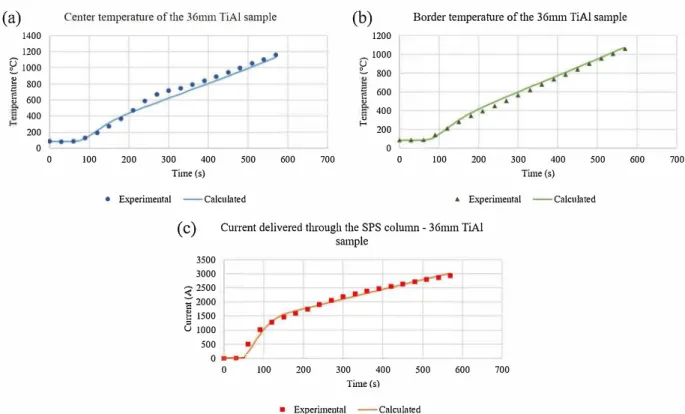
For the alumina sample, the ECR sample/die was neglected because of its insolating properties. This assumption is no more valid for a conductive sample like a TiAl powder. The same optimization strategy was used to determine the ECR and TCR sample/die (the ECR and TCR punch/die were the one identified with the alumina sample). Fig. 14
shows the comparison between the experimental and calculated values of the current flow and the temperature at the center and the border of the TiAI sample with the optimized ECR and TCR. The evolution of the current and the border temperature can be well approximated by the mode!. As for the center temperature, the experimental values show a fast increase in the temperature range of 500-750 °C. One explanation could be the percolation of the TiAI powder which makes the thermal conductivity of the sample suddenly increase. Thus, one way to improve the mode! would be to consider the effect of the porosity evolution on the materials properties. However, even if the simulation is not able to replicate this phenomenon, the agreement with the experimental values is still acceptable. Testing the mode! on complex shapes
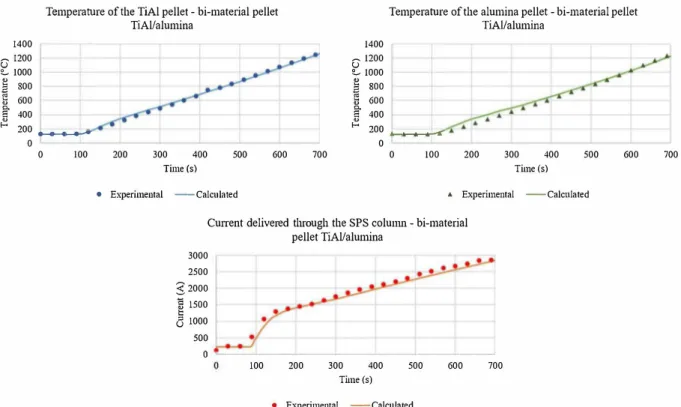
One of the objectives of this study is the identification of the ECR and TCR for both alumina and TiAI in order to be able to predict the thermo electrical behavior of the sintering of complex shapes by SPS. The un known here is the contact resistance at the interface between the alumina and the TiAI. However, the ECR alumina/TiAI can be neglected due to the insulating aspect of alumina. Also, as mentioned before, the horizontal ECR and TCR have a limited impact on the final calculations of the mode!. Thus, for the rest of the study, the ECR alumina/TiAI will be neglected and the TCR alumina/TiAI will have the same order of magnitude has the punch/sample TCR.
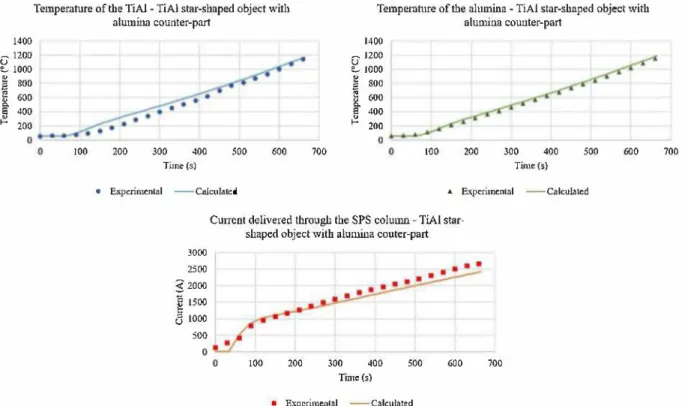
Fig. 15, Fig. 16, Fig. 17 show the evolution of current and temper atures for the three complex configurations. The temperatures calcula tions are in a good agreement with the experimental data, but it appears that there is a slight gap between the calculated and experimental
(a)
4,0E-02 3,SE-02TCR punch/die - alumina sample
::," 3,0E-02 � 2,SE-02 '.§_ 2,0E-02 � l,SE-02 1-- l,OE-02
:.�
o:�:
:::: : : : :
: 1 1 1e
, ,
r 0 200 400 600 800 1000 1200 1400 Tempemnire (0C) --+--d=a8nun --+-d-20nun d=a36nun(b)
4,5E-02 4,0E-02�
3,5E-02 3,0E-021
2,SE-02 2,0E-02""
1,5E-02g
1,0E-02 5,0E-03 O,OE+OO 0TCR sample/die - alumina sample
200 400 600 800 1000 1200 1400
T enipemture (0C)
d-36nun
(c)
ECR punch/die - alumina sample 4,0E-06 3,0E--06 12,0E-06 l,0E-06 O,OE+OO 0 200 400 600 800 Tcmpcmn,rc (°C) 1000 1200 1400--+--d-81\llU ---+---d-20min d=a36mm
Fig. 13. Evolution of the TCR punch/die, sample/die and the ECR punch/die for different sizes of alumina samples.
(a)
Center temperature of the 36mm TiAI sample 1400 1200E
1000 1' 800 E�
600 400 200 0 0 100 200 300 400 500 600 700 Time (s) • Experimental --Calculated(b)
1200 � 1000t
800 E 600�
400�
200 0Border temperature of the 36mm TiAI sample
L.._
0 100 200 300 400 500 600 700 Time (s)
• Experimental --Calculated
(c)
Current delivered through the SPS column - 36mm TiAIsample 3500 3000
<
2500 ';;' 2000g
1500B
1000 500o
---
-�---�--
�
0 100 200 300 400 500 600 700 Tune (s) ■ Experimental --Calc11latedFig. 14. Evolution of the temperature at the center (a), the border (b) and the current (c) of the sintering of a 36 mm TiAI pellet. current values. This gap might be explained by the pressure application
method. For the calibration experiments, the uniaxial pressure was applied before the increase in temperature whereas for the three com plex configurations the pressure was applied during the first five mi nutes of temperature rise. It appears that it can significantly affect the evolution of the current during the SPS trial. Moreover, the creep of the different materials involved can affect the lateral pressure and thus the
contact resistances. The pressure dependence of the contact resistances was not considered in this study, but it is implicitly contained in the expressions of the ECR and TCR. Thus, those expressions are only valid for a specific set of experimental conditions (pressure, heating rate, tooling size, etc.), and a change in those conditions would require further experimental trials. In addition, aging and wear of the tooling (which were not considered in this work) could also affect the interface
1400 Û 1200 � 1000 1c! 800 � 600
S
400Temperature of the TiAl pellet - bi-material pellet TiAl/alumina 1400 Û 1200 � 1000 � 800 � 600
S
400Temperature of the alumina pellet - bi-material pellet TiAl/alumina
� 200 --- � 200 .........
-..-0
0 100 200 300 400 500 600 700 0 0 100 200 300 400 500
Time (s) Time(s)
• Experimental --Calculated .o Experimental --Calcnlated
3000 2500
5
2000 ij 1500 t:8
1000Current delivered through the SPS column - bi-material pellet TiAl/alumina 500
o---�---100 200 300 400 500 600 700 Time(s) • Experimental --Calculated 600 700Fig. 15. Evolution of the temperature at the center of the alumina (a) and TiAl (b) pellet and the current through the SPS column (c) for the bi-rnaterial pellet configuration.
Temperature of the TiAI pellet - TiAI pellet encapsulated in a alumina counter-part 1400 Û 1200 � 1000 � 800
i
600 � 400 � 200 200 400 600 800 1000 1200 Time(s) • E;xperin.iental --Calculaled 1400 1400 Û 1200 � 1000 � 800 [ 600a
400 � 200 0Temperature of the alumina counter-part - TiAI pellet encapsulated in a alumina counter-part
0 200 400 600 800 1000 1200
Titne (s) • E:x:perimental --Calculatcd
1400
Current delivered through the SPS column - TiAI pellet encapsulated in a alumina counter-part
2500 2000 � 1500 � 1000
8
500 0 0 200 400 600 800 1000 1200 1400 Titne (s)■ Experimental --Calcula ted
Fig. 16. Evolution of the ternperature of the TiAI pellet (a) and the alumina counter-part (b) and the current (c) through the SPS colurnn for the TiAl encapsulated pellet configuration.
and thus the contact resistances. To improve the model, further inves tigation has to be done to extrapolate the pressure influence on the contact resistances.
However, it appears that using the ECR and TCR calculated previ ously with the alumina and TiAI pellets give a pretty accurate evolution
of the thermo-electrical behavior of the SPS experiments with complex configurations. It also shows that the expressions of the ECR and TCR are robust with different configurations. With only two experiments, it is possible to predict accurately predict the evolution of the current and temperature for multiple configurations.
1400 Û 1200 � 1000 _§ 800
1
600 e-: 400 � 200Temperature of the TiAl - TiAl star-shaped object with alumina counter-part
100 200 300 400 500 600
Time(s)
• Experimenlal --Cakulated
700
Temperature of the alumina - TiAI star-shaped object with alumina counter-part 1400 � 1200 u � 1000 � 800 Ra .. 600 400 � 200 100 200 300 400 500 600 Time (s) " Experimen1al --Calculated 700
Current delivered through the SPS colulllll - TiAI star shaped object with alumina couter-part 3000 2500 $ 2000 � 1500 B IOOO 500 100 200 300 400 500 600 700 Time (s) • Experimenlal --Calculated
Fig. 17. Evolution of the temperature of the TiAl star-shaped object (a) and the alumina counter-part (b) and the current (c) through the SPS column for the star shaped object configuration.
5. Conclusions and future work
A new expression of the vertical ECR and TCR of the SPS column was developed. The contact resistances were obtained using an optimization algorithm, which allows the identification of unknown parameters by fitting experimental curves. The main benefit of this approach is that it requires only one instrumented experiment per configuration and ma terial. The calibration on different die sizes (8, 20 and 36 mm) led to a good simulation of the evolution of the current and sample temperature for both alumina and TiAI. Thus, this method can be used on any ma terial, and is not restricted to ceramics. The new expressions of the contact resistances were then tested on more complex configurations. In terms of temperature calculations, the mode! can accurately predict the thermal evolution of the TiAI and alumina parts for ail three configu rations. It shows the efficiency of this method, which allows to have a robust simulation from only two trials (one for the TiAI and one for the alumina).
The main benefit of this approach is that an accurate simulation of the electro-thermal behavior of the spark plasma sintering of different complex shapes can be obtained with a very limited number of experi ments on simple configurations. Thus, for a given complex shape (with a given diameter), only two instrumented experiments on simple shapes (pellets) with the same diameter are necessary. One with the material of the desired part and the other with the material of the counter-part. The ECR and TCR are then optimized and implemented in the final mode!.
However, if the temperatures calculated by the mode! reflect well the experimental data, there is a slight gap between the calculated and experimental current. This gap can be explained by the pressure appli cation mode. A progressive applied pressure can modify the current density in the SPS column, and thus the contact resistances. Therefore, it shows that the pressure has a significant role in the determination of the contact resistances. However, it is possible to determine the contact pressure with the finite element analysis. The next step is then to implement the pressure dependence in the contact resistance expres sions, through the realization of experiments at different pressures. The contact pressure dependence of the ECR and TCR can then lead to
equations working for any SPS configuration. Declarations of Competing Interest
None.
Acknowledgements
The SPS experiments were performed at the Plateforme Nationale CNRS de Frittage-Flash (PNF2/CNRS Toulouse). This work was sup ported by the Association Nationale Recherche Technologie (ANRT) as part of the CIFRE (Industrial Agreement of Formation by Research) contract 11°2017 /1026; and the Programme Opérationnel FEDER-FSE
Midi-Pyrénées et Garonne 2014-2020 as part of the CERAPRINT proj ect 11°17014462.
References
[1] S. Grassa, Y. Sakka, G. Maizza, Electric current activated/assisted sintering (ECAS): a review of patents 1906-2008, Sei. Technol. Adv. Mater. 10 (5) (2009), https:/ /
doi.org/10.1088/1468-6996/10/5/053001.
[2] O. Guillon, et al., Field-assisted sintering technology /spark plasma sintering: mechanisms, materials, and technology developments, Adv. Eng. Mater. 16 (7) (2014) 830---849, https://doi.org/10.1002/adem.201300409.
[3] R. Orrù, R. Licheri, A.M. Locci, A. Cincotti, G. Cao, Consolidation/synthesis of materials by electric current activated/assisted sintering, Mater. Sei. Eng. R Reports 63 (no. 4-6) (2009) 127-287, https://doi.org/10.1016/j.mser.2008.09.003. [ 4] E.A. Olevsky, W.L. Bradbury, C.D. Haines, D.G. Martin, D. Kapoor, Fundamental
aspects of spark plasma sintering: 1. Experimental analysis of scalability, J. Am. Ceram. Soc. 95 (no. 8) (2012) 2406-2413,
https://doi.org/10.llll/j.1551-2916.2012.05203.x.
[5] R. Chaim, M. Levin, A. Shlayer, C. Estoumes, Sintering and densification of nanocrystalline ceramic oxide powders: a review, Adv. Appl. Ceram. 107 (3) (2008) 159-169, https:/ /doi.org/10.1179/174367508X297812.
[6] R. Chaim, R. Marder, C. Estoumés, Z. Shen, Densification and preservation of ceramic nanocrystalline character by spark plasma sintering, Adv. Appl. Ceram 111 (no. 5-6) (2012) 280-285, https://doi.org/10.1179/174367508X297812. [7] Z.A. Munir, D.V. Quach, M. Ohyanagi, Electric current activation of sintering: a
review of the pulsed electric current sintering process, J. Am. Ceram. Soc. 94 (1) (2011) 1-19, https://doi.org/10.11 ll/j.1551-2916.2010.04210.x.
[8] A. Zavaliangos, J. Zhang, M. Krammer, J.R. Groza, Temperature evolution during field activated sintering, Mater. Sei. Eng. A 379 (no. 1-2) (2004) 218-228, https://
doi.org/10.1016/j .msea.2004.01 .052.
[9] Y. Achenani, M. Saâdaoui, A. Cheddadi, G. Bonnefont, G. Fantozzi, Finite element modeling of spark plasma sintering: application to the reduction of temperature inhomogeneities, case of alumina, Mater. Des. 116 (2017) 504-514, https://doi.
org/10.1016/j.matdes.2016.12.054.
[10] C. Wang, L. Cheng, Z. Zhao, FEM analysis of the temperature and stress distribution in spark plasma sintering, Comput. Mater. Sei. 49 (2010) 351-362, https://doi.
org/10.1016/j.commatsci.2010.05.021.
[11] X. Wei, D. Giuntini, A.L. Maximenko, C.D. Haines, E.A. Olevsky, Experimental investigation of electric contact resistance in spark plasma sintering tooling setup, J. Am. Ceram. Soc. 98 (11) (2015) 3553-3560, https://doi.org/10.1111/
jace.13621.
[12] C. Manière, et al., Contact resistances in spark plasma sintering: from in-situ and ex-situ determinations to an extended mode! for the scale up of the process, J. Eur. Ceram. Soc. 37 (4) (2017) 1593-1605, https://doi.org/10.1016/j.
jeurceramsoc.2016.12.010.
[13] C. Manière, et al., Pulse analysis and electric contact measurements in spark plasma sintering, Electr. Power Syst. Res. 127 (2015) 307-313, https:/ /doi.org/
10.1016/j.epsr.2015.06.009.
[14] A. Cincotti, A.M. Locci, R. Orrù, G. Cao, Modeling of SPS apparatus: temperature, current and strain distribution with no powders, AIChE J. 53 (3) (2007) 703-719,
https:/ / doi.org/10.1002/aic. l l 102.
[15] C. Manière, E. Nigito, L. Durand, A. Weibel, Y. Beynet, C. Estournès, Spark plasma sintering and complex shapes: the deforrned interfaces approach, Powder Technol. 320 (2017) 340-345, https://doi.org/10.1016/j.powtec.2017.07 .048.
[16] A. Pavia, et al., Electro-thermal measurements and finite element method simulations of a spark plasma sintering device, J. Mater. Process. Technol. 213 (no. 8) (2013) 1327-1336, https:/ /doi.org/10.1016/j.jmatprotec.2013.02.003. [17] F. Gucci, T. Saunders, M. Reece, S. Grasso, Refined SPS Modeling Based on
Calibrated Current and Voltage Measurements., Elsevier Inc., 2019 https://doi.
org/10.1016/8978-0-12-817744-0.00007-6.
[18] C. Manière, G. Lee, E.A. Olevsky, Proportional integral derivative, modeling and ways of stabilization for the spark plasma sintering process, Results Phys. 7 (2017) 1494-1497, https://doi.org/10.1016/j.rinp.2017.04.020.
[19] U. Anselmi-Tamburini, S. Gennari, J.E. Garay, Z.A. Munir, Fundamental investigations on the spark plasma sintering/synthesis process: Il. Modeling of current and temperature distributions, Mater. Sei. Eng. A 394 (no. 1-2) (2005) 139-148, https://doi.org/10.1016/j.msea.2004.11.019.
[20] C. Manière, Spark plasma sintering : couplage entre les approches modélisation,
Instrumentation et Matériaux (2015).
[21] C. Manière, A. Pavia, L. Durand, G. Chevallier, K. Afanga, C. Estournès, Finite element modeling of the electro-thermal contacts in the spark plasma sintering process, J. Eur. Ceram. Soc. 36 (no. 3) (2016) 741-748, https://doi.org/10.1016/j.
jeurceramsoc.2015.10.033.
[22] Toyo Tanso, Isotropie Graphite (Special Graphite), 2020 [Online]. Available:
https://www.toyotanso.com/Products/Special_graphite/index.html.
[23] J. Diatta, G. Antou, N. Pradeilles, A. Maître, Numerical modeling of spark plasma sintering-Discussion ondensification, J. Eur. Ceram. Soc. 37 (2017) 4849--4860,
https:/ /doi.org/10.1016/j .jeurceramsoc.2017 .06.052.
[24] J.A. Nelder, R. Mead, A simplex method for fonction minimization, Comput. J. 7 (4) (1965) 308-313, https://doi.org/10.1093/comjnl/7.4.308.
[25] M.A. Luersen, R. Le Riche, Globalized nelder-mead method for engineering optimization, Comput. Struct 82 (no. 23-26) (2004) 2251-2260, https://doi.org/