Science Arts & Métiers (SAM)
is an open access repository that collects the work of Arts et Métiers Institute of
Technology researchers and makes it freely available over the web where possible.
This is an author-deposited version published in:
https://sam.ensam.eu
Handle ID: .
http://hdl.handle.net/10985/19021
To cite this version :
Aya KARAM, Chris LABAKI, Georges MJAESS, Aren Joe BIZDIKIAN, Fares YARED, Joeffroy
OTAYEK, Ziad BAKOUNY, Ismat GHANEM, Wafa SKALLI, Ayman ASSI - How do 3D skeletal
parameters influence kinetics? - Gait & Posture - Vol. 65, p.57-59 - 2018
Any correspondence concerning this service should be sent to the repository
Administrator :
[email protected]
O 028 - How do 3D skeletal parameters in
fluence kinetics?
A. Karam
a, C. Labaki
a, G. Mjaess
a, A.J. Bizdikian
a, F. Yared
a, J. Otayek
a, Z. Bakouny
a, I. Ghanem
a,
W. Skalli
b, A. Assi
a,b,⁎aUniversity of Saint-Joseph, Laboratory of Biomechanics and Medical Imaging, Beirut, Lebanon bArts et Métiers ParisTech, Institut de Biomécanique Humaine Georges Charpak, Paris, France
1. Introduction
Lower limb joints are subject to mechanical load during daily ac-tivities, such as gait, which is an important risk factor of osteoarthritis. Moreover, kinetics are known to be influenced by gait alterations in patients with osteoarthritis [1]. While skeletal parameters are known to determine gait kinematics [2], it is still unknown how skeletal para-meters influence kinetic parameters.
2. Research questions
How do 3D skeletal parameters influence lower limb kinetics in asymptomatic adults?
3. Methods
130 asymptomatic subjects with a large age range (age: 30 ± 11years [18–59], 63 F) underwent 3D gait analysis, from which
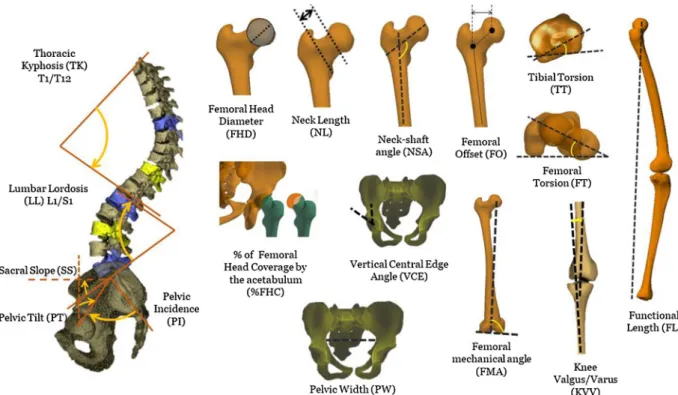
Fig. 1. 3D spino-pelvic, hip and lower limb parameters obtained from the full-body biplanar X-rays.
E-mail addresses: [email protected](A. Karam), [email protected](A. Assi).
the means and maxima of kinetic parameters (moments in the 3 planes and power) of hip, knee and ankle were extracted using the Davis protocol. Subjects then underwent full-body biplanar X-rays, from which 3D spino-pelvic, hip and lower limb parameters were obtained (Fig. 1) such as: Pelvic Tilt (PT), Sacral Slope (SS), Pelvic Incidence (PI), Lumbar Lordosis (LL), Thoracic Kyphosis (TK), Pelvic Width (PW), Femoral Head Diameter (FHD), Femoral Offset (FO), Neck Length (NL), Neck Shaft Angle (NSA), Tibial Torsion (TT), Femoral Torsion (FT), Functional Length (FL), Knee Valgus/Varus KVV, Femoral Mechanical Angle (FMA), Vertical Central Edge angle (VCE), % of Femoral Head Coverage by the acetabulum (%FHC) and acetabular orientation in the 3 planes. In order to assess the influence of skeletal and demographic (age, sex, weight, height and BMI) parameters on gait kinetics, a uni-variate analysis (Pearson’s correlation) followed by a multiuni-variate analysis (stepwise multiple linear regression) were computed; the
dependant variables were kinetic parameters, while the independent variables were skeletal and demographic parameters.
4. Results
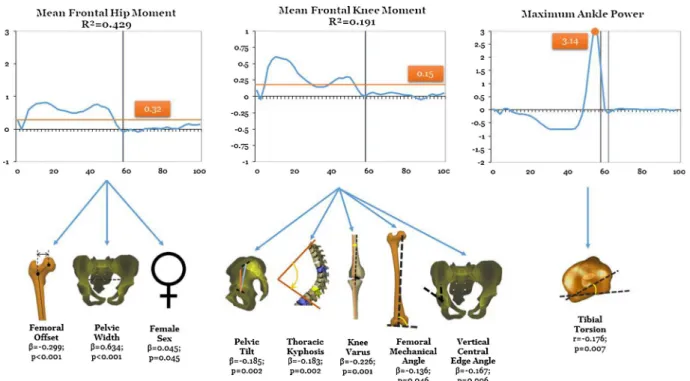
The results of the most significant outcomes are shown inTable 1. In the frontal plane, the mean hip moment (R2 = 0.429) was determined by FO (β=−0.299, p < 0.001), PW (β = 0.634, p < 0.001) and sex (β = 0.045 F compared to M, p = 0.045); the mean knee moment (R2 = 0.191) was determined by PT (β=−0.185, p = 0.002), TK (β=−0.183, p = 0.002), KVarus (β=−0.226, p = 0.001), FMA (β=−0.136, p = 0.046) and VCE (β=−0.167, p = 0.006). The max-imum ankle power was determined by TT (r=−0.176, p = 0.007). Table 1
The main determinants of kinetics (moments and powers) during gait.
Kinetics Determinants β p-value
Moments in the sagittal plane Mean Hip moment Femoral Torsion r=0.177 0.007
Mean Ankle moment (R2= 0.18) T4-T12 0.150 0.014
LL Functional length 0.318 < 0.001
Tibial torsion 0.222 < 0.001
Moments in the frontal plane Mean Hip moment (R2= 0.429) Pelvic width 0.634 < 0.001
Femoral offset −0.229 < 0.001
Sex (F) 0.045 < 0.001
Mean Knee moment (R2= 0.191) Pelvic tilt −0.185 0.002
Thoracic kyphosis −0.183 0.002
Knee Varus −0.226 0.001
Femoral mechanical angle −0.136 0.046 Vertical center edge angle −0.167 0.006
Powers Maximum Hip power (R2= 0.042) Age 0.178 0.006
Sex (F) 0.131 0.043
Mean Knee power (R2= 0.174) Lumbar Lordosis −0.164 0.010
Neck length 0.183 0.018
Acetabular coverage rate 0.250 < 0.001
Sex (F) −0.161 0.037
Maximum Ankle power Tibial torsion r=-0.16 0.012
5. Discussion
This is thefirst study to investigate the impact of skeletal and de-mographic parameters on lower limb moments and powers (Fig. 2). Females with a larger PW showed greater frontal hip moment during gait, which was shown to be related to radiographic progression of hip osteoarthritis [[3]]. Subjects with smaller pelvic tilt, thoracic kyphosis, knee varus, femoral mechanical angle, and vertical central edge angle
seem to have a greater frontal knee moment and thus might be at risk of developing knee osteoarthritis.
References
[1] Wesseling et al. 2015. [2] Bakouny et al. 2017. [3] Tateuchi et al. 2017.
![[PDF] Débuter et avancé avec le langage COBOL | Formation informatique](data:image/gif;base64,R0lGODlhAQABAIAAAP///wAAACH5BAEAAAAALAAAAAABAAEAAAICRAEAOw==)