HAL Id: hal-02146516
https://hal.archives-ouvertes.fr/hal-02146516
Submitted on 17 Nov 2020
HAL is a multi-disciplinary open access
archive for the deposit and dissemination of
sci-entific research documents, whether they are
pub-lished or not. The documents may come from
teaching and research institutions in France or
abroad, or from public or private research centers.
L’archive ouverte pluridisciplinaire HAL, est
destinée au dépôt et à la diffusion de documents
scientifiques de niveau recherche, publiés ou non,
émanant des établissements d’enseignement et de
recherche français ou étrangers, des laboratoires
publics ou privés.
novo ORFs produces gene-like characteristics available
for de novo gene emergence in wild yeast populations
Eléonore Durand, Isabelle Gagnon-Arsenault, Johan Hallin, Isabelle Hatin,
Alexandre Dubé, Lou Nielly-Thibault, Olivier Namy, Christian Landry
To cite this version:
Eléonore Durand, Isabelle Gagnon-Arsenault, Johan Hallin, Isabelle Hatin, Alexandre Dubé, et al..
Turnover of ribosome-associated transcripts from de novo ORFs produces gene-like characteristics
available for de novo gene emergence in wild yeast populations. Genome Research, Cold Spring
Harbor Laboratory Press, 2019, 29, Epub ahead of print. �10.1101/gr.239822.118�. �hal-02146516�
Turnover of ribosome-associated transcripts
from de novo ORFs produces gene-like characteristics
available for de novo gene emergence in wild yeast
populations
Éléonore Durand,
1,4Isabelle Gagnon-Arsenault,
1,2Johan Hallin,
1,2Isabelle Hatin,
3Alexandre K. Dubé,
1,2Lou Nielly-Thibault,
1Olivier Namy,
3and Christian R. Landry
1,21
Institut de Biologie Intégrative et des Systèmes, Département de Biologie, PROTEO, Centre de Recherche en Données Massives de
l
’Université Laval, Pavillon Charles-Eugène-Marchand, Université Laval, G1V 0A6 Québec, Québec, Canada;
2Département de
Biochimie, Microbiologie et Bio-informatique, Université Laval, G1V 0A6 Québec, Québec, Canada;
3Institut de Biologie Intégrative de
la Cellule (I2BC), CEA, CNRS, Université Paris-Sud, Université Paris-Saclay, 91190 Gif sur Yvette, France
Little is known about the rate of emergence of de novo genes, what their initial properties are, and how they spread
in populations. We examined wild yeast populations (Saccharomyces paradoxus) to characterize the diversity and turnover
of intergenic ORFs over short evolutionary timescales. We find that hundreds of intergenic ORFs show translation
signatures similar to canonical genes, and we experimentally confirmed the translation of many of these ORFs in
labo-ratory conditions using a reporter assay. Compared with canonical genes, intergenic ORFs have lower translation efficiency,
which could imply a lack of optimization for translation or a mechanism to reduce their production cost. Translated
intergenic ORFs also tend to have sequence properties that are generally close to those of random intergenic
sequences. However, some of the very recent translated intergenic ORFs, which appeared <110 kya, already show
gene-like characteristics, suggesting that the raw material for functional innovations could appear over short evolutionary
timescales.
[Supplemental material is available for this article.]
New genes may arise from pre-existing gene structures through gene duplication, gene fusion, and horizontal gene transfer or may arise de novo from previously noncoding regions (Chen et al. 2013). De novo gene origination is a source of complete inno-vation because genes emerge solely from mutations, not from the modification of preexisting genes (McLysaght and Hurst 2016). The last decade of work in genomics shed light on the role of inter-genic regions as a regular source of new genes (Tautz and Domazet-Lošo 2011; Landry et al. 2015; Schlötterer 2015; McLysaght and Hurst 2016). Noncoding regions become gene-coding through (1) the acquisition of an open reading frame (ORF) and (2) the acquisition of regulatory sites to induce transcription and transla-tion of the ORF. The subsequent maintenance of the sequence by purifying selection owing to its beneficial effect (Schlötterer 2015; Nielly-Thibault and Landry 2018) leads to the gene being shared among species, as we see for groups of homologous canonical genes.De novo gene birth could in theory be frequent because nu-merous ORFs in mRNA that derive from nonannotated regions are associated with ribosomes and have the potential to produce polypeptides (Ingolia et al. 2009; Wilson and Masel 2011; Carvunis et al. 2012; Ruiz-Orera et al. 2014, 2018; Lu et al. 2017;
Vakirlis et al. 2018). The appearance of these translated ORFs could be accelerated by the genomic context. For instance, ORFs could emerge in long noncoding RNAs (lncRNAs) with relatively high pre-existing expression levels (Xie et al. 2012). The size of intergenic regions, the GC composition, and a genomic context that favors spurious transcription may also affect the birth rate of de novo genes (Nielly-Thibault and Landry 2018; Vakirlis et al. 2018).
The process of de novo gene birth has been described with two hypotheses that consider selection as acting at different time-points. The continuum hypothesis involves a gradual change of coding properties from nongenic to genic and was used to explain patterns related to the size of intergenic ORFs (Carvunis et al. 2012). On the other hand, the preadaptation hypothesis predicts extreme levels of gene-like characteristics among young de novo genes, as was observed for intrinsic structural disorder (Wilson et al. 2017). The two models depend on (1) the distribution of properties (nongene-like versus gene-like) of random polypeptides produced from intergenic regions and (2) whether these properties correlate with the probability that the peptides will have an adap-tive potential. Examining the distribution of properties of novel polypeptides early after their emergence—before they potentially lose their initial properties—is therefore important to determine which one of the two models is best supported.
Young genes are generally shorter and less expressed and diverge faster than older genes (Wolf et al. 2009; Tautz and
4
Present address: Université de Lille CNRS, UMR 8198-Evo-Eco-Paleo, F-59655 Lille, France
Corresponding author: eleonore.durand@univ-lille.fr
Article published online before print. Article, supplemental material, and publi-cation date are at http://www.genome.org/cgi/doi/10.1101/gr.239822.118. Freely available online through the Genome Research Open Access option.
© 2019 Durand et al. This article, published in Genome Research, is avail-able under a Creative Commons License (Attribution-NonCommercial 4.0 International), as described at http://creativecommons.org/licenses/by-nc/4.0/.
Domazet-Lošo 2011). These properties make it challenging to differentiate young de novo genes from nonfunctional ORFs (McLysaght and Hurst 2016). The absence of sequence similarities with genes of other species is not sufficient evidence to infer de novo origination because it could be due to rapid divergence be-tween orthologs (Gubala et al. 2017). A powerful and alternative approach to identify de novo genes and their corresponding orthologous noncoding sequences in closely related populations is through synteny, which gives access to mutations occurring dur-ing the appearance of the de novo genes (Begun et al. 2006, 2007; Levine et al. 2006; Cai et al. 2008; Zhou et al. 2008; Knowles and McLysaght 2009; Li et al. 2010).
Here we explore the role of intergenic diversity in the emergence of de novo genes in wild Saccharomyces paradoxus populations. We focus on this yeast species because of its compact genome and close relatedness with the model species Saccharomyces cerevisiae. One advantage of S. paradoxus over S. cerevisiae is that the divergence of populations or lineages within the species reflects natural events and not domestication or hu-man-caused admixture because S. paradoxus has not been domesti-cated (Charron et al. 2014; Leducq et al. 2016). S. paradoxus has recently diverged lineages (Kellis et al. 2003; Leducq et al. 2016) that allow us to investigate young de novo genes. Finally, the use of natural populations may eventually allow for the connection between the evolution of de novo genes and key evolutionary pro-cesses such as adaptation and speciation (Charron et al. 2014; Naranjo et al. 2015; Leducq et al. 2016, 2017; Eberlein et al. 2017; Weiss et al. 2018).
By using the S. paradoxus model system, we characterized the repertoire and turnover of ORFs located in intergenic regions (named hereafter iORFs), as well as the associated putative de novo polypeptides using ribosome profiling. We also examined how the properties of putative polypeptides covary with their
age and expression, and how they compare with those of canonical genes.
Results
Hundreds of intergenic ORFs show signatures of active translation
Because eukaryotic genomes are pervasively transcribed (David et al. 2006; Clark et al. 2011; Pelechano et al. 2013) and lncRNAs often produce peptides (Ruiz-Orera et al. 2014), it is safe to assume that all iORFs are, to varying degrees, available to the translation machinery. We therefore annotated all iORFs in wild S. paradoxus strains (Supplemental Methods). We used 24 strains that are struc-tured in three main lineages (SpA, SpB, and SpC) (Charron et al. 2014; Leducq et al. 2016) and two S. cerevisiae strains as outgroups (Fig. 1;Supplemental Fig. S1). These cover different levels of nucle-otide divergence, from∼13% between S. cerevisiae and S. paradoxus to∼2.27% between the SpB and SpC lineages (Kellis et al. 2003; Leducq et al. 2016). We annotated iORFs as any first start and stop codons in the same reading frame not overlapping known features and with no minimum size as previously described (see Methods) (Supplemental Analysis, Supplemental Fig. S2A;Supplemental Tables S1, S2; Carvunis et al. 2012; Sieber et al. 2018). We estimated the age of iORFs using the phylogeny at nodes N1 and N2 (see Methods) (Fig. 1;Supplemental Analysis;
Supplemental Fig. S2B). Only iORFs≥60 nt with no significant BLAST hits (see Methods) were considered, for a final set of 19,689 iORFs (Table 1). We identified potentially translated iORFs by ribosome profiling of three strains representative of the three S. paradoxus lineages SpA, SpB, and SpC and of one S. cerevisiae strain, all grown in synthetic oak exudate (SOE) medium (Murphy et al. 2006).
Figure 1. Overview of iORF annotation and translation detection procedure. For a more complete description, see Methods andSupplemental Figure S1. iORF annotation was conducted using S. paradoxus strains that are structured in three main lineages (SpA, SpB, and SpC) with S. cerevisiae as an outgroup. Pairs of genes annotated as syntenic were used to align intergenic genomic regions in which iORFs were characterized. The age of an iORF was estimated using reconstructions of ancestral intergenic sequences at nodes N1 and N2 (in red) to infer their emergence along phylogenetic branches (named b1 to b4, in gray). We chose four strains (one per S. paradoxus lineage and one S. cerevisiae) to characterize the repertoire of translated iORFs (tORFs) using ri-bosome profiling. iORFs without translation signature were named ntORFs.
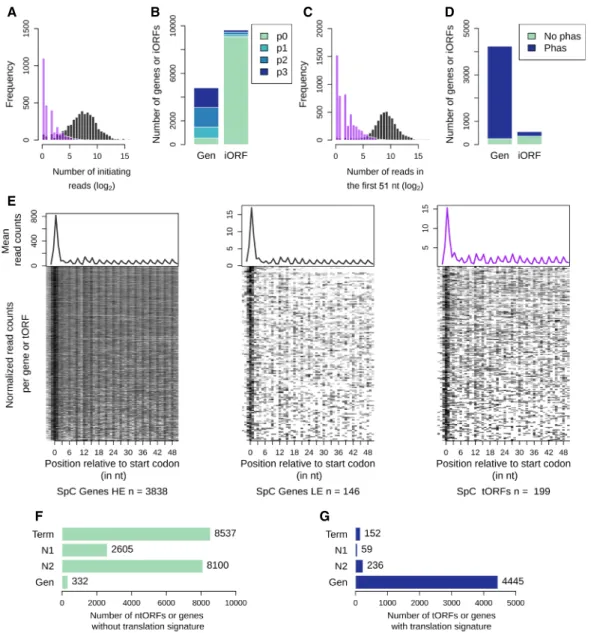
We found that 5.0% of iORFs have at least five ribosome pro-tected fragment (RPF) reads that map to them, suggesting that many of them could be translated. A typical RPF density pattern is characterized by a strong initiation peak located at the start co-don followed by a trinucleotide periodicity at each coco-don of the protein-coding ORFs (Ingolia 2014). We used this feature to iden-tify a set of iORFs that are most likely to be translated. The number of RPF reads at the start codon position is on average lower for iORFs than for annotated genes, but we observed an overlap be-tween the two distributions (Fig. 2A). We observed an initiation peak for 75.0%–88.6% of annotated genes depending on the strain and for 1.8%–8.4% of iORFs (Supplemental Table S3; Fig. 2B). Detected iORF peaks were classified with increasing precision and intensity, resulting in roughly equal proportions of each: p1 (30%), p2 (35%), and p3 (34%; see Methods). A comparable repar-tition (chi-square test, P-value = 0.59) was observed for annotated genes with 24%, 40%, and 36%, showing that the precision levels used in our analysis are reliable.
In a complementary approach, we measured codon periodici-ty as an enrichment of RPF reads at the first nucleotide of each co-don in the first 51 nt, excluding the start coco-don. The number of reads is lower for iORFs compared with known genes, but again, the distributions overlap (Fig. 2C). Among features with a detected peak, 90.8%–94.0% of genes and 26.3%–36.6% of iORFs show a sig-nificant codon periodicity (Fig. 2D;Supplemental Table S3). The numbers are lower for the SpB strain, most likely because of a lower total number of reads (see Methods). iORFs with an initiation peak and a significant periodicity in at least one strain were considered as significantly translated and labeled as translated iORFs (tORFs), whereas others were labeled ntORFs. A metagene analysis on anno-tated genes and tORFs revealed a similar RPF read density pattern between low expressed genes and tORFs (Fig. 2E;Supplemental Fig. S3). The resulting tORF set contains 447 orthogroups with lengths ranging from 60–369 nt. They are present in all age catego-ries, which suggests a continuous emergence of potentially trans-lated ORFs along the phylogeny (Figs. 1A, 2F,G; Table 1).
Among the 447 tORFs, 190 were also detected with an alterna-tive method (RiboTaper) (Supplemental Fig. S4; Calviello et al. 2016). In the main text, we report the analyses performed on the 447 tORFs detected with our custom method. The results were confirmed by the set of tORFs detected with RiboTaper (
Supple-mental Figs. S5, S6). tORFs are a small fraction (∼2%) of iORF
orthogroups≥60 nt, but they add up to >8% of the canonical pro-tein coding genes (400/5000 genes), which is a substantial contribution to the proteome diversity of wild yeast populations.
Translational buffering acts on intergenic ORFs
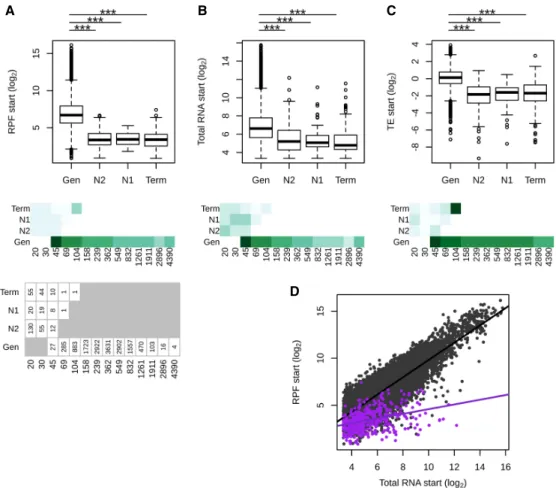
We compared the expression levels of tORFs with that of known genes to examine if de novo polypeptides display gene-like expres-sion levels. We also compared tORF properties while controlling for size ranges per age group. The overlap between the size distribu-tions of tORFs and genes is at the extremes of both distribudistribu-tions. However, the number of long tORFs is not large enough to gener-alize their overall properties with those of smaller genes (Fig. 3A). We measured translation and transcription levels using RPF and total RNA-seq on the first 60 nt of genes and tORFs (see Methods) (Supplemental Table S4) and estimated translation effi-ciency (TE), which reflects the intensity of translation per mRNA unit (Ingolia et al. 2009). We used only the first 60 nt because tORFs tend to be smaller compared with known genes (Fig. 4A), which may bias TE measurements because of the accumulation of RPF reads at the initiation codon. In spite of only considering the first 60 nt, TE values remain significantly correlated with gene size, but the size effect is small and should not bias the comparison of expression levels between tORFs and genes (Supplemental Fig. S7A). tORFs are less transcribed and translated than genes (Wil-coxon test, P-values <2.2 × 10⁻¹⁶) (Fig. 3A,B). TE is also significantly lower (Wilcoxon test, P-value < 2.2 × 10⁻¹⁶) for tORFs compared with genes, suggesting that tORFs are less actively translated than genes, even when considering the same size ranges (Fig. 3C). We noted, however, that the longest tORF size range category contains only one tORF (tORF_102655) (Fig. 3), which displays a much high-er TE value compared with that of tORFs from all the othhigh-er size rang-es. The most highly transcribed tORFs tend to be less translated, resulting in a lower TE compared with genes (ANCOVA, P-value <2.2 × 10⁻¹⁶) (Fig. 3D). The lower translational efficiency, or buffer-ing, of highly transcribed tORFs may be because of a selection pres-sure to limit the production of toxic polypeptides or may simply be a consequence of a recent increase in transcription without a change in features that would increase translation rate. The buffer-ing effect is similar among tORFs of different ages, with no signifi-cant pairwise differences between slopes (P-values between 0.29 and 0.96) (seeSupplemental Fig. S7B), which supports the hypoth-esis of no selection for or against translation. Again, there is a signif-icant overlap between expression levels and TEs of genes and tORFs, which means that some tORFs have gene-like expression levels and TEs (Fig. 3A–D).
Translated intergenic polypeptides display a high variability
for gene-like traits
A recent study showed that young de novo proteins were more disordered than old ones, whereas random polypeptides produced from intergenic regions were, on average, less structurally disor-dered (Wilson et al. 2017). This suggests that young polypeptides with an adaptive potential are already biased in terms of structural properties. We looked for such biases among the tORFs we detect-ed. We examined the properties of predicted polypeptides as a function of the timing of emergence, assuming that selection would have had more cumulative effects on older ones. We com-pared the level of intrinsic disorder and of GC-content among tORFs of different age groups and annotated genes. On average, protein disorder and GC-content are lower for tORFs than Table 1. Estimated age of iORFs in S. paradoxus lineages
Age (node or
branch)a Totalb Numbers≥60 ntb translation signatureNumbers with b
N2 34,092 8336 236 N1 6782 2664 59 Term-SpA 8454 3608 82 Term-SpB 6860 2948 17 Term-SpC 5324 2235 49 Total without redundancyc 61,243 19,689 447 aN1 and N2 refer to phylogenetic nodes (see Fig. 1A). SpA,
Term-SpB, and Term-SpC represent iORF gain events occurring along terminal branches b1, b3, and b4, respectively. These categories refer to iORFs absent in ancestral sequences (based on the conservation of the start and stop position in the same reading frame). iORFs present in none of the strains used for reconstruction analysis were removed (see Methods).
b
The 12 iORFs with significant BLASTP hits against reference proteomes (see Results and Methods) were removed.
ciORFs with no ancestors and that were present in more than one
lineage were counted once. Four tORFs detected as terminal Scer were included in the total.
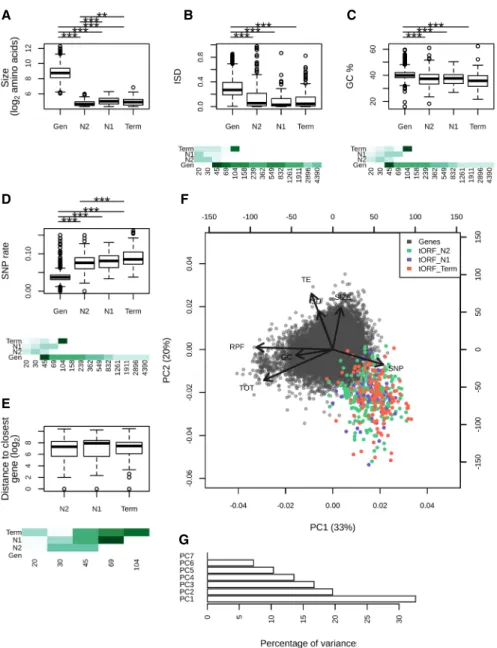
canonical genes regardless of tORF age (Wilcoxon test, P-values <0.001) (Fig. 4B,C). This pattern was consistent for most tORFs and genes sharing the same size range of 45–100 amino acids (Fig. 4B,C).
We examined if SNP density along the genome could influ-ence tORF turnover. Regardless of their age, tORFs are more often located in regions displaying a higher SNP density compared with genes, which is consistent with the stronger purifying selection in genic regions (Fig. 4D). Younger tORFs (on terminal branches) tend to be in regions with higher SNP density compared with older ones (appearing at N2), even when considering the same size
rang-es (Fig. 4D). This could be because of mutation rate variation or differences in evolutionary constraints acting on tORFs in an age-specific manner. Older tORFs are not preferentially located in the proximity of genes where selection may be stronger (Fig. 4E), suggesting that the lower diversity observed at N2 is mainly because of a lower mutation rate. These observations suggest that younger tORFs are more likely to occur in rapidly evolving se-quences with higher mutation rates. Sese-quences are too similar be-tween strains to test for purifying selection individually on each tORF. Instead, we estimated the likelihood of the global dN/dSratio
for ancient tORFs conserved in all S. paradoxus strains (set 1) or
B
C
D
A
E
F
G
Figure 2. A fraction of the iORFs display translation signatures similar to genes. (A) Distribution of the ribosome profiling read counts for genes (gray) and iORFs (purple) at the start codon position. (B) Number of genes (Gen) or iORFs with a detected initiation peak at the start codon position. Peaks are colored according to the precision of the detection (see Methods), from the most precise (p3) to the least precise (p1). Genes and iORFs with no peaks detected are shown in green (p0). (C ) Distribution of the ribosome profiling read counts in the first 51 nt of iORFs, excluding the start codon. (D) Proportions of genes or iORFs with a significant in-frame codon periodicity (read phasing in blue) among genes and iORFs with a detected initiation peak. Genes and iORFs with no detected phasing are shown in green. (E) Metagene analysis for significantly high (HE; left) or low (LE; middle) translated genes (gray) and for intergenic tORFs (purple; right). The mean of the 5′read counts is plotted along the position relative to the start codon for significantly translated genes or tORFs. The lines of the matrix indicate the normalized coverage of genes or tORFs with significant translation signatures, with one feature per line. (A–E) Results for the SpC strain MSH587-1 are shown (for SpA and SpB results, seeSupplemental Fig. S3). (F,G) Number of genes or iORFs without (ntORFs; F ) or with (tORFs; G) translation signatures detected in at least one of the four strains. Actual numbers are indicated next to each bar. iORFs are classified according to their age (N2, N1, or Term; see Methods) (Fig. 1; Table 1).
tORFs appearing at N1 and conserved between the SpB and SpC lin-eages (set 2). Both sets seem to evolve neutrally without significant purifying selection (both P-values = 1). Altogether, tORFs do not display significant purifying selection, but it appears that as a neu-tral pool, they provide raw material with gene-like characteristics for selection to act.
We performed a multivariate analysis of polypeptides proper-ties. We observed a subset of ancient and recent tORFs sharing gene-like characteristics for several expression and sequence fea-tures (Fig. 4F,G). Among them, tORF_102655 (the only representa-tive of the longest tORF size range) is characterized by multiple gene-like characteristics with extreme intrinsic disorder, GC%, SNP rate, and TE values (Figs. 3, 4). This tORF, which was acquired along the SpC terminal branch, is fixed in all strains of the SpC lin-eage, and might be recruited by natural selection given that gene-like characteristics do increase its functional potential.
Some tORFs display significant expression changes between
lineages
Our analysis revealed that natural populations are constantly sup-plied with de novo putative polypeptides in intergenic regions (Table 1) at a rate sufficient to provide lineages that diverged
<110,000 yr ago with different gene contents. We looked for line-age-specific putative polypeptides among tORFs based on signi-ficant differences of RPF coverage (see Methods). These changes may be owing to an iORF gain, a transcription/translation increase, or both. Thirty-three tORFs displayed a significant lineage-specific increase in expression, with 20 in SpA, five in SpB, and eight in SpC (Fig. 5; Supplemental Fig. S8). Among them, 16 were acquired along terminal branches, like the SpB-specific tORF_70680 (Fig. 5). Nearly 70% of strong lineage-specific expression patterns are correlated with the presence of the tORF in one lineage only. This suggests that iORF turnover (gain and loss of start and stop co-dons) mostly explain translation differences. Three tORFs are more expressed in both SpB and SpC strains compared with SpA and Scer, suggesting an event occurring along branch b2 (Fig. 1A;
Supplemental Fig. S8). We also detected older expression gain/in-crease events in S. paradoxus relative to S. cerevisiae for nine tORFs, for instance, tORF_69174 (Fig. 5;Supplemental Fig. S8).
Several tORFs show significant in vivo translation
We selected 45 tORFs, including the 33 tORFs displaying signifi-cant translation changes, to test for translation using a mutated dihydrofolate reductase gene (Dhfr) as a reporter (Supplemental
B
C
D
A
Figure 3. Putative intergenic polypeptides are less efficiently translated compared with genes. (A–C) Ribosome profiling (RPF start), total RNA (Total RNA start), and translation efficiency (TE start)—read counts in the first 60 nt, normalized to correct for library size differences in log2—are displayed for genes
(Gen) and tORFs depending on their ages (N2, N1, and Term). Significant differences in pairwise comparisons are displayed above each plot: Wilcoxon test; (∗∗∗) P-values <0.001, (∗∗) P-values <0.01, and (∗) P-values <0.05. Mean estimates per size range are colored in shades of green (from pale for low values to dark green for high values). tORF and gene numbers per size range and age are indicated below the graph. (D) RPF plotted as a function of total RNA for tORFs in purple or for genes in gray. Regression lines are plotted for significant Spearman correlations (P-values <0.05). Expression levels were calculated using the mean of the two replicates.
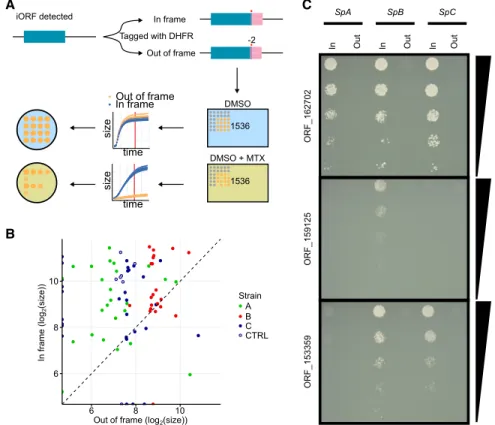
Table S5; Tarassov et al. 2008; Freschi et al. 2013). The mutated DHFR enzyme confers resistance to methotrexate (MTX) when ex-pressed at significant levels (Tarassov et al. 2008). We integrated the Dhfr coding sequence at the 3′end of the candidate tORFs in the SpA, SpB, and SpC genetic backgrounds, replacing their stop codons. We fused the Dhfr in the same reading frame as the tORF to test for transcripts that would encompass the ORF and transla-tion controlled by the native tORF initiatransla-tion codon (Fig. 6). As a negative control, we also fused the Dhfr with the tORFs in a differ-ent reading frame. We then tested translation by measuring colony
growth on a medium supplemented with MTX (Fig. 6). We also included 12 canon-ical genes as positive controls ( Supple-mental Table S5).
We found support for the transla-tion of 26 out of the 45 tORFs in at least one strain (Fig. 6B,C;Supplemental Figs. S9, S10). For six tORFs, out-of-frame fu-sions grew better on selective medium than did in-frame fusions, indicating a translation signal from a different reading frame (Fig. 6;Supplemental Figs. S9, S10). Four of these six tORFs have overlapping iORFs in different reading frames, which suggests that they could be translated in-stead of the tORF we were focusing on (tORF_230326, tORF_80553, tORF_1026 55, and tORF_70680) (seeSupplemental Figs. S7, S10). Eleven of the remaining tORFs display no translation signal, and eight had growth differences in the control condition without MTX so we could not conservatively detect an effect (Supplemental Fig. S10).
We compared the translation signal obtained by RPF and with the DHFR re-porter. We succeeded in transforming five tORFs in all lineages (SpA, SpB, and SpC), with translation signals that were consistent with our expression criteria (see Methods). However, we observed that the expression patterns of the tORFs are likely condition-specific. For instance, tORF_7665 was found to be translated in the SpC strain in SOE medium, where-as on the MTX medium, the translation was found only in the SpB strain ( Sup-plemental Fig. S11). However, some translation signals were conserved among strains and conditions, for example, for tORF_14438. These results confirm the translation detected by ribosome pro-filing and indicate that the transcrip-tion and translatranscrip-tion of tORFs could be highly condition-specific. However, the DHFR assay measures steady-state tein abundance, whereas ribosome pro-filing measures steady-state mRNA/ ribosome association, which could also contribute to the difference in signals.
Discussion
To better understand the early stages of de novo gene birth, we characterized the properties and turnover of ORFs, which recently acquired translation, over short evolutionary timescales. We fo-cused on ORFs strictly located in intergenic regions, which most likely represent only a subset of noncoding ORFs (Lu et al. 2017). ORFs overlapping known genes (in a different reading frame or in the opposite strand) and pseudogenes may also provide an unneglectable source of ORFs and could be an important
B
A
D
E
G
F
C
Figure 4. Age-dependent characteristics of intergenic polypeptides. (A–E) Sizes (log2number of
resi-dues), mean disorder (ISD), GC%, SNP density, and distance to the closest gene are displayed for genes and tORFs as a function of their age (N2, N1, and Term). Pairwise significant differences are displayed above each plot: Wilcoxon test; (∗∗∗) P-values <0.001, (∗∗) P-values <0.01, and (∗) P-values <0.05. Mean estimates per size range are colored in shades of green (from pale for low values to dark green high values). (F ) Principal component analysis using the number of residues (SIZE in log2), ribosome
pro-filing (RPF), total RNA (TOT) and TE (as read counts in the first 60 nt normalized to correct for library size differences and in log2), intrinsic disorder (ISD), the GC%, and SNP density (SNP). tORFs are colored as a
function of their age. (G) Percentage of variance explained by each PCA axis (the two first axes explain 33% and 20% of the variation for a total of 53%).
contribution to the proteome diversity in wild populations (Ji et al. 2015; Lu et al. 2017; Casola 2018).
The repertoire of iORFs in S. paradoxus came from ancient iORFs that are still segregating within S. paradoxus but is regularly supplied with gains of de novo iORFs (Supplemental Fig. S2). Among the approximately 20,000 iORF orthogroups of≥60 nt, a small fraction (∼2%) showed translation signatures similar to ex-pressed canonical genes. Among the 447 tORFs detected using our custom method, 190 (42%) were confirmed with another tool (RiboTaper) (seeSupplemental Material). We observed that the different methods to detect translation may favor tORFs with different characteristics. For instance, the analysis performed with RiboTaper appears to detect translation signals on less ex-pressed tORFs with small initiation peaks (Supplemental Fig. S4). We instead gave more importance to translation initiation signals because we focused on intergenic regions. However, our analysis on expression and sequence properties was robust to translation detection methods.
We observed a stronger post-transcriptional buffering in the tORFs with the highest transcription levels, reflecting either selec-tion against translaselec-tion or a lack of selecselec-tion for optimal transla-tion. This buffering was also observed in another ribosome profiling data set in S. cerevisiae (Supplemental Fig. S12; McManus et al. 2014). The buffering effect was previously
hypoth-esized to be the result of stabilizing selection on the produced amount of proteins (McManus et al. 2014). In our case, the post-transcription buffering effect is similar between older and younger tORFs, suggesting that selection has likely not been acting or has been too weak to affect this feature.
Consistent with a model in which most tORFs evolve neutral-ly, de novo polypeptide properties are on average close to the ex-pectation for random sequences. However, the diversity is large enough for some tORFs to have gene-like properties, suggesting that a small set of neutrally evolving polypeptides already has a potential for new functions (assuming that new functions are more likely to emerge from gene-like properties). Translation sig-natures were detected for both ancient and recent iORFs and are represented in all conservation groups. This illustrates that there are regular gains and losses of tORFs along the phylogeny. The overall absence of purifying selection acting on tORFs suggests a neutral evolution of most intergenic polypeptides, as observed in rodents (Ruiz-Orera et al. 2018). A study recently found that the ex-pression of random sequences is likely to have an effect on fitness (Neme et al. 2017). By analogy with the fitness effect distribution of new mutations, which are characterized by a large number of mutations of neutral or small effect and few mutations of large ef-fect (Bataillon and Bailey 2014), we hypothesize that only a small fraction of tORFs appearing from random mutations could provide Figure 5. A continuous emergence of putative polypeptides in S. paradoxus. Normalized RPF read coverage for a selection of lineage-specific (or group-specific) tORFs per strain. RPF read coverages are displayed for replicate 1 and 2 with a blue or pink area, respectively. The positions of all iORFs (including ntORFs and tORFs) in the genomic area are drawn below each plot. The tORF of interest is labeled with a yellow dot and is plotted in black. iORFs overlapping the iORF of interest are plotted in black when they are in the same reading frame and in gray when they are in a different reading frame than the selected tORF.
an adaptive advantage strong enough to display a purifying selec-tion signature early after birth. Given this, the resemblance of tORFs to random sequences does not entirely preclude any poten-tial molecular function or fitness effect.
Recently emerging tORFs along terminal branches are more frequent in regions with a higher SNP density, whereas older tORFs tend to be located in slowly evolving regions. This observa-tion suggests turnover rates that depend on the local mutaobserva-tion rate. Mutation hotspots may result in exploration of many se-quence combinations, continuously fueling natural selection with new coding material. Some tORFs have a subset of gene-like characteristics, implying that they would require limited refine-ment by natural selection to acquire new functions if we assume that functions require these gene-like characteristics. These tORFs belong to ancient or recent gain events, suggesting that gene-like characteristics may be conserved over longer evolution-ary timescales. These properties could be available immediately for selection to act or when populations are exposed to a changing environment. In addition, even if properties are getting more gene-like for a subset of tORFs, changes are generally small. This suggests that if tORFs are retained, they provide the raw material to gradually evolve as in the continuum hypothesis (Carvunis et al. 2012). We identified a recently emerged tORF that had several gene-like characteristics, suggesting that it is preadapted to be
bio-chemically functional. This example il-lustrates that the birth of a de novo polypeptide may be immediately accom-panied with larger gains of gene-like properties, as in the preadaptation hy-pothesis (Wilson et al. 2017). Perhaps both the continuum and the pre-adaptation hypotheses are at play, de-pending on the ORF and the context.
Methods
Characterization of the intergenic
ORF diversity
We investigated ORF diversity in inter-genic regions of wild S. paradoxus popula-tions SpA, SpB, and SpC (Charron et al. 2014; Leducq et al. 2016). The wild S. cer-evisiae strain YPS128 was used in our ex-periments, and the reference strain S288C was used (version R64-2-1 from https://www.yeastgenome.org/) for the functional annotation.
Genome assemblies
Genome assemblies were performed using high-coverage sequencing data from five, 10, and nine North American strains belonging to lineages SpA, SpB, and SpC, respectively (Supplemental Fig. S1; Leducq et al. 2016) using IDBA_UD (Peng et al. 2012). For strain YPS128, raw reads were kindly provided by J. Schacherer (Peter et al. 2018). We used the default option for IDBA-UD parameters: a minimum k-mer size of 20 and maximum k-mer size of 100, with 20 increments in each iteration. Scaffolds were ordered and orientated along a reference genome using ABACAS (Assefa et al. 2009), using the–p NUCmer parame-ter. S. paradoxus and S. cerevisiae scaffolds were, respectively, aligned along the reference genomes of CBS432 (Scannell et al. 2011) and of S288C. Scaffolds unused in the ordering and >200 bp were also conserved for further analysis. Genome assemblies are available inSupplemental Data.
Identification of orthologous intergenic regions
We detected orthologous intergenic regions using synteny. Genes were predicted using AUGUSTUS (Stanke et al. 2008) with the complete gene model for “saccharomyces_cerevisiae_S288C”. Orthologs were annotated using a reciprocal best hit (RBH) ap-proach implemented in SynChro (Drillon et al. 2014) against the reference S288C using a delta parameter of three. We used the clustering method implemented in SiLiX (Miele et al. 2011) to identify conserved orthologs among the 26 genomes. We select-ed conservselect-ed orthologs with a conservselect-ed order to extract ortholo-gous microsyntenic genomic regions≥100 nt between each pair of genes (Supplemental Fig. S1).
Ancestral reconstruction of intergenic sequences
Because the divergence between strains belonging to the same lineage is low, we used one strain per lineage, that is, YPS128
C
A
B
Figure 6. DHFR tagging confirms expression of tORFs. (A) Conceptual figure of the approach. Forty-five tORFs were tagged with a full-length Dhfr—in-frame or out-of-frame in SpA, SpB, and SpC—and then phenotyped by time-resolved imaging and spot-dilution assays. (B) Log2colony sizes of strains
tagged with Dhfr in-frame (y-axis) or out-of-frame (x-axis). The colony size is measured after∼60 h of growth (shown as a red vertical line in panel A) on medium supplemented with methotrexate. Colors rep-resent the different strains. Canonical genes are tagged in the CTRL strains (SpC strain). Dashed line in-dicates y = x. (C ) Spot-dilution assays further confirm expression of the tORFs and show differential expression of tORF_153359, tORF_159125, and tORF_162702. Fivefold dilutions go from top to bottom. For the corresponding controls in medium not supplemented with methotrexate, seeSupplemental Figure S9.
(S. cerevisiae), YPS744 (SpA), MSH-604 (SpB), and MSH-587-1 (SpC) for ancestral reconstruction using Historian (Holmes 2017). Indel reconstruction was essential to not introduce artifactual frame-shifts in ancestral iORFs. Historian was run with a Jukes–Cantor model using a phylogenetic tree inferred from aligned intergenic sequences by PhyML version 3.0 (Guindon et al. 2010) with the smart model selection (Lefort et al. 2017) and with YPS128 as an outgroup.
iORF annotation and conservation level
Orthologous intergenic regions in contemporary strains and their ancestral sequences were aligned using MUSCLE (Edgar 2004) with default parameters. Intergenic regions with a global alignment of <50% identity among strains (including gaps) were removed. We defined iORFs as any sequence between canonical start and stop codons, in the same reading frame, and with a minimum size of three codons, using a custom Python script (Supplemental Code). We extracted a presence/absence matrix based on the exact conservation of the start and the stop codon in the same reading frame (Fig. 1;Supplemental Fig. S1). iORF alignment coordinates were converted to genomic coordinates on the respective genomes and were removed if there was any overlap with a known feature annotation (rRNA, tRNA, ncRNA, snoRNA, nonconserved genes, pseudogenes) on the reference S288C. Additional masking was performed by removing iORFs (1) if they were located in a region with >0.6% of sequence identity with the S. cerevisiae ncRNAs or genes (including pseudogenes and excluding dubious ORFs) or with the Saccharomyces kudriavzevii and Saccharomyces eubayanus genes (Zerbino et al. 2018), (2) if they were located in a low com-plexity region identified with RepeatMasker (Smit et al. 2013– 2015), and (3) if local alignments of iORFs ±300 bp displayed <60% of identity (including gaps). iORFs that do not overlap a known feature were classified according to conservation levels: (1) conserved in both S. cerevisiae and S. paradoxus, (2) specific and conserved within S. paradoxus, (3) fixed within lineages and divergent among, (4) specific and fixed in one lineage, and (5) polymorphic in at least one lineage (Supplemental Fig. S1).
For iORFs with a minimum size of 60 nt, we also performed a sequence similarity search against the proteome of NCBI RefSeq database (O’Leary et al. 2016) for 417 species in the reference RefSeq category and in the representative fungi RefSeq category (containing 237 fungi species). iORFs with a significant hit (e-value <10−3) were removed to exclude any risk of having an ancient pseudogene. The genomic coordinates of annotated genes and iORFs are available inSupplemental Data.
Evolutionary history of iORFs
Gain and loss events were inferred by comparing presence/absence patterns between ancestral nodes and actual iORFs. Because the ancestral reconstruction was performed using one strain per line-age (see above), polymorphic iORFs absent in all the considered strains were removed from this analysis. iORFs with no detected ancestral homologs were considered as appearing on terminal branches. We estimated the rate of iORF gain/substitution on each branch as the number of iORF gains divided by the number of substitutions (i.e., branch length × sequence size).
Ribosome profiling and mRNA sequencing libraries
Ribosome profiling and mRNA sequencing experiments were con-ducted with S. cerevisiae strain YPS128 (Sniegowski et al. 2002) and with S. paradoxus strains YPS744, MSH604, and MSH587-1 belong-ing, respectively, to groups SpA, SpB, and SpC according to Leducq et al. (2016). We prepared two replicates per strain and library type
(see Methods) (Supplemental Methods). Strains were grown in SOE medium (Murphy et al. 2006). Ribosome profiling footprints were purified using the protocol described by Baudin-Baillieu et al. (2016; seeSupplemental Methods). The rRNAs were depleted in purified ribosome footprints and total mRNA samples using the Ribo-Zero Gold rRNA Removal Kit for yeast (Illumina). Ribosome profiling and total mRNA libraries were constructed using the TruSeq Ribo Profile kit for yeast (Illumina), using the manu-facturer’s instructions starting from the fragmentation and end re-pair step. Libraries were sequenced on an Illumina HiSeq 2500 platform at the Génome Québec Innovation Centre (Montréal, Canada). Raw reads are available from the NCBI SRA data-base (https://www.ncbi.nlm.nih.gov/sra) under accession num-bers SRR5996796 to SRR5996803 for ribosome profiling and SRR6022778 to SRR6022785 for total mRNA experiments.
Detection of translated iORFs
All sequencing libraries were processed using the same procedure. Raw sequences were trimmed of 3′ adapters using Cutadapt (Martin 2011). For RPF data, reads with lengths of 27–33 nt were retained as this size is the most likely to represent footprinted frag-ments. For mRNA, reads of 27–40 nt were retained. Trimmed reads were aligned to the respective genome of each sample using Bowtie version 1.1.2 (Langmead et al. 2009) with parameters –best –chunkmbs 500.
The identification of translation signatures was performed on annotated genes conserved by synteny and on iORFs≥60 nt. We used ribosome profiling read density to detect the translated iORF among overlapping ones. Metagene analysis was performed to detect the P-site for each read length between 28 and 33 nt using the metagene, psite, and get_count_vectors scripts from the Plastid package (Dunn and Weissman 2016) on the two pooled replicates of each strain. We extracted the read densities from the 5′end of the mapped reads, and the distance between the largest peak upstream of the start codon and the start codon itself is taken to be the P-site offset per read length. The 5′end of each mapped read was then subtracted by the P-offset estimate to determine the P-site of each RPF read. Figure 2 andSupplemental Figure S3
were made using an R script (Supplemental Code; R Core Team 2013).
We identified translation initiation signals from ribosome profiling per base read densities by detecting peaks at the start co-don using a custom R script (Supplemental Code). We defined three precision levels of peak initiation:“p3” if the highest peak is located at the first nucleotide of the start codon;“p2” if there is a peak, which is not the highest, at the first position of the start codon; and“p1” if there is a peak at the first position of the start codon ±1 nucleotide. A minimum of five reads was required for peak detection. Read phasing was estimated by counting the num-ber of aligned reads at the first, second, or the third position for all codons, excluding the first codon, in the first 51 nt of the consid-ered iORF or gene. We then tested for a significant deviation from the expected ratio with no periodicity, that is, 1/3 of each, with a binomial test. We applied an FDR correction for multiple testing. A minimum of 15 reads was required for phasing detection.
iORF families or genes with an initiation peak and a signi-ficant periodicity, that is, an FDR corrected P-value <0.05, in at least one strain were considered as translated and named tORFs.
For translation signature detection with the RiboTaper software (Calviello et al. 2016), we used read lengths, for which we obtained the best in-frame phasing with annotated genes ac-cording to quality check plots provided by RiboTaper, and which are 30–31 nt for SpA, 30–32 for SpB, and 31–32 for SpC, as well as a P-offset of 13.
Differential expression analysis
Reads were strand-specifically mapped to tORFs and conserved genes using the coverageBed command from the BEDTools pack-age version 2.26.0 (Quinlan and Hall 2010), with parameter -s. We examined significant tORF expression changes using DESeq2 (Love et al. 2014) using a 5% FDR and minimum of twofold chan-ge. We identified lineage-specific expression increases when the expression of the tORFs in the considered lineage was significantly more expressed than for the other strains in all pairwise com-parisons. For SpB-SpC increases, we selected tORFs when SpB and SpC strains were both more expressed than YPS128 and SpA, and S. paradoxus increases when all S. paradoxus lineages were more expressed than YPS128. For the visualization of tORF sequence coverage (Fig. 5;Supplemental Fig. S8), we extracted the per base coverage on the same strand using the genomecov command from the BEDTools package version 2.26.0 (Quinlan and Hall 2010). The normalization was performed by dividing the perbase coverage of each library with the size factors estimated with DESeq2 (Love et al. 2014).
Strain construction for in vivo translation confirmation
Forty-five tORFs along with 12 canonical genes (Supplemental Table S5) were fused to a modified full-length Dhfr that confers resistance to MTX (Tarassov et al. 2008) in-frame, as well as out-of-frame as a control. Dhfr along with a HPH-resistance module (on a pAG32-DHFR1,2-3; synthesized by Synbio Tech) were PCR amplified (Kapa HiFi DNA polymerase, Kapa Biosystems) using primers that, at each end, added homology regions flanking the stop codon of the tORF of interest (Supplemental Table S6). Forward primers were flush with the stop codon for the in-frame integration and were−2 bp for the out-of-frame one (Fig. 6A). To fuse the Dhfr with the tORFs, 8 µL of the PCR products was used for transformations in SpA (YPS744), SpB (MSH604), and SpC (MSH587-1; only SpC for the canonical genes) according to the method described previously (Bleuven et al. 2018). Successful transformations were confirmed by growth on YPD + 250 µg/mL hygromycin B (HYG) + 100 µg/mL nourseothricin (NAT) and by PCR amplification of the region containing the tORF tagged with Dhfr.
Phenotyping of DHFR-tagged strains
Transformed strains were incubated in 2-mL 96-deepwell plates containing 1 mL of liquid YPD + HYG + NAT medium for 24 h at 30°C. Different 96-arrays were made, and the strains were printed onto solid YPD + HYG + NAT plates (omnitrays) using a robotic platform (BM5-SC1, S&P Robotics) with appropriate pin tools (96, 384, and 1536). Plates were incubated for 2 d at 30°C. The solid medium 96-arrays were pinned into 384-arrays and then into a 1536-array. The final 1536-plate was then replicated into the same format on a second YPD + HYG + NAT plate to get more uniformly sized colonies. Plates were incubated for 2 d at 30°C between each step. All strains were present in five or six replicates. To avoid positional effects of the plate borders, the two outer rows and columns were filled with a control strain (BY4743 LSM8-DHFR F[1,2]/CDC39-DHFR F[3]). All strains were then transferred to DMSO (control) and MTX DHFR PCA media (0.67% yeast nitrogen base without amino acids and without ammonium sulfate, 2% glucose, 2.5% noble agar, drop-out without adenine, methionine, and lysine, and 200 µg/mL MTX diluted in DMSO [or only DMSO in the control medium]). Plates were incubated for 4 d at 30°C, af-ter which a second round of MTX selection was performed to decrease noise. Plates were incubated for another 4 d at 30°C. Images were taken with an EOS Rebel T5i camera (Canon) every
2 h during the entire course of the experiment. Incubation and imaging were performed in a spImager custom platform (S&P Robotics). Data from the second round of MTX selection were used for the downstream analysis.
Images were processed using the gitter.batch function in the R package Gitter (Wagih, Parts 2014, version 1.1.1). The last image of each experiment was used as a reference image to ensure accu-rate identification of colonies at early timepoints. Colony sizes af-ter∼60 h of growth (the 30th image) were extracted, and the median was calculated for the replicates (Fig. 6B;Supplemental Table S7). Translation was called (1) if we observed colony size dif-ferences between in-frame and out-of-frame constructions on MTX medium with a Student’s t-test (P-value <0.05), and (2) if both positive controls (growth in DMSO medium) display colony sizes measured in pixels of more than 1000 and with similar growth for both controls.
Spot-dilution assays were performed using precultures of cells expressing DHFR fused to tORFs of interest adjusted to an OD600of
one in water. Fivefold serial dilutions were performed, and 6 µL of each dilution was spotted on DMSO and MTX PCA media. Plates were incubated for 5 d at 30°C and imaged each day with an EOS Rebel T3i camera (Canon). Pictures shown in Figure 6C and
Supplemental Figure S9were taken on the second day.
Expression and sequence properties
Normalized read counts for ribosome profiling and total mRNA samples were extracted with DESeq2 (Love et al. 2014) and aver-aged across replicates (Supplemental Fig. S13). Because tORFs tend to be shorter compared with known genes (Fig. 4A), the TE for genes and tORFs was calculated as the ratio of RPF over total mRNA normalized read counts on the first 60 nt to reduce the bias introduced by the high number of reads at the initiation co-don compared to the rest of the sequences, which tends to increase TE estimates in short tORFs compared with longer genes. We ex-cluded tORFs and genes with less than 10 total RNA reads in the first 60 nt for the TE calculation. Slope differences between genes and tORFs were tested with an ANCOVA.
The intrinsic disorder was calculated for genes and intergenic tORFs using IUPRED (Dosztanyi et al. 2005). The SNP rate was cal-culated for each syntenic intergenic region by dividing the total number of intergenic SNPs in S. paradoxus alignments by the total number of nucleotides in the region, as previously described (Agier and Fischer 2012). We used codeml from PAML version 4.7 (Yang 2007) to estimate the likelihood of the dN/dS ratios, using the
same procedure as used by Carvunis et al. (2012) with codon mod-el 0. All analyses were conducted and figures were created using Python and R (Supplemental Code; R Core Team 2013).
Data access
High-throughput sequencing data generated in this study have been submitted to the NCBI BioProject database (https:// www.ncbi.nlm.nih.gov/bioproject) under accession number PRJNA400476 (Sequence Read Archive [SRA; https://www.ncbi .nlm.nih.gov/sra] accession numbers SRR5996796–SRR5996803 for ribosome profiling and SRR6022778–SRR6022785 for total mRNA experiments). New assemblies, annotation files, and custom analysis scripts are available asSupplemental Dataand
Supplemental Code.
Acknowledgments
We thank G. Charron and the IBIS sequencing platform (B. Boyle) for technical help and A.R. Carvunis, R. Dandage, and the
reviewers for comments on the manuscript. This work was sup-ported by a Natural Sciences and Engineering Research Council of Canada (NSERC) Discovery grant and a Fonds de recherche Nature et Technologies Quebec (FRQNT) Team Grant (2015-PR-181807) to C.R.L. C.R.L. holds the Canada Research Chair in Evolutionary Cell and Systems Biology.
Author contributions: E.D. and C.R.L. conceived the project. E.D., O.N., I.H., and I.G.-A. designed ribosome profiling experi-ments. E.D., I.G.-A., and I.H. performed ribosome profiling exper-iments. A.K.D., J.H., I.G.-A., and C.R.L. designed and performed functional validation experiments. E.D. performed the bioinfor-matics analyses with helpful advice from L.N.-T., C.R.L., and O.N. E.D. wrote the manuscript with revisions from all authors.
References
Agier N, Fischer G. 2012. The mutational profile of the yeast genome is shaped by replication. Mol Biol Evol29: 905–913. doi:10.1093/mol bev/msr280
Assefa S, Keane TM, Otto TD, Newbold C, Berriman M. 2009. ABACAS: algo-rithm-based automatic contiguation of assembled sequences. Bioinformatics25: 1968–1969. doi:10.1093/bioinformatics/btp347 Bataillon T, Bailey SF. 2014. Effects of new mutations on fitness: insights
from models and data. Ann N Y Acad Sci1320: 76–92. doi:10.1111/ nyas.12460
Baudin-Baillieu A, Hatin I, Legendre R, Namy O. 2016. Translation analysis at the genome scale by ribosome profiling. Methods Mol Biol1361: 105– 124. doi:10.1007/978-1-4939-3079-1_7
Begun DJ, Lindfors HA, Thompson ME, Holloway AK. 2006. Recently evolved genes identified from Drosophila yakuba and D. erecta accessory gland expressed sequence tags. Genetics172: 1675–1681. doi:10.1534/ genetics.105.050336
Begun DJ, Lindfors HA, Kern AD, Jones CD. 2007. Evidence for de novo evo-lution of testis-expressed genes in the Drosophila yakuba/Drosophila erecta clade. Genetics 176: 1131–1137. doi:10.1534/genetics.106 .069245
Bleuven C, Dubé AK, Nguyen GQ, Gagnon-Arsenault I, Martin H, Landry CR. 2018. A collection of barcoded natural isolates of Saccharomyces par-adoxus to study microbial evolutionary ecology. MicrobiologyOpen2018: e773. doi:10.1002/mbo3.773
Cai J, Zhao R, Jiang H, Wang W. 2008. De novo origination of a new protein-coding gene in Saccharomyces cerevisiae. Genetics179: 487–496. doi:10 .1534/genetics.107.084491
Calviello L, Mukherjee N, Wyler E, Zauber H, Hirsekorn A, Selbach M, Landthaler M, Obermayer B, Ohler U. 2016. Detecting actively trans-lated open reading frames in ribosome profiling data. Nat Methods13: 165–170. doi:10.1038/nmeth.3688
Carvunis AR, Rolland T, Wapinski I, Calderwood MA, Yildirim MA, Simonis N, Charloteaux B, Hidalgo CA, Barbette J, Santhanam B, et al. 2012. Proto-genes and de novo gene birth. Nature 487: 370–374. doi:10 .1038/nature11184
Casola C. 2018. From de novo to“de nono”: The majority of novel protein-coding genes identified with phylostratigraphy are old genes or recent duplicates. Genome Biol Evol10: 2906–2918. doi:10.1093/gbe/evy231 Charron G, Leducq JB, Landry CR. 2014. Chromosomal variation segregates
within incipient species and correlates with reproductive isolation. Mol Ecol23: 4362–4372. doi:10.1111/mec.12864
Chen S, Krinsky BH, Long M. 2013. New genes as drivers of phenotypic evo-lution. Nat Rev Genet14: 645–660. doi:10.1038/nrg3521
Clark MB, Amaral PP, Schlesinger FJ, Dinger ME, Taft RJ, Rinn JL, Ponting CP, Stadler PF, Morris KV, Morillon A, et al. 2011. The reality of pervasive transcription. PLoS Biol 9: e1000625; discussion e1001102. doi:10 .1371/journal.pbio.1000625
David L, Huber W, Granovskaia M, Toedling J, Palm CJ, Bofkin L, Jones T, Davis RW, Steinmetz LM. 2006. A high-resolution map of transcription in the yeast genome. Proc Natl Acad Sci103: 5320–5325. doi:10.1073/ pnas.0601091103
Dosztanyi Z, Csizmok V, Tompa P, Simon I. 2005. IUPred: web server for the prediction of intrinsically unstructured regions of proteins based on es-timated energy content. Bioinformatics21: 3433–3434. doi:10.1093/bio informatics/bti541
Drillon G, Carbone A, Fischer G. 2014. SynChro: a fast and easy tool to re-construct and visualize synteny blocks along eukaryotic chromosomes. PLoS One9: e92621. doi:10.1371/journal.pone.0092621
Dunn JG, Weissman JS. 2016. Plastid: nucleotide-resolution analysis of next-generation sequencing and genomics data. BMC Genomics17: 958. doi:10.1186/s12864-016-3278-x
Eberlein C, Nielly-Thibault L, Maaroufi H, Dubé AK, Leducq JB, Charron G, Landry CR. 2017. The rapid evolution of an ohnolog contributes to the ecological specialization of incipient yeast species. Mol Biol Evol34: 2173–2186. doi:10.1093/molbev/msx153
Edgar RC. 2004. MUSCLE: multiple sequence alignment with high accuracy and high throughput. Nucleic Acids Res32: 1792–1797. doi:10.1093/ nar/gkh340
Freschi L, Torres-Quiroz F, Dubé AK, Landry CR. 2013. qPCA: a scalable assay to measure the perturbation of protein–protein interactions in living cells. Mol Biosyst9: 36–43. doi:10.1039/C2MB25265A
Gubala AM, Schmitz JF, Kearns MJ, Vinh TT, Bornberg-Bauer E, Wolfner MF, Findlay GD. 2017. The goddard and saturn genes are essential for Drosophila male fertility and may have arisen de novo. Mol Biol Evol 34: 1066–1082. doi:10.1093/molbev/msx057
Guindon S, Dufayard JF, Lefort V, Anisimova M, Hordijk W, Gascuel O. 2010. New algorithms and methods to estimate maximum-likelihood phylogenies: assessing the performance of PhyML 3.0. Syst Biol59: 307–321. doi:10.1093/sysbio/syq010
Holmes IH. 2017. Historian: accurate reconstruction of ancestral sequences and evolutionary rates. Bioinformatics33: 1227–1229. doi:10.1093/bio informatics/btw791
Ingolia NT. 2014. Ribosome profiling: new views of translation, from single codons to genome scale. Nat Rev Genet15: 205–213. doi:10.1038/ nrg3645
Ingolia NT, Ghaemmaghami S, Newman JR, Weissman JS. 2009. Genome-wide analysis in vivo of translation with nucleotide resolution using ri-bosome profiling. Science324: 218–223. doi:10.1126/science.1168978 Ji Z, Song R, Regev A, Struhl K. 2015. Many lncRNAs, 5′UTRs, and pseudo-genes are translated and some are likely to express functional proteins. eLife4: e08890. doi:10.7554/eLife.08890
Kellis M, Patterson N, Endrizzi M, Birren B, Lander ES. 2003. Sequencing and comparison of yeast species to identify genes and regulatory elements. Nature423: 241–254. doi:10.1038/nature01644
Knowles DG, McLysaght A. 2009. Recent de novo origin of human protein-coding genes. Genome Res19: 1752–1759. doi:10.1101/gr.095026.109 Landry CR, Zhong X, Nielly-Thibault L, Roucou X. 2015. Found in
transla-tion: functions and evolution of a recently discovered alternative prote-ome. Curr Opin Struct Biol32: 74–80. doi:10.1016/j.sbi.2015.02.017 Langmead B, Trapnell C, Pop M, Salzberg SL. 2009. Ultrafast and
memory-efficient alignment of short DNA sequences to the human genome. Genome Biol10: R25. doi:10.1186/gb-2009-10-3-r25
Leducq JB, Nielly-Thibault L, Charron G, Eberlein C, Verta JP, Samani P, Sylvester K, Hittinger CT, Bell G, Landry CR. 2016. Speciation driven by hybridization and chromosomal plasticity in a wild yeast. Nat Microbiol1: 15003. doi:10.1038/nmicrobiol.2015.3
Leducq JB, Henault M, Charron G, Nielly-Thibault L, Terrat Y, Fiumera HL, Shapiro BJ, Landry CR. 2017. Mitochondrial recombination and intro-gression during speciation by hybridization. Mol Biol Evol34: 1947– 1959. doi:10.1093/molbev/msx139
Lefort V, Longueville JE, Gascuel O. 2017. SMS: smart model selection in PhyML. Mol Biol Evol34: 2422–2424. doi:10.1093/molbev/msx149 Levine MT, Jones CD, Kern AD, Lindfors HA, Begun DJ. 2006. Novel genes
derived from noncoding DNA in Drosophila melanogaster are frequently X-linked and exhibit testis-biased expression. Proc Natl Acad Sci103: 9935–9939. doi:10.1073/pnas.0509809103
Li CY, Zhang Y, Wang Z, Zhang Y, Cao C, Zhang PW, Lu SJ, Li XM, Yu Q, Zheng X, et al. 2010. A human-specific de novo protein-coding gene as-sociated with human brain functions. PLoS Comput Biol6: e1000734. doi:10.1371/journal.pcbi.1000734
Love MI, Huber W, Anders S. 2014. Moderated estimation of fold change and dispersion for RNA-seq data with DESeq2. Genome Biol15: 550. doi:10.1186/s13059-014-0550-8
Lu TC, Leu JY, Lin WC. 2017. A Comprehensive analysis of transcript-sup-ported de novo genes in Saccharomyces sensu stricto yeasts. Mol Biol Evol34: 2823–2838. doi:10.1093/molbev/msx210
Martin M. 2011. Cutadapt removes adapter sequences from high-through-put sequencing reads. EMBnetjournal17: 10–12. doi:10.14806/ej.17.1 .200
McLysaght A, Hurst LD. 2016. Open questions in the study of de novo genes: what, how and why. Nat Rev Genet17: 567–578. doi:10.1038/ nrg.2016.78
McManus CJ, May GE, Spealman P, Shteyman A. 2014. Ribosome profiling reveals post-transcriptional buffering of divergent gene expression in yeast. Genome Res24: 422–430. doi:10.1101/gr.164996.113
Miele V, Penel S, Duret L. 2011. Ultra-fast sequence clustering from similar-ity networks with SiLiX. BMC Bioinformatics12: 116. doi:10.1186/1471-2105-12-116
Murphy HA, Kuehne HA, Francis CA, Sniegowski PD. 2006. Mate choice as-says and mating propensity differences in natural yeast populations. Biol Lett2: 553–556. doi:10.1098/rsbl.2006.0534
Naranjo S, Smith JD, Artieri CG, Zhang M, Zhou Y, Palmer ME, Fraser HB. 2015. Dissecting the genetic basis of a complex cis-regulatory adapta-tion. PLoS Genet11: e1005751. doi:10.1371/journal.pgen.1005751 Neme R, Amador C, Yildirim B, McConnell E, Tautz D. 2017. Random
sequences are an abundant source of bioactive RNAs or peptides. Nat Ecol Evol1: 0217. doi:10.1038/s41559-017-0127
Nielly-Thibault L, Landry CR. 2018. Differences between the de novo prote-ome and its non-functional precursor can result from neutral con-straints on its birth process, not necessarily from natural selection alone. bioRxiv doi:10.1101/289330
O’Leary NA, Wright MW, Brister JR, Ciufo S, Haddad D, McVeigh R, Rajput B, Robbertse B, Smith-White B, Ako-Adjei D, et al. 2016. Reference se-quence (RefSeq) database at NCBI: current status, taxonomic expansion, and functional annotation. Nucleic Acids Res44: D733–D745. doi:10 .1093/nar/gkv1189
Pelechano V, Wei W, Steinmetz LM. 2013. Extensive transcriptional hetero-geneity revealed by isoform profiling. Nature497: 127–131. doi:10 .1038/nature12121
Peng Y, Leung HC, Yiu SM, Chin FY. 2012. IDBA-UD: a de novo assembler for single-cell and metagenomic sequencing data with highly uneven depth. Bioinformatics 28: 1420–1428. doi:10.1093/bioinformatics/ bts174
Peter J, De Chiara M, Friedrich A, Yue JX, Pflieger D, Bergstrom A, Sigwalt A, Barre B, Freel K, Llored A, et al. 2018. Genome evolution across 1011 Saccharomyces cerevisiae isolates. Nature 556: 339–344. doi:10.1038/ s41586-018-0030-5
Quinlan AR, Hall IM. 2010. BEDTools: a flexible suite of utilities for compar-ing genomic features. Bioinformatics26: 841–842. doi:10.1093/bioinfor matics/btq033
R Core Team. 2013. R: a language and environment for statistical computing. R Foundation for Statistical Computing, Vienna. http://www.R-project .org/.
Ruiz-Orera J, Messeguer X, Subirana JA, Alba MM. 2014. Long non-coding RNAs as a source of new peptides. eLife3: e03523. doi:10.7554/eLife .03523
Ruiz-Orera J, Verdaguer-Grau P, Villanueva-Canas JL, Messeguer X, Alba MM. 2018. Translation of neutrally evolving peptides provides a basis for de novo gene evolution. Nat Ecol Evol2: 890–896. doi:10.1038/ s41559-018-0506-6
Scannell DR, Zill OA, Rokas A, Payen C, Dunham MJ, Eisen MB, Rine J, Johnston M, Hittinger CT. 2011. The awesome power of yeast evolution-ary genetics: new genome sequences and strain resources for the Saccharomyces sensu stricto genus. G3 (Bethesda)1: 11–25. doi:10.1534/ g3.111.000273
Schlötterer C. 2015. Genes from scratch—the evolutionary fate of de novo genes. Trends Genet31: 215–219. doi:10.1016/j.tig.2015.02.007 Sieber P, Platzer M, Schuster S. 2018. The definition of open reading frame
revisited. Trends Genet34: 167–170. doi:10.1016/j.tig.2017.12.009 Smit A, Hubley R, Green P. 2013–2015. RepeatMasker Open-4.0. http://
www.repeatmasker.org/.
Sniegowski PD, Dombrowski PG, Fingerman E. 2002. Saccharomyces cerevi-siae and Saccharomyces paradoxus coexist in a natural woodland site in North America and display different levels of reproductive isolation from European conspecifics. FEMS Yeast Res1: 299–306. doi:10.1111/j .1567-1364.2002.tb00048.x
Stanke M, Diekhans M, Baertsch R, Haussler D. 2008. Using native and syntenically mapped cDNA alignments to improve de novo gene finding. Bioinformatics24: 637–644. doi:10.1093/bioinformatics/ btn013
Tarassov K, Messier V, Landry CR, Radinovic S, Serna Molina MM, Shames I, Malitskaya Y, Vogel J, Bussey H, Michnick SW. 2008. An in vivo map of the yeast protein interactome. Science320: 1465–1470. doi:10.1126/sci ence.1153878
Tautz D, Domazet-Lošo T. 2011. The evolutionary origin of orphan genes. Nat Rev Genet12: 692–702. doi:10.1038/nrg3053
Vakirlis NN, Hebert AS, Opulente DA, Achaz G, Hittinger CT, Fischer G, Coon JJ, Lafontaine I. 2018. A molecular portrait of de novo genes in yeasts. Mol Biol Evol35: 631–645. doi:10.1093/molbev/msx315 Weiss CV, Roop JI, Hackley RK, Chuong JN, Grigoriev IV, Arkin AP, Skerker
JM, Brem RB. 2018. Genetic dissection of interspecific differences in yeast thermotolerance. Nat Genet50: 1501–1504. doi:10.1038/s41588-018-0243-4
Wilson BA, Masel J. 2011. Putatively noncoding transcripts show extensive association with ribosomes. Genome Biol Evol3: 1245–1252. doi:10 .1093/gbe/evr099
Wilson BA, Foy SG, Neme R, Masel J. 2017. Young genes are highly disor-dered as predicted by the preadaptation hypothesis of de novo gene birth. Nat Ecol Evol1: 0146. doi:10.1038/s41559-017-0146
Wolf YI, Novichkov PS, Karev GP, Koonin EV, Lipman DJ. 2009. The univer-sal distribution of evolutionary rates of genes and distinct characteristics of eukaryotic genes of different apparent ages. Proc Natl Acad Sci106: 7273–7280. doi:10.1073/pnas.0901808106
Xie C, Zhang YE, Chen JY, Liu CJ, Zhou WZ, Li Y, Zhang M, Zhang R, Wei L, Li CY. 2012. Hominoid-specific de novo protein-coding genes originat-ing from long non-codoriginat-ing RNAs. PLoS Genet 8: e1002942. doi:10 .1371/journal.pgen.1002942
Yang Z. 2007. PAML 4: phylogenetic analysis by maximum likelihood. Mol Biol Evol24: 1586–1591. doi:10.1093/molbev/msm088
Zerbino DR, Achuthan P, Akanni W, Amode MR, Barrell D, Bhai J, Billis K, Cummins C, Gall A, Giron CG, et al. 2018. Ensembl 2018. Nucleic Acids Res46: D754–D761. doi:10.1093/nar/gkx1098
Zhou Q, Zhang G, Zhang Y, Xu S, Zhao R, Zhan Z, Li X, Ding Y, Yang S, Wang W. 2008. On the origin of new genes in Drosophila. Genome Res 18: 1446–1455. doi:10.1101/gr.076588.108