Revised, June 2006
Growth, Reform indicators and
Policy complementarities
Jorge Braga de Macedo
Joaquim Oliveira Martins
Faculty of Economics, UNL
Economics Department, OECD
Abstract
This paper discusses the design of structural policies by relating second-best results and the complementarity of reforms. It computes a complementarity index based on structural reform indicators compiled by the EBRD for transition countries, assuming that the run-up to EU integration corresponds to a nearly complete policy cycle. Using econometric panel estimates, the level of reforms and changes in their complementarity are found to be positively related to output growth, corrected for endogeneity, and given initial conditions and the extent of macroeconomic stabilisation.
Keywords: Second-best, Complementarity, structural reforms, reform indicators, economic growth, transition, panel data
JEL classification: P2, O40, C33
(*) Braga de Macedo: Universidade Nova de Lisboa Email: [email protected]. Oliveira Martins: OECD
Economics Department, 2 Rue André Pascal, 75775 Paris Cedex 16. Email: [email protected]. We
thank Francesca Pissarides for allowing us to access the EBRD database and Silas Xu for helpful research assistance. We also thank participants in the Fall 2004 seminar on International Development at Sciences Po, Paris, where the empirical work was first presented in February 2005; participants at seminar in Universidade Nova de Lisboa, September 2005, in particular Luis Campos e Cunha, Luis Catela; participants at the invited session on Policy Complementarities sponsored by Banco de Portugal at LACEA Annual Conference, October 2005, Paris, in particular Ricardo Hausman. The views expressed are those of
Index
1. Introduction ... 3
2. Second-best and reform strategy ... 4
3. From second-best to Supermodularity and policy complementarity... 5
4. Empirical application: the transition process in Central and Eastern Europe ... 7
4.1. The EBRD Transition indicators ... 9
5. Composite Reform Indicators and Complementarity ... 9
6. Reform level, complementarity and growth: an empirical test... 11
7. Conclusions and further research... 13
Appendix: Complementarity, Supermodularity and Optimisation ... 14
1. Introduction
As economic reforms are mutually interdependent, a liberal policy package needs internal coherence. How can a coherent reform strategy be achieved for a well-balanced and functional economic system? The theory of second-best originated in Lipsey and Lancaster (1956) suggests that in the presence of a large number of distortions, a piecemeal reform approach is unlikely to produce a good strategy and actually may reduce welfare. Yet, a radial reform strategy achieving proportional reductions in all distortions at the same time can be shown to be unambiguously welfare improving. This result is due to Foster and Sonnenschein (1970) and was generalised by Rader (1976) and Bergstrom (1996).
The difficulty and time needed to build institutions often leads to adopt a compromise: some short-term deadweight losses are accepted to reap the long-term benefits of reforms. A piecemeal approach to reform has been also justified on the grounds of political constraints as political cycles are often too short to engage several reform fronts at the same time.
The idea of engaging several reforms in parallel may also reflect policy complementarities. This goes back to Edgeworth (“doing more in one thing increases the returns to doing more of another”) but it has been generalised in such a way that it does not require any particular differentiability or convexity assumptions (Topkis, 1998). This framework has been applied notably to industrial organisation and institutional analysis (e.g. Milgrom and Roberts, 1995; Amable, 2003). Rather than focusing on the constraint of removing all distortions at the same time or in equal proportions, the existence of complementarity signals a benefit instead, i.e. the return of doing one reform is enhanced when other reforms are in place.
Nevertheless, relatively little attention has been paid to complementarity in the vast literature relating the design and the scope of reforms to overall economic performance. To be sure, cross-section or panel regressions of composite reform indicators on growth have provided mixed or inconclusive evidence. The link between liberal reforms and growth was been questioned by Rodrik (2003), who points out that there is not a unique mapping from institutional function to form and therefore that liberal economic reforms are not the only path to achieving the goal of creating a full-fledged market economy capable of sustaining growth. Such reforms are more likely to fall prey to the second-best argument when there is a tendency for ready-made policy packages (e.g. Washington-consensus type) and much less is known about local conditions. Independently of whether results are favourable to the presumption that reforms improve economy’s prospects, Rodrik (2005) criticises regressions of composite reform indicators on the rate of GDP growth. He stresses that we know much more about sustaining growth in high-income countries, but much less about igniting growth in poor countries. For the latter, non-orthodox policies could be appropriate to trigger a growth process. Growth, in turn, would help sustaining reform.
This has two important consequences. First, Rodrik’s analysis suggests that rather than a broad-based reform, the lesson is to concentrate on the key barrier(s) to growth, rather than trying to
undertake all reforms (or removing all distortions) at once. Second, policies are typically endogenous to the growth process. In many countries, the sequence was rather first high growth, then better institutions rather than the reverse. In this context, usual regressions of economic growth on policies may not give many insights on how economic development unfolds (Rodrik, 2005).
Against this background, this paper proposes a framework aiming at somewhat reconciling the core result of second-best theory, according to which a liberal reform package has to be comprehensive by nature, with the fact that igniting a reform process may require focusing on the main distortions blocking the take-off of the economy. To this aim, we define a complementarity index across structural reforms and investigate its impact on economic growth. We used a set of structural reform indicators compiled by the EBRD for Central and Eastern European countries in transition. While broadly qualitative, these indicators provide a sufficiently comprehensive and consistent evaluation by the EBRD experts of the structural transformation transition process. Taking the transition process as a policy experiment is particularly attractive. Allowing for different initial conditions, at the outset, all transition countries were offered roughly the same liberal policy package designed to make use of market mechanisms to obtain the best possible allocation of resources. Countries have implemented this package in different ways and extent leading to a wide and rich variation of outcomes. Starting in the early 1990s up to the integration of in the EU of new Member countries, this period also corresponds to a nearly complete policy cycle.
The structure of the paper is as follows. The next two sections briefly discuss the basis for the second-best result and the mathematics of complementarity. This is followed by an analysis of main reform areas and the interdependence of policies in the context of emerging markets and transition countries, using information collected in OECD country surveys, and describes the content and some features of the EBRD reform indicators. Section 5 considers composite reform indicators, focusing on reform level and complementarity. Using these indicators, we then test the impact of the level and changes of reform indicators on output growth by means of an econometric panel estimate. The paper ends with a summary and thoughts for further research, especially on how to draw the insights from the previous analysis and results to EU reform strategy.
2. Second-best and reform strategy
The seminal paper by Lipsey and Lancaster (1956) proved that starting from a second-best situation, the only way to ensure a non-ambiguous increase in welfare is to remove all the distortions simultaneously. From this rather pessimistic view on the way to conduct economic reforms and their impact on economic reform on welfare, Foster and Sonnenschein (1970) proved that, under some conditions, the following result holds in single-equilibrium theory:
Theorem (Foster and Sonneschein, 1970): With a flat production function and if no commodity is inferior in the production function, then a radial increase in distortion is associated with a reduction in utility.
A radial increase in distortion derives from the comparison between two d-equilibria, each characterised by a level of distortions, D1 and D2, where D2=k.D1 and k>1. The index k can be seen as a proportional shift in all distortions simultaneously compared with the first-best situation. This isomorphic shift is required in order to ensure that the mapping between d-equilibria and distortion is unique.
The correspondence between a proportional reduction in distortions and tax reforms is relatively easy to understand. In more general cases, it may be quite difficult to define a set of meaningful indicators, having the same dimensionality and range of variation. Nevertheless, the development of institutional and reform indicators in recent years has made significant progress in this direction.1
Let us assume that N reform areas have been identified and a set of indicators (R1, R2,…., RN) defined in such a way that when considering a proportional move in all reform areas:
i
k
R
R
i i=
>
∀
∆
,
0
(1)this is equivalent to a radial removal of distortions. Under appropriate conditions, each value of the parameter k would then define a single d-equilibrium. In principle, it could be possible to construct a composite indicator measuring how far a given reform package is far from a radial move. For example, one minus the variance of the different ki would provide an appropriate Euclidean metric:
( )
∑
−
−
=
i ik
k
N
RR
1
1
ˆ
2 (2)where kˆ is the average of the ki. RR=1 would imply a radial shift in the distortions.
3. From second-best to Supermodularity and policy complementarity
Accordingly, a reform strategy ensuring a non-ambiguous increase in welfare would be to reduce the distortions progressively in a radial manner. The problem is that such a reform package would lead to an overly ambitious policy agenda. It is difficult to imagine that a government, especially in less developed countries, has the information set and the institutional capacity to implement such a broad strategy. Rodrik(2006) put forward a similar argument by pointing out that a policy advice based on broad-based reform is somewhat unfalsifiable in terms of its impacts on economic performance (e.g. GDP growth). When the impact of reforms does not
materialise as expected, it can always be argued that some policy areas were left out and hindered the overall return of reform package “In the end, it is always the advisee who falls short, and never the advisor who is proved wrong”.
Moreover, the conditions to apply the Foster and Sonnenschein’s result are rather restrictive. A flat production rules out any peculiarities in the indifference curves. Together with the isomorphic distortion these conditions avoid multiple equilibria. While the intuition for a ‘radial’ reform strategy is strong, in the sense that there is no welfare gains from piecemeal reforms, the conditions appear very demanding even in a static framework.
In view of the empirical application we are seeking, the modern concept of complementarity (Topkis, 1987, 1998) provides an alternative and more flexible framework in which to address reform interdependence. It does not require any particular differentiability or convexity assumptions, and for example it can be applied to discrete or qualitative policy indicators. The framework applies to the case where different reforms (or removal of distortions) are pair-wise complementary. As argued below, this seems a relatively general property. It is more often the case that policies are related to each other in a complementarity way rather than being substitutes.
The basic idea is as follows. Assume a given objective function F(.) depending from two policy instruments (x, y). A given policy can have two states either reform (x) or no-reform (x). In this context, the two policies are said to be complementarity if:
) , ( ) , ( ) , ( ) , (x y F x y F x y F x y F − ≤ − (3)
This means that return of moving from minimum (
x,
y
) to (x,
y
) (or to (x,
y
)) is less than the move from (x,
y
) (or from (x,
y
)) to the maximum (x,y). Put differently, even tough F(.) always increases, the return from doing reform x (or y) is greater when reform y (or x) is already in place. This formalises the fact that having done one reform maximises the return of doing another reform. Note that Edgeworth complementarity is a special case where the complementarity can be defined in a differential way:∂
2F
(
x
,
y
)
∂
x
∂
y
≥
0
.This can be generalised to a case of N reforms. If the complementarity relations (3) hold for every pair of reforms, F(.) is said to be supermodular. Optimising in such a system can be achieved by increasing all reforms in parallel (but not necessarily in the same proportion as in radial reductions in distortions). As shown by Milgrom and Roberts (1995) this achieves at least half of the potential gains of an unrestricted optimisation (see Annex).
This powerful result only applies in comparative statics, so the issues of temporal consistency, reputation, etc. cannot be addressed in the framework as it stands. However, we can define a time interval suitable for a given reform package and define pair-wise complementarities that will achieve the predicted increase in welfare. This can be done for various stages in the process of economic growth without the recursive link among stages of reform, which has been found by the sequencing literature. Under these conditions, a joint implementation of complementary reforms would then unambiguously improve welfare, just like a radial reduction in distortions.
This optimisation framework has been applied by Milgrom and Roberts (1995); Amable (2003) and Amir (2003), while Acemoglu(2005) presents monotone comparative static results on equilibrium technology bias.
What reforms should be included in a reform package depends on the complementarity relations existing for a specific country and a given point in time. For example, as it will be discussed below a price liberalisation policy entails a strong complementarity with macroeconomic stabilisation and vice-versa. There may also be gains in jointly implementing labour and product market reforms even though the greater rigidity of the former has led some authors (Blanchard and Giavazzi, 2002) to suggest that the link may be recursive rather than supermodular. The policy implication is that complementarity is an empirical issue, but there is more room for reform packages embodying complementarity relations than has generally been thought. Effective reform packages do pertain to a particular stage in the growth process and should be adjusted by constantly broadening the complementarity across policies as growth moves from the neo-classical to Neo-Schumpeterian regimes of Aghion and Howitt(2005). Below we focus on the transition process.
4. Empirical application: the transition process in Central and Eastern Europe
A decade of transition provides a particular insightful case to explore the linkages across different economic reforms. At the outset, all transition countries started from a highly distorted system and were offered roughly the same liberal policy package designed to make use of market mechanisms to obtain the best possible allocation of resources, which in turn creates the conditions for sustainable growth and an improvement of living standards. Of course initial conditions differed greatly and this was pointed out at the time. In retrospect, what was perhaps overlooked was that such a package would need to be implemented in an internally coherent way.
Indeed, when policies are mutually interdependent, in order to reap the full benefits from reform, different policies must, as far as possible, be implemented in parallel. Also because reforms are interdependent, a direction of causality is not easy to disentangle. Actually, in first place, most transition countries liberalised trade and a large basket of prices, typically excluding prices of energy, housing and transport. As a result, the true pattern of demand is revealed as relative prices adjust. This was followed by stabilisation, but if the right macroeconomic policy mix is not in place, notably when a budget deficit is financed through monetary creation, price liberalisation is quickly followed by high and accelerating inflation. In turn, macroeconomic stabilisation can only be sustained and lead to economic recovery if significant and steady progress is achieved in the area of structural reform. For example, efforts to achieve and maintain budget discipline were undermined where enterprises faced weak budget constraints and drew resources from the public sector (OECD, 1998, 2002). The channel for this was often not direct subsidy from the budget, but instead over-easy access to credit from the banking system, often itself in full or partial state ownership. Another example of indirect support is where the state maintained an artificially overvalued exchange rate in order to facilitate imports of raw materials
or energy to un-restructured heavy industries. This situation persists until firms that fail to add value are forced out of the market. During transition, privatisation and restructuring were all used to encourage this outcome. But often this process was held back by insufficient use of liquidation, the result of ineffective bankruptcy procedures and weak creditor rights.
Lack of progress in one area affects other structural reforms. For example, large enterprise restructuring is undermined in the absence of financial discipline, typically imposed by the banking sector. Either banks do not lend, regardless of companies’ creditworthiness, to prevent a new accumulation of bad debts, thus reinforcing existing credit constraints. Or else, under pressure to resume the flow of lending to un-restructured enterprises, financial problems in the banking sector re-emerge. Likewise, if bankruptcy proceedings are not effective, banks cannot both provide credits and impose financial discipline. For example, cases of rapid banking sector liberalisation without these microeconomic conditions in place were often followed by severe systemic crisis (OECD, 2000).
More generally, positive structural interactions do not necessarily follow policy implementation. The problem is not only to solve the question of stocks, such as bad debts, but also to ensure that the flows, namely exit and entry of firms, new financing and investment, are adequately balanced. When the flow problems have not been solved, the stock problems tend to re-emerge, with the risk that their resolution becomes even more costly. Where exit mechanisms are enforced and induce enterprise liquidations but where the conditions for entry of new enterprises are not in place, the pace of restructuring may become politically unsustainable as unemployment rises and the economy fail to recover rapidly.
Another example of the macro-structural complementarity is when an exchange rate anchors designed to trigger a disinflation process induce a massive increase in the relative prices of the non-tradable sector. When appropriate competition or regulatory policies are not implemented, this shock in relative prices together with low price elasticity generates large rents and constitutes a drag on the potential growth in the economy. This effect can be exacerbated when policies or incentives towards human capital investment do not exist because the traditional tradable sector also tends to loose international price competitiveness.
Along these lines, Table 4.1 summarises the main policy interdependences just discussed and provides examples of the policy feedbacks by main policy blocks, in the sense that implementing a reform block increases the return of implementing another one. This provides a first snapshot of the potential complementarities existing across reforms. These linkages are at the centre of the transition process. Several OECD studies in this area concluded that it was more important to ensure that these links operated adequately rather than pushing reform in any single area, including institutional development (OECD, 1998, 1999, 2000, 2002). One important implication of what amounts to an implicit preference for “radial” strategies or, in a looser way, to the existence of policy complementarities is that reform reversals can magnify the costs of transition (reduce the benefits of reform) perhaps threatening progress in the most advanced policy areas.
4.1. The EBRD Transition indicators
The empirical basis for the observation of the reform process in transition countries was taken from the EBRD Transition Report, which provides indicators available for 27 transition countries since 1989. The countries are listed in Annex 1, together with the coverage of the three groupings considered, reflecting initial conditions but also expected terminal conditions in what pertains to EU membership, where European countries are distinguished from the New Independent States (NIS) of the former Soviet Union.
The indicators cover eight main structural reform areas listed in Table 4.2, plus an indicator of physical infrastructure development which proxies the attractiveness of the economy to domestic and foreign investors. The EBRD indicators are ranked from 1 (no-reform) to 4+ (full reform). For completeness, macroeconomic stabilisation is proxied by one additional indicator, the rate of consumer price inflation (labelled CPI).2
[Table 4.2 EBRD Reform Indicators]
5. Composite Reform Indicators and Complementarity
Having a set of reform indicators, the question is whether reform momentum is concentrated in some reform areas or more evenly distributed.3 A transition process that would aim at minimising the welfare losses associated with a piecemeal reform in a second-best context would tend to minimise the gap between the different reform areas, while increasing the average level of reforms. To evaluate it we need to measure policy complementarity. The basic idea is that one needs to find a metric that verifies the property of complementarity. For example, let us assume three reform areas valued in the range [1, 4] as the EBRD indicators. Then, a move from (1,1,1) to (2,2,2) should be better than a move to (4,1,1), although in terms of the average reform level there is no difference.
A reform strategy exploiting policy synergies should then be reflected into an even distribution of individual reform indicators. A simple way to capture this is to measure the concentration of reforms by means of the usual Hirschmann-Herfindhal indicator and take the reciprocal of it, as an index of reform complementarity (RC):
∑
⋅
=
i iN
RL
R
RC
1
2 (4)2 Other proxies were considered (e.g. budget deficits, current account balances, etc.), but the CPI turned
out to perform rather well in the econometric tests.
3 In a previous version of this paper, there is a more detailed description of the transition process and
composite reform indicators. This version can be downloaded from the LACEA Annual Conference 2005 website at lacea.org.
where RL is the simple average4 year by year of the nine sectoral indicators and N for the number of reform areas. There is an interesting relationship between the level and the complementarity of reforms. In order to draw this relation, it can be shown that the range of variation for the two indicators is as follows:
[
]
(
)
⋅ − + − + ∈ ∈ N R N R R N R RC R R RL , ) 1 ( ) 1 ( , 2 min 2 max 2 min max max min (5)where Rmin and Rmax stand for, respectively, the minimum and the maximum reform score (in this case 1 and 4+).
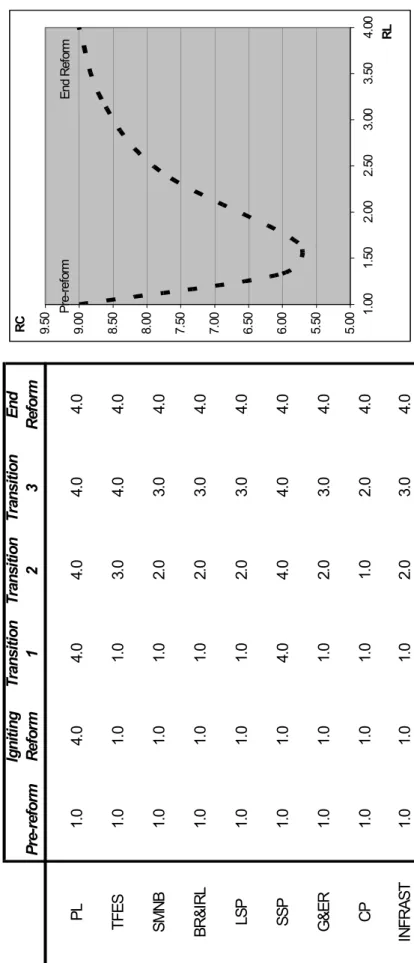
To illustrate the links between these two indicators we can construct a hypothetical case where the reform process starts only in one or two reform areas and then, progressively, is extended to all reform areas up to the point where all reform indicators reach the maximum reform score. This point can be viewed as the end of a policy cycle. This produces a U-shaped relationship between RL and RC, the average level of reforms and the complementarity index, as illustrated in Figure 5.1.
[Figure 5.1 Reform Level and Complementarity: a hypothetical case]
It is interesting to note that the d-equilibria, discussed in section 2, are all iso-complementarity loci with the RC indicator at its maximum. In some sense, a radial reform strategy could be described in terms of the complementarity indicator by a process removing distortions in such a way that RC never decreases throughout the transition process.
Turning now to our actual sample, Figure 5.1 shows that the reform process was indeed characterised by a significant decrease of complementarity at the beginning of transition. This can be interpreted as follows. Transition is about shifting from a socialist system that had a high complementarity, but was totally rigid and distorted, towards a flexible market system that also displays a high complementarity. To make this structural change not all distortions could be removed at the same time so complementarity decreased.
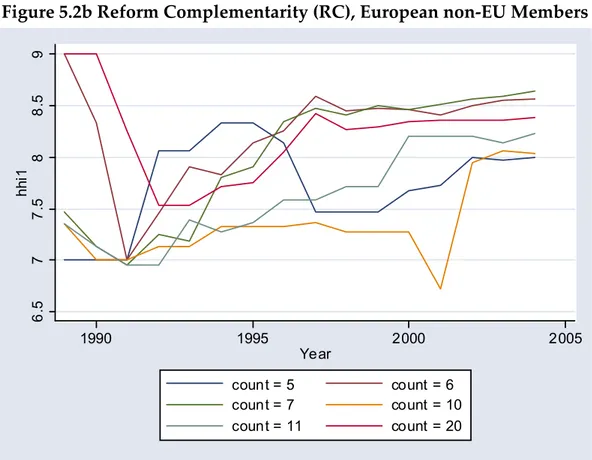
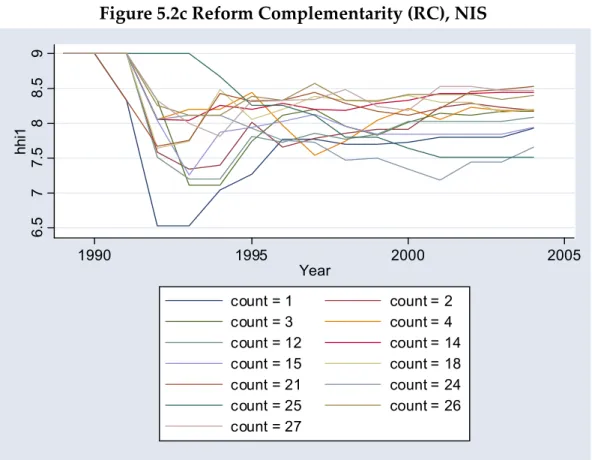
[Figure 5.2 Reform complementarity (RC) during transition]
Interestingly, the most successful transition countries were able to resume the complementarity of reforms during the transition process, whereas the lagging or slow-reformers were not able to implement the reform process in the same way. Therefore, as it could be expected, reform complementarity has increased in the more advanced transition countries that integrated recently the EU.
4 Depending on some form of evaluation of the relative importance of policy areas, this indicator could be
computed using a particular weighting scheme. Of course, this would not change the main thrust of the results.
As an aside, there are some insights to be drawn in terms of the comparison between the reform process in China and in the former Central and Eastern European countries. The fact that the Chinese transition has avoided the large output loss observed in latter group of countries could be related to the fact its reform process approach was able to decrease market distortions without overly decreasing the overall complementarity of the economic cum institutional system, but this testing hypothesis is left for future research.
6. Reform level, complementarity and growth: an empirical test
The indicators presented in the previous section, RL and RC, are now related to the growth rate of real output. The fact that the ignition of reforms is reflected in a decrease of complementarity is equivalent to say that not all distortions could be removed at the same time. As discussed in the introduction, this is typically a second-best situation, which can entail a loss of welfare (or output, as a proxy). This transitional cost could be reflected in income losses at the beginning of the transition. This theoretical intuition is verified in our sample for the New EU Members, as the relationship between the average level of reforms and GDP growth shows an initial decline followed by an increase until the end of the policy cycle. No such a pattern appears for the Non-EU group where growth displays a much more erratic relation with the level of reforms.
Our empirical test takes as a starting point the Falcetti et al. (2002, 2005)’s investigation on the relative importance of three sets of factors – initial conditions, macroeconomic stabilisation and structural reforms – as determinants of growth in transition economies. They argued that the usual debate on the role of initial conditions is much driven by the way the econometric test is conducted. A simple cross-section analysis tends to give a much greater weight to initial conditions. This is due to the fact that commitment to reform accelerates convergence. This effect can be better captured by a panel regression, where the role of reforms emerges strongly. Their main result is that “…countries that ‘defied the odds’ by reforming more rapidly and extensively than predicted by a simple non-linear time trend, have reaped substantial growth dividends and this time the effect is highly significant.”
In their final remarks, they also point out that the literature on reforms and performance has so far largely failed to address the question of “the complementarities between further liberalization and privatisation and deeper institutional reform, which have recently received so much emphasis in the policy debate… Responding effectively to the challenges of the next decade will require more than the recipes of the past.” By integrating both level and complementarity of reforms, this paper aims at closing this gap. Indeed, if transition countries –mainly those integrating the EU– were able to trigger a reform process and overcome the costs of the initial economic recession, our theoretical analysis (section 2) suggests that sustaining growth requires a broader reform strategy.
We first followed the specification of Falcetti et al. (2002), i.e. the growth rate of GDP is related to the level of the reform indicators.5 While this specification is followed in many growth regression studies, our framework suggests rather that the variation of distortions (or the reform indicators) should be related to output variations.
Accordingly, we tested a specification where both the levels and variations of the reform indicators are included among the regressors (Table 6.1). In order to test for the robustness of the results the estimates were carried out through different estimators: first using the usual fixed-effect estimator, not allowing incorporating the time invariant variable related to the initial conditions. Then the initial conditions were added in the context of a GLS random-effects model. Finally, a dynamic GMM model (cf. Arellano and Bover, 1998)6 was estimated in order to correct for possible endogeneity bias between growth, inflation and the level of reforms. This addresses Rodrik (2005)’s critique of the endogeneity of policy indicators in growth regressions.
[Table 6.1 Growth, Reform level and Complementarity: an econometric test]
The results confirm that the countries having a higher reform level (RL) tend to have higher GDP growth, but the variation of RL displays a negative sign. Thus, an increment of reforms usually induces a negative impact on growth, which is typically the second-best result. Over the long-run, when reform becomes more broad-based higher levels of reforms are related to higher growth rates. The complementarity indicator displays a symmetric pattern, as its level displays a negative sign while its variation has the expected positive sign. Indeed, a high complementarity by itself does not necessarily lead to higher output growth, because in our sample, unreformed countries may have had for some period higher complementarity than reforming ones. To sum-up, only the level of reforms and the changes in their complementary have a positive impact on growth. The former effect provides a long-run target for reforms, while the latter provides guidance on the conduct of the transition process.
5 This test was carried out through a panel regression (27 countries by 16 years) including initial
conditions, a measure of stabilisation and the level of reforms, but with different proxies for the initial conditions and macroeconomic stabilisation. In addition, we included the complementarity index defined above. For the New European members, the results provide relatively robust evidence that the reform indicators play a more important role than the initial conditions. This could be expected, as the catch-up process in this group lessens the role of the starting conditions. In this sub-sample, both the level and the complementarity of reforms display positive and significant coefficients. In the European non-EU members, the impact of pre-transition GDP level is negative, no doubt a consequence of the conflict in the Balkans and the effect of complementarity does not appear significant. The same applies for the NIS group. This is not surprising, as the growth performance in the latter groups is more noisy and volatile and there were a number of policy reversals. An additional regression where the time sample was restricted to the initial stages of transition (say, from 1989 to 1995) for all countries would show that the reform indicator appears not significant, while the complementary index appears positive and significant. The results are available in the paper quoted in footnote 3.
7. Conclusions and further research
Liberal economic reforms are seen as reducing distortions, thereby raising profitability in the more productive sectors of the national economy. If there are many such distortions, then eliminating only few of them may be perverse for national welfare, threatening the sustainability of the reform process. The complexity of the relationship between reforms and growth is thus one reason why it has been so difficult to capture it empirically. Here, we introduce the concept of reform complementarity, in addition to the level of reforms, and use them to explain the relationship between reforms and growth in transition countries.
The paper attempted to reconcile the usual presumption that a liberal reform package has to be comprehensive by nature with the fact that igniting growth may sometimes require focusing on the main distortions blocking the take-off of the economy (see Hausman, Rodrik and Velasco, 2005). Relating the level with the complementarity of reforms provided a basis for regressing them on output growth. A set of structural reform indicators compiled by the EBRD for Central and Eastern European countries in transition was used, assuming that the run-up to EU integration corresponds to a nearly complete policy cycle. We found the reform level and the change in reform complementarity to be positively related to output growth, given initial conditions and the extent of macroeconomic stabilization as proxied by the rate of inflation, correcting for possible endogeneity bias between these variables.
The insights gained from this study of the management of the transition process could be applied into the broader context of the EU integration process and reform. The EU countries are facing the challenge of globalisation. This shock is putting pressure for reform on what could have been viewed as the relatively coherent system, combining rigid labour markets, highly regulated product markets, together with some degree of financial centralization (Amable, 2003). Currently, the EU economy is diverging from the more dynamic economic areas, in particular the US and Asia. Resuming this gap seems to require a degree of flexibility higher than the one currently embodied in the so-called ‘European model’, but the question is how to conduct such a reform process in such a way that maximises output gains (or minimises possible output losses). In this paper we have argued that using policy complementarities could be part of the answer. The complementarity index presented here could be refined to take into account more complex outcomes than the annual rate of growth, on the hand, and several levels of decision making on the other. In effect, complementarity at the national level will certainly not suffice when it comes to common policies. Even in what pertains to national policies, the interaction between levels of government must be taken into account. We believe though that complementarity will remain a useful concept in understand economic growth and development.
Appendix: Complementarity, Supermodularity and Optimisation
Edgeworth was the first propose the idea of complementarity. Factors are Edgeworth complements if having more of one factor increases the return on the other factor. Assuming mixed partial derivatives of the objective function exist, the sign of the mixed partial derivative would be positive. However, in most economic applications smooth mixed partials are restrictive -hence the interest in developing a system where this is unnecessary. Lattice theory is a branch of mathematics that provides a formal foundation for complementarity and supermodularity. A lattice (X;≥) is a set X with the property that for any x and y in X, there exist an element in X larger than or equal to x and y, and there exist an element smaller than or equal to x and y.
y
x∨ denotes the smallest element larger than or equal to x and y (join operation)
y
x∧ denotes the largest element smaller than or equal to x and y (meet operation)
A sublattice is a subset of a lattice that is closed under the operations of meet and join. For example, the real numbers is a lattice and any subset of the real numbers is also a lattice. A sublattice mathematically expresses a kind of technical complementarity. If a solution x is chosen from a sublattice of ℜn(representing n inputs for example), then it means that increasing the value of some variable never prevents increasing the others as well. Thus complementarity is only really relevant if the space we are considering is a lattice.
In this context, supermodularity can be defined as: given an objective function f on a lattice X, f is supermodular and its arguments are complements if and only if for any x and y in X:
) ( ) ( ) ( ) (x f x y f x y f y f − ∧ ≤ ∨ − (A1)
In two dimensions we can replace the meet and join operators by explicitly writing out each coordinate, as given in the section 3 in the text.
Supermodularity and optimization
Supermodularity also has interesting applications for optimizing an objective function. If x and y maximize a supermodular f on a sublattice S, then x∨ yand x∧ y also maximize f.
Quick proof: Since f(x) = f(y), then from supermodularity: 2⋅ f(x)≤ f(x∨y)+ f(x∧y). But since
x maximizes f: f(x)≥ f(x∨y) andf(x)≥ f(x∧y). Thus, f(x)= f(x∨y)= f(x∧y). This
means that the maximizers of f have an interesting pattern: 1) Either they are strictly ordered (component by component)
2) For any unordered pair of maximizers, there must be maximizers strictly greater or less than either of these two maximizers.
Supermodularity also enables the decision maker to more easily check if x maximizes an objective function f, because one can restrict the search only to those points greater or less than x. This reduces the search space dramatically from
2
northants to just 2. If this restricted search space does not contain a point x’ such that f(x′)≥ f(x), then there are no points in the entire lattice S that gives a higher payoff.It is interesting to also note that simply optimizing over this restricted domain will give at least 50% of the potential gains in an unrestricted optimization. The proof is relatively simple:
Since Equation A1 is true for all x and y. The following is also true: ) ( ) ( ) ( ) (y f x y f x y f x f − ∧ ≤ ∨ − (A2)
We can change the sign of Equation A2: ) ( ) ( ) ( ) (y f x y f x y f x f − ∨ ≤ ∧ − (A3)
Combining the previous two equations, and simplifying we get:
[
f
(
x
∧
y
)
−
f
(
x
)
] [
+
f
(
x
∨
y
)
−
f
(
x
)
]
≥
f
(
y
)
−
f
(
x
)
(A4) Assume that y is the global optimum of f. Let x’ be the maximum of f subject to x′≤x or x′≥x.Since (x∧y)≤x and (x∨y)≤x, it follows that:
[
(
)
(
)
] [
(
)
(
)
] [
(
)
(
)
]
(
)
(
)
2
⋅
f
x
′
−
f
x
≥
f
x
∧
y
−
f
x
+
f
x
∨
y
−
f
x
≥
f
y
−
f
x
(A5) This implies that:[
(
)
(
)
]
/
2
)
(
)
(
x
f
x
f
y
f
x
f
′
−
≥
−
(A6)Data Annex: Country list and groupings
The list of the countries covered in the EBRD database and the regional groupings used in the text are as follows:
Country code/name Regional Grouping
1 Albania NEU 2 Armenia NIS 3 Azerbaijan NIS 4 Belarus NIS 5 Bosnia NEU 6 Bulgaria NEU 7 Croatia NEU
8 Czech Republic NWEU
9 Estonia NWEU
10 Federal Republic of Yugoslavia NEU 11 Former Yugoslav Republic of Macedonia NEU
12 Georgia NIS 13 Hungary NWEU 14 Kazakhstan NIS 15 Kyrgyzstan NIS 16 Latvia NWEU 17 Lithuania NWEU 18 Moldova NIS 19 Poland NWEU 20 Romania NEU 21 Russia NIS
22 Slovak Republic NWEU
23 Slovenia NWEU
24 Tajikistan NIS
25 Turkmenistan NIS
26 Ukraine NIS
REFERENCES
Acemoglu, D. (2005), “Equilibrium Bias of Techonology”, MIT Economics Department Working Paper no. 05-30.
Aghion, P. and P. Howitt (2005), "Appropriate Growth Policy: A Unifying Framework", Paper presented at the OECD Conference on Global convergence scenarios: structural and policy issues, Paris, January 2006.
Amable, B. (2003), The Diversity of Modern Capitalism, Oxford: Oxford University Press.
Amir, R. (2003), “Supermodularity and Complementarity in Economics: an Elementary Survey”, CORE.
Arellano, M. and O. Bover (1998), “Another look at the instrumental variable estimation of error-components models”, Journal of Econometrics, Vol. 68, pp. 29-52.
Bergstrom, T. (1996), “Comment on The Welfare Loss of Price Distortion”, mimeo, Department of Economics UCSB.
Blanchard, O. and F. Giavazzi (2002), "Macroeconomic Effects of Regulation and Deregulation in Goods and Labor Markets“, MIT Dept. of Economics Working Paper No. 01-02.
EBRD, Transition Report (several issues).
Falcetti E., M. Raiser and P. Sanfey (2002), "Defying the odds: initial conditions, reforms and growth in the first decade of transition", EBRD Working paper no. 55
Falcetti E., M. Raiser and P. Sanfey (2005), " Reforms and growth in transition: re-examining the evidence", EBRD Working paper no. 90
Foster, E. and H. Sonnenschein (1970), “Price Distortion and Economic Welfare”, Econometrica, 38, 281-297.
Hausmann, R., D. Rodrik and A. Velasco (2005), “Growth Diagnostics”, mimeo, Harvard University.
Lipsey, R.G. and K. Lancaster (1956), “The General Theory of Second Best”, The Review of Economic Studies, 24, 11-32.
Milgrom, P. and J. Roberts (1990), “The Economics of Modern Manufacturing: Technology, Strategy, and Organisation”, The American Economic Review, 80, 511-528.
Milgrom, P. and J. Roberts (1995), “Complementarities and Fit Strategy, Structure, and Organisation Change in Manufacturing”, Journal of Accounting and Economics, 19, 179-208. Nardo, M., M. Saisana, A. Saltelli, S. Tarentola, A. Hoffman and E. Giovaninni (2005), Handbook
on Constructing Composite Indicators: Methodology and User Guide, OECD Statistics Working Paper 2005(3).
OECD (1998), Economic Survey of Romania, Paris. OECD (1999), Economic Survey of Slovak Republic, Paris.
OECD (2000), Regional Economic Survey of the Baltic countries, Paris. OECD (2002), Economic Survey of Romania, Paris.
Rader, T. (1976), “The Welfare Losses of Price Distortion”, Econometrica, vol. 44, no. 6, 1253-1257. Roodman, D (2005), "xtabond2: Stata module to extend xtabond dynamic panel data estimator",
Center for Global Development, Washington,
downloadable at: http://econpapers.repec.org/software/bocbocode/s435901.htm
Rodrik, D. (2003), “Growth Strategies”, forthcoming in P. Aghion and S. Durlauf (eds.), Handbook of Economic Growth, North-Holland.
Rodrik, D. (2005), “Why We Learn Nothing from Regressing Economic Growth on Policies”, mimeo, Harvard University.
Rodrik, D. (2006), “Goodbye Washington Consensus, Hello Washington Confusion?”, mimeo, Harvard University.
Topkis, D.M. (1987), "Minimising a Submodular Function on a Lattice", Operations Research, 26(2), pp. 305-321.
19
Figure 5.1 Reform lev
els and Comple
menta
rity: a hypothetical
cas
e
Pr e-re fo rm Igni tin g Re fo rm Tr an si tion 1 Tr an si tion 2 Tr ans iti on 3 E nd Re fo rm P L 1. 0 4. 0 4. 0 4. 0 4. 0 4. 0 TF E S 1. 0 1. 0 1. 0 3. 0 4. 0 4. 0 S M N B 1. 0 1. 0 1. 0 2. 0 3. 0 4. 0 B R & IR L 1. 0 1. 0 1. 0 2. 0 3. 0 4. 0 LS P 1. 0 1. 0 1. 0 2. 0 3. 0 4. 0 S S P 1. 0 1. 0 4. 0 4. 0 4. 0 4. 0 G & E R 1. 0 1. 0 1. 0 2. 0 3. 0 4. 0 C P 1. 0 1. 0 1. 0 1. 0 2. 0 4. 0 IN FR A S T 1. 0 1.0 1. 0 2.0 3. 0 4.0 5. 00 5. 50 6. 00 6. 50 7. 00 7. 50 8. 00 8. 50 9. 00 9. 50 1. 00 1. 50 2. 00 2. 50 3. 00 3. 50 4. 00 RC RL P re -re fo rm En d Re fo rmFigure 5.2a Reform Complementarity (RC), New EU Members
7 7. 5 8 8. 5 9 hh i1 1990 1995 2000 2005 Year count = 8 count = 9 count = 13 count = 16 count = 17 count = 19 count = 22 count = 23Figure 5.2b Reform Complementarity (RC), European non-EU Members
6. 5 7 7. 5 8 8. 5 9 hh i1 1990 1995 2000 2005 Year count = 5 count = 6 count = 7 count = 10 count = 11 count = 20
Figure 5.2c Reform Complementarity (RC), NIS
6. 5 7 7. 5 8 8.5 9 hh i1 1990 1995 2000 2005 Year count = 1 count = 2 count = 3 count = 4 count = 12 count = 14 count = 15 count = 18 count = 21 count = 24 count = 25 count = 26 count = 2722
Table 4.1 Matrix o
f po
sitiv
e li
nkag
es during
transit
io
n
L IBE RA LI S A T ION S T A B IL IS A T IO N F INA N C IA L REF O RM MECH A N ISMS OF EX IT MECH A N ISMS OF E N T R Y LIB E R A L ISAT IO N (P ri ce s & Tarif fs) -- De ma nd p re ssu re becom es me asu rab le Be tt er a ss essm en t of cre d it w o rt hi ne ss C o m p et it iv e pre ssu re s ( e.g. imp o rt d iscip lin e) Low er en tr y barr ie rs S T ABI L IS AT IO N Pr ev en ts Hy p erin fla tio n -- En d of inf lat ion ar y re v en u es & cr o w di ng-ou t of stat e fi na nc ing P o si tiv e re al i n te re st ra te s, r ed u ct io n of distor ti on ar y su bsidi es Stabl e en vi ro n m en t fo r inv estm ent; lev el p la y ing fi eld FI NA N C IA L RE FOR M Suppor t of f o re ig n trad e lib era lisat ion P rev en ts pressure for li qu idity in je ctio n fo r tr ou bl ed bank s -- Suppor t of har d -b u d g et c o n str ai n ts Im p ro v ed c red it condit ions and o th er fi na nc ing sou rc es MECH A N ISMS OF EXI T & RE GU LAT IO N erp ris e p ri v atis atio n, liqu id atio n and re st ru ctu ring ) Suppor t of lib eral isatio n me asu re s ( e.g. p u b lic u tiliti es ) Pr ev en ts accumulatio n of arre ar s & publ ic co n tin ge n t li ab il it ie s R edu ce s fi nan cia l indis cip li n e & b ad de bt s -- Re le as e of re sou rc es; re du ct ion o f en tr y b ar ri er s MECH A N ISMS OF E N TRY Imp o rt comp et itio n & e x por t p romotio n Su stains tax bas e & ea se s d em an d pre ssu re Cre at es viab le cr ed it op p o rtu n iti es fo r bank s Easing o f re sou rc e re -a lloc atio n ; pre v ents stag nat ion & u n em p lo y m ent --sitiv
e l
inkag
e fro
m blo
ck A
(in line)
to
blo
ck B (in
co
lumn)
.
23
T
able 4. 2 E
B
RD T
ransitio
n ind
icato
rs
(1) LS P: La rg e-S cal e P riv atisatio n (2) SS P: Smal l-Sca le Priv atisatio n (3) G & ER: Gov ernan ce & En te rp ri se R est ru ctu ri n g (4) PL : Pr ic e L ib eral isati o n (5) T & FES: Trad e a n d Fo re ig n Ex ch ang e Syst em (6) C P : Comp et itio n Po li cy (7) BR &IRL: Ba nki n g R efor m & I n te re st Rat e L ib er al isatio n (8) S M &N B : S ecu rit ie s Mark et s & N o n-B ank fi n anci al i n st itu tio n s (9) INFR AST: In fr ast ru ct u re24