HAL Id: hal-02320860
https://hal-mines-albi.archives-ouvertes.fr/hal-02320860
Submitted on 5 Feb 2020
HAL is a multi-disciplinary open access
archive for the deposit and dissemination of
sci-entific research documents, whether they are
pub-lished or not. The documents may come from
teaching and research institutions in France or
abroad, or from public or private research centers.
L’archive ouverte pluridisciplinaire HAL, est
destinée au dépôt et à la diffusion de documents
scientifiques de niveau recherche, publiés ou non,
émanant des établissements d’enseignement et de
recherche français ou étrangers, des laboratoires
publics ou privés.
Parametric study via full factorial design for glycerol
supercritical gasification
Houcinat Ibtissem, Outili Nawel, Elsa Weiss-Hortala, Meniai
Abdeslam-Hassen
To cite this version:
Houcinat Ibtissem, Outili Nawel, Elsa Weiss-Hortala, Meniai Abdeslam-Hassen. Parametric study via
full factorial design for glycerol supercritical gasification. Biofuels, Bioproducts & Biorefining, Wiley,
In press, pp.1-14. �10.1080/17597269.2019.1675270�. �hal-02320860�
Parametric study via full factorial design for glycerol supercritical gasification
Houcinat Ibtissema, Outili Nawela, Weiss-Hortala Elsaband Meniai Abdeslam-Hassena
aProcess Engineering Faculty, Laboratory of Environmental Process Engineering LIPE, Constantine3 University, Constantine, Algeria; bRAPSODEE Center, IMT Mines Albi, Albi, France
ABSTRACT
Supercritical water gasification is a promising technology for pollution treatment and syngas pro-duction from biomass. The produced gas is composed of hydrogen, carbon dioxide, methane, car-bon monoxide and traces of ethane and other light hydrocarcar-bons. This work aims to give a comprehensive experimental study of the supercritical water gasification of glycerol using a full factorial design of experiments (DOE). The effect of five factors, namely: temperature [458!C–542!C], residence time [40–90 min], pressure [23–27MPa], initial concentration of glycerol
[10–19wt%] and KOH catalyst quantity [0.60–1.475 wt%], were investigated on several responses such as the gasification efficiency (GE), syngas composition and lower calorific value (LCV) of the produced gas. First order mathematical models correlating each considered response in terms of the considered factors were developed and validated. Also, the significance of the factors effect was validated using analysis of variance. The results showed that the produced gas composition and quality were strongly influenced by temperature and initial concentration. The largest gas pro-duction was detected at a temperature of 542!C, a residence time of 40 min, a pressure of 27 MPa,
a concentration of 10 wt% glycerol and a KOH catalyst percentage of 1.475 wt%.
KEYWORDS
Full factorial design; gasification efficiency; glycerol; hydrogen production; lower calorific value; supercritical water gasification
Introduction
Biomass is one of the most widely used renewable energy sources in the world. It accounts around 10% of the global energy consumption [1] due to the relatively low cost and reliability of biomass energy, generating much less signifi-cant pollution compared to fossils. The term “biomass” refers to any organic matter derived from living or dead plant material available on a renewable basis and any waste biomass such as municipal solid waste (MSW), bio-solids municipal (wastewater) and animal waste (fertilizer) [2]. Biomass generally contains cellulose, hemicelluloses, lig-nin and low percentages of other substances, including minerals and organic molecules [3].
There are several processes for converting biomass to syn-gas, like anaerobic digestion and fermentation based bio-chemical processes [4] and thermochemical processes such as combustion, liquefaction, pyrolysis and gasification [5,6].
In supercritical water gasification of biomass, at temper-atures and pressure above 374!C and 22.1 MPa, respect-ively, a high pressure keeps fluid density close to that of liquids. Increased thermal conductivity and higher tempera-ture promote the endothermic reforming reaction. [7]. The high temperature keeps the viscosity close to that observed in the gases, increasing the diffusion rates [8]. These properties allow the production of a mixture of recov-erable gases and energy (CO, H2, CH4, etc.) from wet biomass [9]. The composition of the gaseous mixture produced depends not only on the critical operating temperature and pressure, but also on other parameters such as initial biomass concentration, residence time and the presence of a catalyst and several other parameters. For this, different researchers
have experimentally studied the effect of the operating condi-tions on supercritical water gasification.
R. Cherad et al. [10] studied supercritical water gasifica-tion of Laminaria hyperborea in a batch reactor for hydro-gen, methane production and the carbon gasification efficiencies, under various operating parameters namely: presence of catalyst Ru/Al2O3 (5–20%), feed concentration (3.3–13.33%), residence time (0–120min) and temperature (400!C–550!C), their results showed that the carbon gasifi-cation efficiencies increased with reaction temperature, reaction hold time and catalyst loading but decreased with increasing feed concentrations. The presence of catalyst (Ru/Al2O3) promoted the production of hydrogen. In the same context F. Xia et al. [11] studied the effect of operat-ing parameters on the gasification efficiency of lignin, in the presence of KOH as a catalyst in a batch autoclave at the following operating conditions ranges: (5–30 min) for the residence time, (0.5–10) for mass ratio of H2O to lignite, (400!C–600!C) for temperature and (0%–20%) for mass ratio of KOH to lignite, and they found that 47% of the gasification efficiency was achieved at 30 min, 550!C and with 10% KOH. The use of higher values of mass ratio of H2O to lignite, temperature and KOH as catalyst can lead to higher values of gas yield and gasification efficiency GE. Ding et al. [12] did also study the effect of temperature (400!C–550!C) and weight ratio water/biomass (3: 1 and 7: 1) for different catalysts (Ni/CeO2/Al2O3, KOH, calcined dolomite and calcined olivine) on cellulose and pinewood for hydrogen production. The results showed that using KOH for the catalytic gasification of cellulose, the H2 yield increased to 194% at 400!C and a water/biomass ratio of 3. Qadariyah et al. [13] considered the gasification in sub CONTACT Outili Nawel [email protected] Process Engineering Faculty, Laboratory of Environmental Process Engineering LIPE, Constantine3 University, Constantine, Algeria
and supercritical water for the degradation of glycerol in a batch reactor investigating the effects of temperature (200!C–400!C) and reaction time (20–60 min) on acrolein, acetaldehyde and allyl alcohol productions. Acrolein was formed throughout the reaction (sub- and supercritical medium), whereas the amount of acetaldehyde increased at temperature of 400!C where it disappeared to produce allyl alcohol which also disappeared, breaking down into other products at long residence time.
Several factors had been studied by researchers and had proven their individual effects on different dependant vari-ables of supercritical gasification process. However the authors claimed that no previous work had yet considered all these factors, motivating the present study where the effects of five operating parameters (temperature, pressure, initial concentration, residence time and KOH catalyst concen-tration) on several responses or objectives such as the gases (H2, CO, CH4, CO2) production, the gasification efficiency, the lower calorific value and the generated hydrocarbons (CxHy), in batch reactors using supercritical water gasification process, and pure glycerol (C3H8O3) as biomass. The choice of this bio-mass was mainly guided by its natural abundance. Indeed, glycerol is found in all vegetable and animal oils and fats and also it is a by-product of the transesterification of vegetable oils to produce biodiesel and of the saponification reactions [14]. Due to the significant increase of biodiesel production, the value of this by-product had received more attention in recent years [15]. Glycerol as a transesterification by-product has low purity (around 50%–55%) that can be increased by purification treatments to more than 95%, achieving the gly-cerol commercial purity [16].
The experimental design methodology was applied to study the supercritical gasification of pure glycerol using the 25 full factorial designs of experiments (DOE). The con-sidered factor ranges were [458!C–542!C] for the tempera-ture, [23–27 MPa] for the pressure, [10–19 wt%] for the initial concentration of glycerol, [40–90 minutes] for the residence time and [0.60–1.475 wt%] for the potassium hydroxide (KOH) catalyst concentration.
The results analysis was performed statistically and graphically by means of the Minitab 16 software, which was used for regression analysis of the obtained experi-mental data to estimate the coefficients of the first order models and the analysis of variance.
Materials and methods
Reagents
Glycerol (C3H8O3) with a purity of 99.9% was supplied by SIGMA ALDRICH. Glycerol solutions were prepared with ultrapure water. The experiments were carried out with
pure glycerol solutions of concentrations ranging in (10%–19% by weight), in the presence of an alkaline potas-sium hydroxide catalyst (KOH, 0.6%–1.475% by weight).
Experimental protocol
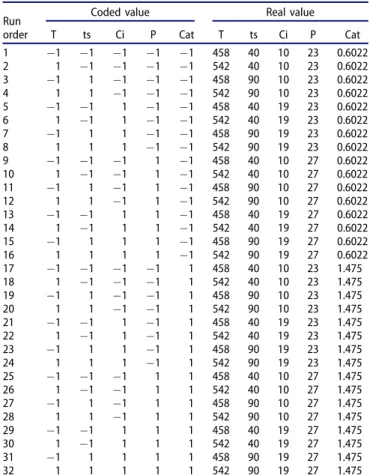
The experiments were carried out in the RAPSODEE labora-tory of IMT- Mines of Albi in France, at 458 or 542!C in batch reactors with allowable maximum temperature and pressure of 600!C and 30 MPa, respectively. These cylin-drical 316 stainless steel mini-autoclaves had inner and outer diameters of 8.5 and 31.4 mm, respectively and an internal volume of 5 ml. The volume of a glycerol solution was calculated using the density (q) depending on the desired temperature and pressure conditions, the proper-ties of the water were calculated by the Mathcad Code IAPWS97 program developed by Benmekhlouf et al. [16]. This solution was introduced into the reactors with the appropriate quantity of potassium hydroxide as a catalyst. Then the reactor was sealed and placed in an electric oven (Nabertherm L5/11/320), preheated to the desired tempera-tures 458!C and 542!C (a time of 9 minutes was necessary to achieve the desired temperature). At the end of the desired reaction time (40–90minutes), the reactor was left Table 1. Intervals of variation of the studied factor in coded and real values.
Variable Unit Symbol
Range and level "1 0 1 Temperature !C T 458 500 542
Residence time min ts 40 65 90 Glycerol concentration Wt % Ci 10 14.5 19 Pressure MPa P 23 25 27 potassium hydroxide
catalyst (KOH) Wt% Cat 0.6022 1.0386 1.475
Table 2. The used factorial design. Run
order
Coded value Real value T ts Ci P Cat T ts Ci P Cat 1 "1 "1 "1 "1 "1 458 40 10 23 0.6022 2 1 "1 "1 "1 "1 542 40 10 23 0.6022 3 "1 1 "1 "1 "1 458 90 10 23 0.6022 4 1 1 "1 "1 "1 542 90 10 23 0.6022 5 "1 "1 1 "1 "1 458 40 19 23 0.6022 6 1 "1 1 "1 "1 542 40 19 23 0.6022 7 "1 1 1 "1 "1 458 90 19 23 0.6022 8 1 1 1 "1 "1 542 90 19 23 0.6022 9 "1 "1 "1 1 "1 458 40 10 27 0.6022 10 1 "1 "1 1 "1 542 40 10 27 0.6022 11 "1 1 "1 1 "1 458 90 10 27 0.6022 12 1 1 "1 1 "1 542 90 10 27 0.6022 13 "1 "1 1 1 "1 458 40 19 27 0.6022 14 1 "1 1 1 "1 542 40 19 27 0.6022 15 "1 1 1 1 "1 458 90 19 27 0.6022 16 1 1 1 1 "1 542 90 19 27 0.6022 17 "1 "1 "1 "1 1 458 40 10 23 1.475 18 1 "1 "1 "1 1 542 40 10 23 1.475 19 "1 1 "1 "1 1 458 90 10 23 1.475 20 1 1 "1 "1 1 542 90 10 23 1.475 21 "1 "1 1 "1 1 458 40 19 23 1.475 22 1 "1 1 "1 1 542 40 19 23 1.475 23 "1 1 1 "1 1 458 90 19 23 1.475 24 1 1 1 "1 1 542 90 19 23 1.475 25 "1 "1 "1 1 1 458 40 10 27 1.475 26 1 "1 "1 1 1 542 40 10 27 1.475 27 "1 1 "1 1 1 458 90 10 27 1.475 28 1 1 "1 1 1 542 90 10 27 1.475 29 "1 "1 1 1 1 458 40 19 27 1.475 30 1 "1 1 1 1 542 40 19 27 1.475 31 "1 1 1 1 1 458 90 19 27 1.475 32 1 1 1 1 1 542 90 19 27 1.475
Table 3. Lower calorific value of produced gases [19].
Gas Lower calorific value (kJ/mol)
H2 242.70 CO 283.40 CH4 803.30 C2H4 1323.97 C2H6 1437.11 C3H8 2044.13 C4H10 2653.60
for 20 min to be cooled down to the ambient temperature (18. 8 ± 2!C).
A phase separation system containing a manometer was used to open the mini autoclave, the reactor was under N2 pressure, and the manometer indicated the vol-ume of the produced gas mixture, once the reactor was open. Then, the gaseous and liquid phases were recov-ered and analyzed.
Product analysis Gaseous phase
The recovered gases were analyzed by gas micro chroma-tography (Agilent PGC-3000), identifying and quantifying in few seconds the produced gases: H2, CO, CO2, CH4, C2H4, C2H6, C3H8and C4H10, with Helium as the carrier gas.
Liquid phase
The liquid residues recovered after phase separation were analyzed by gas chromatography-mass spectrometry (GCMS-TQ 803, collision-induced dissociation (CID)), with Argon and Helium as the carrier gases and a GC-2010 column to identify and quantify the different intermediates of the solution at the end of the reaction. The major compounds in the final solu-tions were as follows: butanediol, dimethyl phenol, methyl cyclopentanone, methyl phenol, propylene glycol, glycerin, butene diol, oxime methoxy-phenyl, 2- trimethyl none, ethanone, 1-(1-cyclohexen-1-yl)-, trimethyl cyclopente-none, ethyl phenol.
The total organic carbon (TOC) meter (Schimadzu TOC-5050) was used to measure the amount of carbon organic and inorganic fractions present in the residue of gly-cerol solutions.
Design of experiments
Full factorial designs may be denoted by the exponential notation 2k, which simply expresses the number of experi-ments for the case of k factors, each one has two levels: the maxima and the minima coded (þ1) and ("1), respect-ively. Thus, for the present study 32 experiments were used for the five considered independent variables: Temperature (T), residence time (ts), initial glycerol concen-tration (Ci), pressure (P) and KOH catalyst concenconcen-tration (Cat).Table 1shows the respective ranges and levels of the studied factors whereas Table 2 presents the 32 experi-ments of the full factorial design 25, both in real and coded values.
In this work, several responses were considered using the factorial design, namely gasification efficiency, gas yield, TOC, lower calorific value and the quantities of all produced gases. The study was thus multiobjective with 10 studied responses.
Gasification efficiency and gas yield
The efficiency of the gasification GE (%) and the gas yield are calculated as follows:
GE ¼Total masse of gasous productTotal mass of glycerol feed (1)
Gas yield ¼molar amount of glycerol feedmolar amount of gaz i (2)
Lower calorific value (LCV)
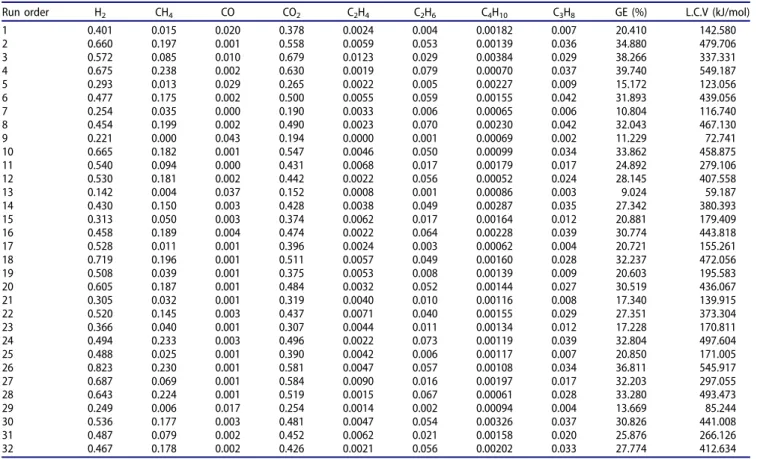
The lower calorific value of a fuel is the energy (per unit of mass) released by its combustion at constant pressure and under normal temperature and pressure conditions (0!C Table 4. Experimental responses of the used DOE.
Run order H2 CH4 CO CO2 C2H4 C2H6 C4H10 C3H8 GE (%) L.C.V (kJ/mol)
1 0.401 0.015 0.020 0.378 0.0024 0.004 0.00182 0.007 20.410 142.580 2 0.660 0.197 0.001 0.558 0.0059 0.053 0.00139 0.036 34.880 479.706 3 0.572 0.085 0.010 0.679 0.0123 0.029 0.00384 0.029 38.266 337.331 4 0.675 0.238 0.002 0.630 0.0019 0.079 0.00070 0.037 39.740 549.187 5 0.293 0.013 0.029 0.265 0.0022 0.005 0.00227 0.009 15.172 123.056 6 0.477 0.175 0.002 0.500 0.0055 0.059 0.00155 0.042 31.893 439.056 7 0.254 0.035 0.000 0.190 0.0033 0.006 0.00065 0.006 10.804 116.740 8 0.454 0.199 0.002 0.490 0.0023 0.070 0.00230 0.042 32.043 467.130 9 0.221 0.000 0.043 0.194 0.0000 0.001 0.00069 0.002 11.229 72.741 10 0.665 0.182 0.001 0.547 0.0046 0.050 0.00099 0.034 33.862 458.875 11 0.540 0.094 0.000 0.431 0.0068 0.017 0.00179 0.017 24.892 279.106 12 0.530 0.181 0.002 0.442 0.0022 0.056 0.00052 0.024 28.145 407.558 13 0.142 0.004 0.037 0.152 0.0008 0.001 0.00086 0.003 9.024 59.187 14 0.430 0.150 0.003 0.428 0.0038 0.049 0.00287 0.035 27.342 380.393 15 0.313 0.050 0.003 0.374 0.0062 0.017 0.00164 0.012 20.881 179.409 16 0.458 0.189 0.004 0.474 0.0022 0.064 0.00228 0.039 30.774 443.818 17 0.528 0.011 0.001 0.396 0.0024 0.003 0.00062 0.004 20.721 155.261 18 0.719 0.196 0.001 0.511 0.0057 0.049 0.00160 0.028 32.237 472.056 19 0.508 0.039 0.001 0.375 0.0053 0.008 0.00139 0.009 20.603 195.583 20 0.605 0.187 0.001 0.484 0.0032 0.052 0.00144 0.027 30.519 436.067 21 0.305 0.032 0.001 0.319 0.0040 0.010 0.00116 0.008 17.340 139.915 22 0.520 0.145 0.003 0.437 0.0071 0.040 0.00155 0.029 27.351 373.304 23 0.366 0.040 0.001 0.307 0.0044 0.011 0.00134 0.012 17.228 170.811 24 0.494 0.233 0.003 0.496 0.0022 0.073 0.00119 0.039 32.804 497.604 25 0.488 0.025 0.001 0.390 0.0042 0.006 0.00117 0.007 20.850 171.005 26 0.823 0.230 0.001 0.581 0.0047 0.057 0.00108 0.034 36.811 545.917 27 0.687 0.069 0.001 0.584 0.0090 0.016 0.00197 0.017 32.203 297.055 28 0.643 0.224 0.001 0.519 0.0015 0.067 0.00061 0.028 33.280 493.473 29 0.249 0.006 0.017 0.254 0.0014 0.002 0.00094 0.004 13.669 85.244 30 0.536 0.177 0.003 0.481 0.0047 0.054 0.00326 0.037 30.826 441.008 31 0.487 0.079 0.002 0.452 0.0062 0.021 0.00158 0.020 25.876 266.126 32 0.467 0.178 0.002 0.426 0.0021 0.056 0.00202 0.033 27.774 412.634
and a pressure of 1013mbar), assuming that the fumes contain water vapor [17].
The lower calorific value of a produced gas mixture is calculated as follows [18]:
LCV ¼
PLCVi mole of gaz i
mole of biomass (3) The lower calorific values of the various pure gases pro-duced in the supercritical water gasification of glycerol are shown inTable 3.
Mathematical models
Data analysis of the used DOE allowed correlating each considered response in terms of all the considered coded
factors X and their interactions, with first order mathemat-ical models of the general form:
Y ¼ a0þ X5 i¼1 ai Xiþ X5 i6¼j aij XiXjþ X5 i6¼j,k aijk XiXjXk þ X 5 i6¼j,k,l aijkl XiXjXkXl (4)
With: Y the considered response, Xi the main factor, XiXj the two levels interactions, XiXjXkthe three levels interactions and XiXjXkXl the four levels interactions, the factors are in the coded values. The a0
s denote the coefficients of the model.
Results and discussions
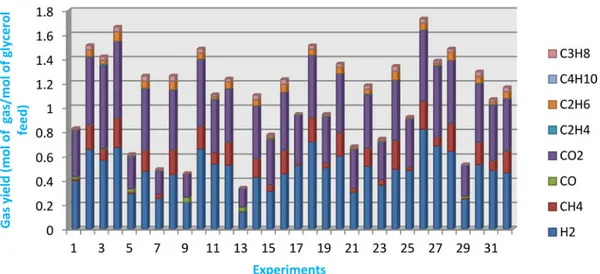
In order to study and quantify the effect of the five inde-pendent variables on the performance of the gasification Figure 1. Gas yield composition for the 32 experiments of the factorial design.
Table 5. Regression coefficients and signification tests for H2production.
Term Coef Coef Ert t-value p-value Constant 0.485 0.00234 206.61 0.003 T 0.088 0.00234 37.33 0.017 ts 0.019 0.00234 7.94 0.080 Ci "0.094 0.00234 "40.20 0.016 P "0.005 0.00234 "2.01 0.294 Cat 0.042 0.00234 17.91 0.036 T ts "0.050 0.00234 "21.36 0.030 T Ci 0.002 0.00234 0.66 0.626 T P 0.002 0.00234 0.66 0.628 T Cat "0.013 0.00234 "5.67 0.111 ts Ci 0.003 0.00234 1.14 0.459 ts P 0.017 0.00234 7.28 0.087 ts Cat "0.013 0.00234 "5.57 0.113 Ci P 0.000 0.00234 "0.16 0.900 Ci Cat "0.004 0.00234 "1.76 0.326 P Cat 0.026 0.00234 10.96 0.058 T ts Ci 0.018 0.00234 7.51 0.084 T ts P "0.030 0.00234 "12.81 0.050 T ts Cat "0.004 0.00234 "1.73 0.333 T Ci P "0.003 0.00234 "1.35 0.406 T Ci Cat 0.000 0.00234 0.13 0.921 T P Cat "0.006 0.00234 "2.62 0.232 ts Ci P 0.008 0.00234 3.27 0.189 ts Ci Cat 0.017 0.00234 7.37 0.086 ts P Cat 0.001 0.00234 0.38 0.770 Ci P Cat "0.014 0.00234 "5.91 0.107 T ts Ci P 0.006 0.00234 2.69 0.226 T ts Ci Cat "0.013 0.00234 "5.39 0.117 T ts P Cat "0.001 0.00234 "0.61 0.650 T Ci P Cat "0.002 0.00234 "0.73 0.598 ts Ci P Cat "0.009 0.00234 "3.79 0.164 Coef ¼ regression coefficients of the model; Coef Ert ¼ standard error for
the coefficient; t-value ¼ student test value; p-value ¼ probability value.
Table 6. Regression coefficients and significance tests for CO2production.
Term Coef Coef Ert t-value p-value Constant 0.430 0.001725 249 0.003 T 0.071 0.001725 41.03 0.016 ts 0.030 0.001725 17.43 0.036 Ci "0.052 0.001725 "29.92 0.021 P "0.009 0.001725 "5.22 0.120 Cat 0.009 0.001725 5.09 0.124 T ts "0.035 0.001725 "20.39 0.031 T Ci 0.018 0.001725 10.40 0.061 T P "0.004 0.001725 "2.42 0.250 T Cat "0.017 0.001725 "9.91 0.064 ts Ci "0.007 0.001725 "3.93 0.159 ts P 0.012 0.001725 7.04 0.090 ts Cat "0.013 0.001725 "7.51 0.084 Ci P 0.011 0.001725 6.58 0.096 Ci Cat 0.010 0.001725 5.76 0.109 P Cat 0.032 0.001725 18.33 0.035 T ts Ci 0.017 0.001725 9.77 0.065 T ts P "0.029 0.001725 "16.78 0.038 T ts Cat 0.008 0.001725 4.37 0.143 T Ci P "0.013 0.001725 "7.30 0.087 T Ci Cat "0.008 0.001725 "4.63 0.135 T P Cat "0.009 0.001725 "5 0.126 ts Ci P 0.016 0.001725 9.25 0.069 ts Ci Cat 0.013 0.001725 7.76 0.082 ts P Cat 0.005 0.001725 3.02 0.204 Ci P Cat "0.027 0.001725 "15.72 0.040 T ts Ci P "0.006 0.001725 "3.70 0.168 T ts Ci Cat "0.012 0.001725 "6.86 0.092 T ts P Cat "0.007 0.001725 "3.96 0.158 T Ci P Cat 0.012 0.001725 6.89 0.092 ts Ci P Cat "0.021 0.001725 "12.31 0.052
of glycerol in supercritical conditions, 10 responses of the factorial design were measured for each experiment.
The experiments suggested by the factorial DOE with the recommended operating conditions ofTable 2, were performed and each experiment of the design matrix was carried out three times to obtain the mean responses shown inTable 4.
The results show the wide variations of the produced gases compositions, with the operation conditions, and as illustrated byFigure 1, the major produced gases were H2, CH4 and CO2. The CO and the other hydrocarbons produc-tions were negligible. Also, the H2 richest syngas was obtained at the maximum temperature, pressure and KOH catalyst concentration values and minimum residence time and initial glycerol concentration values, corresponding to operating conditions of Experiment 26. However Experiment 13 led to the poorest H2 syngas at operating conditions opposite to those of Experiment 26.
Mathematical models and significance effects
The data processing of the obtained results were carried out using Minitab to get a model that correlates each
response to the main factors and all the interactions. Also, the effects of the factors are studied and the models vali-dated using the regression coefficients and signification tests tables with 95% of significance level.
Hydrogen production
Table 5 presents the significance test of the factors and
validates the model with a coefficient of determination R2
¼0.9998 and it also shows the significance of each main factor and all the interactions. The results ofFigure 2 show that temperature, residence time and catalyst concentration had positive effects on H2 production, whereas the initial concentration had a strong negative influence and the effect of pressure was slightly negative but negligible.
The significant negative effect of the initial concentra-tion on hydrogen producconcentra-tion (a Student value of "40.20) is confirmed by Dianningrum et al. [20] who showed that a high initial glycerol concentration was not in favor of H2 production. The adverse effect of increasing the concentra-tion of glycerol on the steam reforming reacconcentra-tion could be (a)
(b)
very sensitive to the concentration of reactive water and solvent, while it had little effect on the pyrolysis reaction providing a gas production source. Also, a high concentra-tion of biomass led to dehydraconcentra-tion or polymerizaconcentra-tion of liquid intermediates to form chars [21,22]. The presence of catalyst (KOH) had a positive effect on hydrogen produc-tion, as confirmed by Kruse et al. [23] who found that the presence of KOH improved the water gas-shift reaction, leading to an increase in the produced hydrogen amount. According to the literature, strong pressure favors the water gas-shift, methanation of CO and CO2, but reduces the reaction rate of biomass decomposition by radical reaction [24,25]. On the other hand, the results show no significant effect of the pressure; this may be due to the low pressure range studied, in agreement with the results found by Guo et al. [24] during the gasification of sawdust.
Regarding interaction effects, the results in Table 5
show that the most important one was due to the inter-action between temperature and residence time (with a t-value of "21.36) which affected negatively the H2 yield. A short residence time of 40 min was sufficient to obtain a high amount of hydrogen. So, it is not necessary to work
with long residence time when high temperature is prevailing.
In fact Figure 2(b). shows that the most important effect of binary interaction is the interaction between tempera-ture and residence time followed by the interaction pres-sure and catalyst concentration. All the other binary interactions may be considered to be non significant.
Carbon dioxide production
The mathematical model that describes the production of CO2was developed with a correlation factor R2 of 0.9998. As shown inTable 6, temperature was the most important factor with a positive effect on carbon dioxide production followed by the residence time and a non significant effect of the cata-lyst concentration with a p-value of 0.124. On the other side, the initial concentration had a negative effect on CO2 yield with a non significant effect of pressure.
Table 6 shows the positive effect of temperature and
residence time alone, which is in favor of the water gas-shift reaction producing CO2 as a secondary gas [20], while their interaction has a strong negative effect with p and t-value s of 0.031 and "20.39, respectively.
(a)
(b)
Guo et al. [24] showed an increase in CO2 yields with temperatures above 650!C during the hydrothermal gasifi-cation of glycerol and explained it by a strong water gas-shift activity.
Figure 3(a) illustrates the slight effect of pressure and catalyst amount on carbon dioxide production and outlines the strong positive effect of temperature and the negative one for the initial concentration. On the other side,Figure 3(b)shows that the most important interaction effect was between the temperature and the residence time, similarly to hydrogen production.
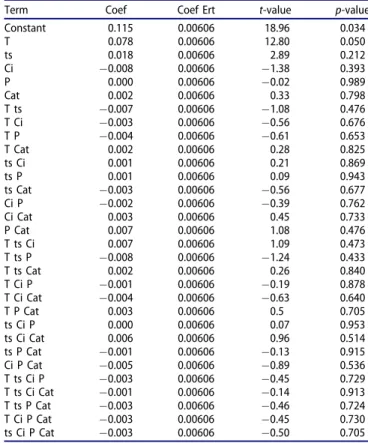
Carbon monoxide production
The mathematical model that describes the production of CO was developed with a correlation factor R2 of 0.984. Statistically and according to Table 7, no parameter did have a significant effect on the yield of CO produced by supercritical gasification of glycerol under the studied oper-ating conditions domain, with all the p-values of main fac-tors and their interactions greater than 0.05. Statistically no parameter had a significant effect, since the production of carbon monoxide was very low.
Experimentally, the effects of temperature, residence time and the presence of catalyst were slightly negative on CO production, as shown inFigure 4(a), and are considered the most influential factors. These parameters favored water gas-shift and methanation reactions, where CO was better and faster consumed. Changes in pressure led to a positive effect and a two-fold increase of CO level with an increase of 4 MPa (experiments 1 and 9). Under supercritical conditions, high pressure was in favor of the hydrolysis and water gas-shift reaction, but inhibited the pyrolysis reaction [26]. The initial concentration had a positive effect on the production of CO which increased by almost a factor of 2
with 9 wt% increase in glycerol. S.GUO et al. [27] found that the gases were issued mainly from two types of reac-tions, a pyrolysis and a steam reforming of glycerol and intermediate products. The steam reforming reaction could be very sensitive to the concentration of water as a reagent and where a higher concentration of glycerol could lead to water acting as the limiting reagent, while the pyr-olysis reaction might be insensitive to the concentration of water.
Graphically, Figure.4(b) shows a significant effect of the interactions: T-ts, T-Cat and ts-Cat, but statistically the effect is insignificant (Table 7) because the CO yield was very low as shown on the y-axis.
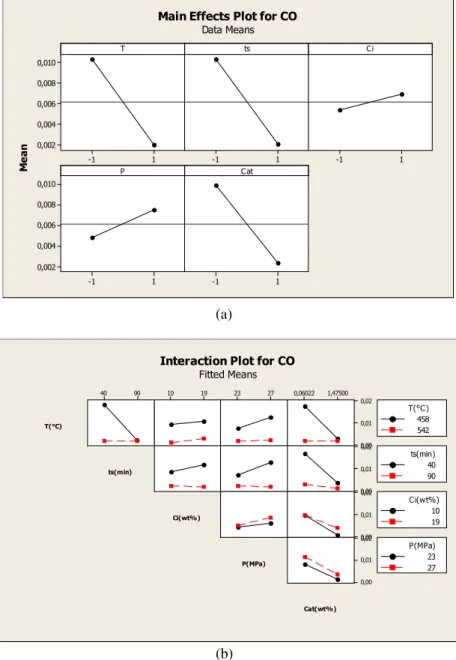
Methane production
The correlation factor R2 of the production of methane is equal to 0.9946 and as shown inTable 8, temperature was the only significant effect with p-value of 0.05.
Figure 5(a) shows the effect of the various parameters
on the production of methane, the temperature influenced more positively the methane production than the residence time, favoring the reaction of methanation. Both water gas-shift reactions and methanation could be considered as competitive reactions, and that at high temperatures and long residence time methanation was better promoted. The initial concentration and had a small negative effect on the production of methane. On the other side, the cata-lysts had a small positive effect, whereas the pressure had no effect on the methane production. The produced hydro-carbons were C2H4, C2H6, C3H8 and C4H10. They were pre-sent in very small quantities and the factors had almost similar effects to those on methane production, confirming the results found by GUO et al. [27]. Slight variations of the Table 7. Regression coefficients and signification tests for CO production.
Term Coef Coef Ert t-value p-value Constant 0.006 0.001346 4.55 0.138 T "0.004 0.001346 "3.09 0.200 ts "0.004 0.001346 "3.05 0.201 Ci 0.001 0.001346 0.58 0.667 P 0.001 0.001346 1.01 0.497 Cat "0.004 0.001346 "2.80 0.218 T ts 0.004 0.001346 3.07 0.201 T Ci 0.000 0.001346 "0.01 0.993 T P "0.001 0.001346 "0.89 0.536 T Cat 0.004 0.001346 2.79 0.219 ts Ci "0.001 0.001346 "0.63 0.641 ts P "0.002 0.001346 "1.18 0.448 ts Cat 0.003 0.001346 2.21 0.271 Ci P 0.000 0.001346 0.35 0.784 Ci Cat 0.001 0.001346 0.55 0.681 P Cat 0.000 0.001346 "0.22 0.860 T ts Ci 0.001 0.001346 0.53 0.692 T ts P 0.002 0.001346 1.24 0.432 T ts Cat "0.003 0.001346 "2.45 0.247 T Ci P 0.000 0.001346 "0.31 0.809 T Ci Cat "0.001 0.001346 "0.42 0.749 T P Cat 0.000 0.001346 0.11 0.931 ts Ci P 0.000 0.001346 0.3 0.817 ts Ci Cat 0.000 0.001346 "0.11 0.932 ts P Cat 0.001 0.001346 0.45 0.731 Ci P Cat 0.001 0.001346 0.45 0.732 T ts Ci P 0.000 0.001346 "0.25 0.844 T ts Ci Cat 0.000 0.001346 0.1 0.935 T ts P Cat "0.001 0.001346 "0.59 0.661 T Ci P Cat "0.001 0.001346 "0.53 0.688 ts Ci P Cat "0.001 0.001346 "1 0.500
Table 8. Regression coefficients and signification tests for CH4production.
Term Coef Coef Ert t-value p-value Constant 0.115 0.00606 18.96 0.034 T 0.078 0.00606 12.80 0.050 ts 0.018 0.00606 2.89 0.212 Ci "0.008 0.00606 "1.38 0.393 P 0.000 0.00606 "0.02 0.989 Cat 0.002 0.00606 0.33 0.798 T ts "0.007 0.00606 "1.08 0.476 T Ci "0.003 0.00606 "0.56 0.676 T P "0.004 0.00606 "0.61 0.653 T Cat 0.002 0.00606 0.28 0.825 ts Ci 0.001 0.00606 0.21 0.869 ts P 0.001 0.00606 0.09 0.943 ts Cat "0.003 0.00606 "0.56 0.677 Ci P "0.002 0.00606 "0.39 0.762 Ci Cat 0.003 0.00606 0.45 0.733 P Cat 0.007 0.00606 1.08 0.476 T ts Ci 0.007 0.00606 1.09 0.473 T ts P "0.008 0.00606 "1.24 0.433 T ts Cat 0.002 0.00606 0.26 0.840 T Ci P "0.001 0.00606 "0.19 0.878 T Ci Cat "0.004 0.00606 "0.63 0.640 T P Cat 0.003 0.00606 0.5 0.705 ts Ci P 0.000 0.00606 0.07 0.953 ts Ci Cat 0.006 0.00606 0.96 0.514 ts P Cat "0.001 0.00606 "0.13 0.915 Ci P Cat "0.005 0.00606 "0.89 0.536 T ts Ci P "0.003 0.00606 "0.45 0.729 T ts Ci Cat "0.001 0.00606 "0.14 0.913 T ts P Cat "0.003 0.00606 "0.46 0.724 T Ci P Cat "0.003 0.00606 "0.45 0.730 ts Ci P Cat "0.003 0.00606 "0.50 0.705
temperature and the residence time with increasing the concentration, led to increased molar fractions of CH4 and C2Hx.
As shown onFigure 5(b), no interaction presented a sig-nificant effect.
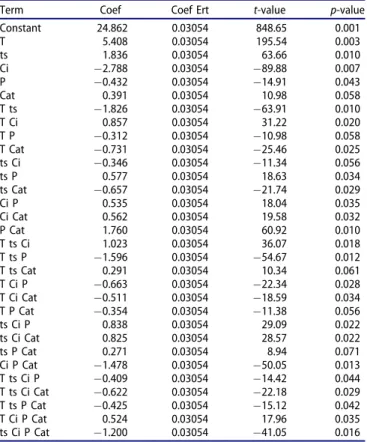
Gasification efficiency
The mathematical model which describes the efficiency of gasification as a function of the operating parameters has a correlation factor R2 of 0.9883. As can be seen from
Table 9all the main factors are significant with p-value less than 0.05, except the catalyst with a p-value of 0.058 which is very close to a condition of significance. The results show that contrary to the other studied responses, several factors interactions, with level two, three and four factors, are considered statistically significant for the gasification efficiency (see Table 9 and Figure 6(b)). For the binary interactions T-ts, T-Ci, T-Cat, ts-P, ts-Cat, Ci-Cat, P-Cat and Ci-P, it was found that the interaction between
temperature and residence time had the highest t-value of "63.9. For the ternary interactions ts-Ci, ts-P, Ci-P, T-Ci-Cat, ts-Ci-P, ts-Ci-Cat and Ci-P-Cat, it was found for this case that the interaction between temperature, residence time and pressure had the most important effect with a t-value of "54.67. The quaternary interactions that had no effects for all the studied responses, had showed significant effects on gasification efficiency and were: P, T-ts-Ci-Cat, T-ts-P-T-ts-Ci-Cat, T-Ci-P-Cat and ts-Ci-P-Cat with a t-value of "41.05 for the interaction between residence time, initial concentration, pressure and catalyst.
According to Figure 6(a) and Table 9, initial concentra-tion and pressure had negative effects but all other factors had positive ones. The temperature and the residence time had positive effects on the gasification efficiency, with the former having the most positive influence. The increase in the gasification efficiency was mainly due to the high rate of gas production, to the various intermediate reactions (steam reforming, water gas shift and methanation) that were favored by these parameters. The initial concentration (a)
(b)
of glycerol had a more negative effect on the gasifica-tion efficiency compared to the pressure. These results were in agreement with other studies like the one reported in [26].
Low calorific value
The model had a correlation factor R2 of 0.9976. As shown in Table 10 and Figure 7(a), statistically, the temperature was the only factor with the most significant and important positive effect (p-value ¼ 0.034 and t-value ¼ 18.65).
Residence time had also a positive effect but lesser than that of temperature while initial concentration had a slightly negative effect as shown in Figure 7(a). It is also shown that catalyst and pressure had negli-gible effects.
The important effect of temperature on the low calorific value of the obtained gas, had also been outlined by the work of Nanda et al. [28] in their study of a gasification of wheat straw, where their results showed about sevenfold increase of the LCV when the temperature passed from 300!C to 550!C. The present work results show an increase
of LCV of the produced syngas from 59.184 to 549.184 kJ/ mol corresponding to the operating conditions of Experiment 4 (the maxima of temperature and residence time) and Experiment 13 (the minima of temperature and residence time) respectively (see Table 4). FromFigure 7(b), it is shown that the interaction T-ts was the only import-ant one.
According to Equation (3), the lower calorific value is a function of the quantities of produced hydrocarbons gases and it indicates the content of combustible gases in the obtained gaseous mixture. Figure 8shows the composition of the gaseous phase in terms of the energy capacity of the gas produced. From the experimental point of view, the results show that a high temperature favored the pro-duction of hydrocarbon-rich energy gas, whereas the heat-ing values of methane and propane had shown a thirteen and fivefold increase, respectively, compared to the twofold power increase for hydrogen (Experiments 1 and 2). The maximum global LCV was identified in Experiment 4, where the temperature and residence time were increased at the same time, hence the positive effect of the interaction of the two parameters. The overall LCV decreased slightly (a)
(b)
with the increase in the initial glycerol concentration, the composition of the gaseous mixture changed and the car-bon monoxide increased along with some light hydrocar-bons (C2H6, C4H10and C3H8). The overall calorific value and minimum hydrogen were obtained with increasing initial glycerol concentration and pressure simultaneously (Experiment 13). The presence of catalyst increased the overall calorific value of the gaseous mixture with a signifi-cant increase in the calorific value provided by the hydro-gen, which showed the selectivity of the catalyst (KOH) for the production of hydrogen.
Studied factors classification
The previous sections have shown that the studied operat-ing parameters had not the same effect on the DOE responses. To outline the effects of the factors and their interactions on a target response, the Pareto graph was used and it is a vertical bar graph in which values are plot-ted in decreasing order of relative frequency from left to right. Indeed, Pareto chart is useful for analyzing which var-iables have the greatest effect on a given response and allows taking a decision according to the objective of the study. Also, it can classify all the factors and their interac-tions and shows the significant ones using the critical t-value (12.71 for the obtained models) where the factors with absolute t_value greater than this critical one are con-sidered as significant.
Figures 9 and 10 shows an example of Pareto chart
generated by Minitab to represent the factors classifica-tion for hydrogen producclassifica-tion and gasificaclassifica-tion efficiency as study objectives.
As can be seen from these results, a non significant fac-tor for a given response may be significant for another
one. Also, the factors effects do not have the same impact on the studied responses. For instance the pres-sure effect was not significant on the H2 production but was significant on gasification efficiency. Furthermore, it was clearly shown that the temperature was the most significant factor affecting the GE followed by the initial concentration, contrary to the H2 production where the effects of these two factors were non significant. As mentioned above, several binary interactions and even ternary and quaternary interactions which are not usually considered, had showed a significant effect. The analysis of the obtained results justified the consideration of all factors and responses and the selection of operating conditions to be applied depends on the main objective for using supercritical gasification.
Comparison with previous results
A comparison of supercritical gasification of glycerol with the work of Wu et al. [29] was performed under the same conditions of initial concentration of glycerol, temperature, pressure and residence time (5 wt%, 500!C, 25 MPa and 60 min, respectively) in a batch reactor. However their work was carried out in absence of catalyst and for a comparison purpose only, an experiment under the same conditions was carried out following the same protocol.
Table 11 shows that the obtained gases production
yields are very close to those reported by Wu et al. [29]. In both works, the produced syngas was rich in CO2and with no traces of butane, due to the very small amount pro-duced that could not be detected by the ana-lysis apparatus.
A comparison between gas production from supercritical gasification of glycerol and other biomasses in the same conditions was also performed. Table 12 compares the Table 9. Regression coefficients and signification tests for
gasifica-tion efficiency.
Term Coef Coef Ert t-value p-value Constant 24.862 0.03054 848.65 0.001 T 5.408 0.03054 195.54 0.003 ts 1.836 0.03054 63.66 0.010 Ci "2.788 0.03054 "89.88 0.007 P "0.432 0.03054 "14.91 0.043 Cat 0.391 0.03054 10.98 0.058 T ts "1.826 0.03054 "63.91 0.010 T Ci 0.857 0.03054 31.22 0.020 T P "0.312 0.03054 "10.98 0.058 T Cat "0.731 0.03054 "25.46 0.025 ts Ci "0.346 0.03054 "11.34 0.056 ts P 0.577 0.03054 18.63 0.034 ts Cat "0.657 0.03054 "21.74 0.029 Ci P 0.535 0.03054 18.04 0.035 Ci Cat 0.562 0.03054 19.58 0.032 P Cat 1.760 0.03054 60.92 0.010 T ts Ci 1.023 0.03054 36.07 0.018 T ts P "1.596 0.03054 "54.67 0.012 T ts Cat 0.291 0.03054 10.34 0.061 T Ci P "0.663 0.03054 "22.34 0.028 T Ci Cat "0.511 0.03054 "18.59 0.034 T P Cat "0.354 0.03054 "11.38 0.056 ts Ci P 0.838 0.03054 29.09 0.022 ts Ci Cat 0.825 0.03054 28.57 0.022 ts P Cat 0.271 0.03054 8.94 0.071 Ci P Cat "1.478 0.03054 "50.05 0.013 T ts Ci P "0.409 0.03054 "14.42 0.044 T ts Ci Cat "0.622 0.03054 "22.18 0.029 T ts P Cat "0.425 0.03054 "15.12 0.042 T Ci P Cat 0.524 0.03054 17.96 0.035 ts Ci P Cat "1.200 0.03054 "41.05 0.016
Table 10. Regression coefficients and signification tests for LCV.
Term Coef Coef Ert t-value p-value Constant 315.28 7.553 41.74 0.015 T 140.83 7.553 18.65 0.034 ts 31.57 7.553 4.18 0.149 Ci "28.06 7.553 "3.72 0.167 P "3.18 7.553 "0.42 0.746 Cat 6.79 7.553 0.90 0.534 T ts "24.25 7.553 "3.21 0.192 T Ci 3.82 7.553 0.51 0.702 T P "4.97 7.553 "0.66 0.630 T Cat "3.89 7.553 "0.52 0.697 ts Ci 0.50 7.553 0.07 0.958 ts P 3.73 7.553 0.49 0.708 ts Cat "7.47 7.553 "0.99 0.504 Ci P "0.55 7.553 "0.07 0.953 Ci Cat 4.33 7.553 0.57 0.669 P Cat 20.17 7.553 2.67 0.228 T ts Ci 15.61 7.553 2.07 0.287 T ts P "19.64 7.553 "2.60 0.234 T ts Cat 1.08 7.553 0.14 0.909 T Ci P "3.70 7.553 "0.49 0.710 T Ci Cat "7.96 7.553 "1.05 0.483 T P Cat 2.23 7.553 0.30 0.817 ts Ci P 6.22 7.553 0.82 0.561 ts Ci Cat 13.86 7.553 1.84 0.318 ts P Cat 0.43 7.553 0.06 0.963 Ci P Cat "13.51 7.553 "1.79 0.324 T ts Ci P "4.98 7.553 "0.66 0.629 T ts Ci Cat "6.92 7.553 "0.92 0.528 T ts P Cat "5.66 7.553 "0.75 0.590 T Ci P Cat "0.80 7.553 "0.11 0.933 ts Ci P Cat "10.72 7.553 "1.42 0.391
obtained results of supercritical gasification of glycerol at 500!C with those of Cherad et al. [10] at the same tem-perature, 25 MPa and a residence time of 30 min. They used an initial concentration of 6.66 wt% of Laminaria Hyperbora. It is clear that the yields of CH4, CO, and CO2 productions, reported in [10] were much higher than those given by the SCWG of glycerol. However the quantities of hydrogen were very close and L. Hyperbora allowed a greater production due to its composition containing nitro-gen and sulfur which acted as a catalyst during the pro-cess [10].
Table 12 shows also the comparison of glycerol
super-critical gasification with that of sugarcane bagasse studied by sheikhdavoodi et al. [31]. The operating conditions of the study were: 500!C, 25 MPa, 9 w% of initial concentra-tion of biomass and 15 min as a residence time. As shown in Table 12, sugarcane bagasse produced the most H2-rich syngas and CO2 and CO yields were most important than those produced by glycerol at the same conditions.
Finally, a comparison between glycerol supercritical gas-ification in batch and tubular reactor was also performed. The results of the work of Guo et al. [27] in a tubular
reactor are reported in Table 13 and show that the yields of CH4, CO2 and CO are much higher in tubular reactor in only 10 s than in batch reactor in 60 min, for the same con-ditions of temperature, pressure and initial concentration of glycerol with an important production of H2. This is explained by the fact that the chemical equilibrium is more quickly reached in a tubular reactor [30].
Conclusion
Supercritical water gasification of glycerol led mainly to syngas such as hydrogen, methane, monoxide and carbon dioxide. The first order mathematical models describing all responses were obtained with satisfactory correlation fac-tors, through an experimental study based on an experi-mental design using MINITAB 16. This study also showed the effect of different parameters on each gas produced. Temperature was the main factor that had the most posi-tive effect on all responses except on carbon monoxide. In the other side, the initial concentration influenced posi-tively the CO yield and negaposi-tively the remaining responses. The temperature, the residence time and the presence of (a)
(b)
potassium hydroxide (KOH) as alkali catalyst favored the water gas-shift reaction; hence these factors acted posi-tively on the production of recoverable gases. The pressure had almost no significant effect on all the responses studied except the gasification efficiency. The comparison of the results obtained from this work with previous ones has shown that a greater gas production was obtained in a tubular reactor. The maximum gas produced was identified
in Experiment 26, for an initial glycerol concentration of 1.475 wt%, a temperature of 542!C, a residence time of 40 min, a concentration of catalyst of 10 wt% and a pres-sure of 27 MPa.
This study showed the effect of the operating parame-ters and their interactions on the quantity and quality of the produced gas from hydrothermal gasification of gly-cerol over the chosen intervals of operating conditions. The (a)
(b)
Figure 7. Effect of the operating parameters on the low calorific value (a) main effects plot, (b) interaction plot.
classification of effects significance of the five studied fac-tors and their interactions according to the fixed objective was performed.
On the basis of the promising results presented in this paper, an optimization study of the operating parameters for different optimization objectives over larger intervals
using quadratic mathematical models and also the use of other types of catalysts will be presented in the future.
Acknowledgements
The authors would like to thank the RAPSODEE center of Mines Albi institute for providing facilities for the concretization of the experi-mental part of the present work.
Disclosure statement
No potential conflict of interest was reported by the authors.
References
[1] Herv!e B, Mathis P. La biomasse, !energie d’avenir? Editions Quae. France; 2013.
[2] Sriram N, Shahidehpour M. Renewable biomass energy. Chicago (IL): Electric Power and Power Electronics Center, Illinois Institute of Technology. IEEE. 2005.
Figure 9. Pareto chart of the standardized effects for hydrogen production.
Figure 10. Pareto chart of the standardized effects for gasification efficiency.
Table 11. Gas yields (mol of gas/mol of glycerol) from SCWG of 5 wt% of glyceol without catalyst (500!C, 25 MPa, 60 min).
This work From [29]
H2 0.51 0.56 CO2 0.65 0.72 CO 0.19 0.12 CH4 0.20 0.17 C2H4 0.008 0.02 C2H6 0.061 0.07 C3H8 0.054 0.05
Table 12.Comparison of syngas produced (mol of gas/kg of biomass) by supercritical gasification of glycerol, Laminaria Hyperbora and suggar-cane baggase).
This worka
(glycerol) From [10]
a
(Laminaria Hyperbora) This Work
b (Glycerol) From [30] b (Sugarcane bagase) H2 5.68 5.18 4.62 6.60 CO2 6.26 13 5.21 10 CO 1.21 4 1.11 2 CH4 0.61 2 – –
a6,66 wt% concentration of biomass, 500!C, 25 MPa and 30 min. b9 wt% concentration of biomass, 500!C, 25 MPa and 15 min.
Table 13. Gas yields (mol of gas/mol of glycerol) from SCWG of 5 wt% of glycerol at 500!C and 25 MPa in batch and tubular reactor in 60 min and
10 s respectively.
This work From [30]
H2 0.51 2.59
CO2 0.65 0.93
CO 0.19 0.96
[3] Pacheco de Resende FL. Supercritical water gasification of bio-mass. The University of Michigan; 2009. Available from:https:// deepblue.lib.umich.edu/bitstream/handle/2027.42/62405/feluis_ 1.pdf?sequence=1
[4] Lioret C. FERMENTATIONS. Encyclopaedia Universalis [online]. Available from:http://www.universalis.fr/encyclopedie/fermentations/
[5] Craig LC. Biomass energy a glossary of terms. Western Regional BIOMASS Energy Program. Reprinted with permission of: U.S. Government Interagency Program, Principal Funding: Department of Energy. Program Management: Bonneville Power Administration; USA. 1998.
[6] Bassil Georgio M. Gaz!eification de la biomasse: !elimination des goudrons par lavage, !etude exp!erimentale et mod!elisation [Biomass gasification: tarring by washing, experimental and modeling study]. Alimentation et Nutrition. Villeurbanne: Universit!e Claude Bernard - Lyon I; 2012. French.
[7] Boukis N, Diem V, Habicht W, et al. Methanol reforming in supercritical water. Ind Eng Chem Res. 2003;42(4):728–735. [8] Loppinet-Serani A, Aymonier C, Cansell F. Current and
foresee-able applications of supercritical water for energy and the environment. ChemSusChem. 2008;1(6):486–503.
[9] Ruiz JC, Boutin O. Gazeification de biomasse en eau supercri-tique [Biomass gasification in supercritical water]. Saint Denis: Ed. Techniques de l’ingenieur; 2013. French.
[10] Cherad R, Onwudili JA, Williams PT, et al. A parametric study on supercritical water gasification of Laminaria hyperborea: a carbohydrate-rich macroalga. Bioresour Technol. 2014;169: 573–580.
[11] Xia F, Tian S, Ning P, et al. Catalytic gasification of lignite with KOH in supercritical water. Can J Chem Eng. 2013;92:421–425. [12] Ding N, Azargohar R, Dalai AK, et al. Catalytic gasification of
cellulose and pinewood to H2in supercriticalwater. Fuel. 2014;
118:416–425.
[13] Qadariyah L, Machmudah, S, Sasaki, M, et al. Degradation of glycerol using hydrothermal process. Bioresour Technol. 2011; 102:9267–9271.
[14] DI Costanzo G. GLYC!ERINE (glyc!erol). Encyclopaedia Universalis [online]. Available from:http://www.universalis.fr/encyclopedie/ glycerine/
[15] Cahn A. 5th world conference on detergents: reinventing the industry: opportunities and challenges. American Oil Chemists; New York. 2003, p. 182.
[16] Benmakhlouf N, Outili N, Meniai AH. Modeling and optimiza-tion of phenol hydrothermal oxidaoptimiza-tion in supercritical water. Int J Hydrogen Energy. 2017;42(17):12926–12932.
[17] Thomas P-F. Pr!ecis de Physique-chimie: cours et exercices. Edition Br!eal; Paris. 2006.
[18] Wu M. Etude de proc!ed!es de conversion de biomasse en eau supercritique pour l’obtention d’hydrog"ene. Application au glu-cose, glyc!erol et bio-glyc!erol [Study of process of conversion of biomass to supercritical water to obtain hydrogen. Application to glucose, glycerol and bio-glycerol]. Toulouse: Universit!e de Toulouse, Unit!e de Recherche RAPSODEE; 2012. French. [19] Roy-Auberger M, Marion P, Boudet N. Gaz!eification du charbon
[Coal gasification]. Saint Denis: Ed. Techniques de l’Ing!enieur, R!ef: J5200 v1; 2009. French.
[20] Laras B-I, Dianningrum SW, Choi H, Kim Y, et al. Hydrothermal gasification of pure and crude glycerol in supercritical water: a comparative study. Int. J. Hydrogen Energy. 2014;39(3): 1262–1273.
[21] Sınaǧ A, Kruse, A, Schwarzkopf, V. Key compounds of the hydropyrolysis of glucose in supercritical water in the presence of K2CO3. Ind Eng Chem Res. 2003;42:3516–3521.
[22] Chuntanapum A, Matsumura Y. Char formation mechanism in supercritical water gasification: a study of model compounds. Ind Eng Chem Res. 2010;49(9):4055–4062.
[23] Kruse A, Meier D, Rimbrecht P, et al. Gasification of pyrocate-chol in supercritical water in the presence of potassium hydrox-ide. Ind Eng Chem Res. 2000;39(12):4842–4848.
[24] Guo LJ, Lu YJ, Zhang XM, et al. Hydrogen production by bio-mass gasification in supercritical water: a systematic experimen-tal and analytical study. Caexperimen-tal Today. 2007;129:275–286. [25] Gadhe JB, Gupta RB. Hydrogen production by methanol
reforming in supercritical water: suppression of methane forma-tion. Ind Eng Chem Res. 2005;44(13):4577–4585.
[26] Akiya N, Savage PE. Roles of water for chemical reactions in high-temperature water. Chem Rev. 2002;102(8):2725–2750. [27] Guo S, Guo L, Cao C, et al. Hydrogen production from glycerol
by supercritical water gasification in a continuous flow tubular reactor. Int J Hydrogen Energy. 2012;37(7):5559–5568.
[28] Nanda S, Reddy SN, Vo D-VN, et al. Catalytic gasification of wheat straw in hot compressed (subcritical and supercritical) water for hydrogen production. Energy Sci Eng. 2018;6(5): 448–459.
[29] Wu Q, Bulza S, Corcoveanu C, et al. Supercritical water conver-sion of glycerol: comparative parametric study between batch and continuous process. Available from:https://www.isasf.net/ fileadmin/files/Docs/DenHaag/HtmlDir/Papers/CO42.pdf
[30] Sheikhdavoodi MJ, Almassi M, Ebrahimi-Nik M, et al. Gasification of sugarcane bagasse in supercritical water; evalu-ation of alkali catalysts for maximum hydrogen production. J Inst Energy. 2015;88(4):450–458.
[31] Houcinat I, Outili N, Meniai AH. Optimization of gas production and efficiency of supercritical glycerol gasification using response surface methodology. Biofuels. 2018;9(5):625–633.

![Table 6 shows the positive effect of temperature and residence time alone, which is in favor of the water gas-shift reaction producing CO 2 as a secondary gas [20], while their interaction has a strong negative effect with p and t-value s of 0.031 and &#](https://thumb-eu.123doks.com/thumbv2/123doknet/12177081.314094/7.892.218.672.82.741/positive-temperature-residence-reaction-producing-secondary-interaction-negative.webp)