EMPLOYEE OWNERSHIP, BOARD REPRESENTATION, AND
CORPORATE FINANCIAL POLICIES
Abstract
French law mandates that employees of large publicly listed companies be allowed to elect two types of directors to represent employees. First, partially privatized companies must reserve two or three (depending on board size) board seats for directors elected by employees by right of employment. Second, employee-shareholders in any public company have the right to elect one director whenever they hold at least 3% of outstanding shares. These two rights have engendered substantial employee representation on the boards of over one-quarter of the largest French companies. Using a comprehensive sample of firms in the Société des Bourses Françaises (SBF) 120 Index from 1998 to 2005, we examine the impact of employee-directors on corporate valuation, payout policy, and internal board organization and performance. We find that directors elected by employee shareholders unambiguously increase firm valuation and profitability, but do not significantly impact corporate payout (dividends and share repurchases) policy or board organization and performance. Directors elected by employees by right significantly reduce payout ratios, increase overall staff costs, and increase board size, complexity, and meeting frequency—but do not significantly impact firm value or profitability. Employee representation on corporate boards thus appears to be at least value-neutral, and even value-enhancing in the case of directors elected by employee shareholders.
JEL Classification: G32, G35, G38, J54, J83
Keywords: Employee Ownership, Payout Policy, Privatization, Corporate Boards January 10, 2009
Employee Ownership, Board Representation, and Corporate Financial Policies
1. Introduction
Should employees be allocated control rights in the companies for which they work? This question has long been debated, but has picked up impetus recently as societies have struggled to balance worker rights with effective corporate governance. While the collapse of communism has removed the most extreme examples of (at least theoretical) employee ownership, Germany and other countries mandate that workers be represented on corporate boards, and most western democracies encourage employee share ownership through tax, compensation, and pension policies. However, it is still unclear whether employee ownership or representation on the corporate board of directors increases firm value or productivity. This study exploits a natural experiment in mandated employee representation conducted in France--a major western country with both a market economy and a long tradition of robust worker employment protection—to determine whether giving workers control rights without cost creates value, and whether directors elected by employees who are also shareholders have a differential impact on firm value than do directors elected by workers as a right of employment.
French law mandates that employees of large publicly listed companies be allowed to elect directors for two reasons. First, partially privatized companies must reserve two or three (depending on board size) board seats for directors elected by employees by right of employment. Since privatized firms are easily the largest and most valuable companies in France, this requirement induces significant representation on the boards of an important and highly visible group of companies by directors elected by workers who are not also shareholders. Second, employee-shareholders in any publicly listed firm have the legal right to elect one director whenever they hold at least 3% of outstanding shares. This theoretical right has, however, never been strenuously enforced, so companies effectively are encouraged but not required to allow employee-shareholders to elect one or more directors. Additionally, French law allows but does not mandate that listed firms may adopt a two-tiered supervisory and management board structure, as per the German model, and may also choose to combine the posts of CEO and Chairman of the Board of Directors—as is typical for American companies--or to keep these positions separate, as is the model in most other developed economies. Taken together, these regulations and governance options have engendered employee representation on the boards of over one-quarter of the largest French companies, but have also created significant cross-sectional variation in the extent and type of employee board representation, in the use of single-versus-two-tiered boards, and in the combined-versus-separate CEO and board chair positions. This provides a unique institutional setting for empirical analysis.
Using a comprehensive sample of firms in the Société des Bourses Françaises (SBF) 120 Index from 1998 to 2005, we study the financial impact of the two types of employee representation. Specifically, we examine how these choices influence corporate valuation, payout policy, and internal board organization and performance. We find that directors elected by employee shareholders unambiguously increase firm valuation and profitability, but do not significantly impact corporate payout (dividends and share repurchases) policy or board organization and performance. Directors elected by employees by right significantly reduce payout ratios, increase overall staff costs, and increase board size, complexity, and meeting frequency—but do not significantly impact firm value or profitability. Our robustness checks also indicate that when the firm’s employees are represented by the most radical left-wing unions (CGT, FO, CFDT, CFTC, or CFE-CGC) payout is significantly reduced, but the impact on corporate valuation is unaffected and profitability is significantly increased, probably due to a more structured and demanding work environment when these unions are involved in corporate governance and industrial relations. On balance, employee representation on corporate boards seems to be at least value-neutral, and may actually increase firm valuation and profitability when employee-shareholders elect company directors.
This paper is organized as follows. Section 2 surveys the literature on employee ownership and corporate board representation, while section 3 describes the French institutional background and the laws mandating different types of employee representation. Section 4 describes our sample and presents univariate analyses of the impact of the two types of employee board representation on corporate valuation, financial policies, and internal board organization and performance. Section 5 presents regression analyses of these effects, while section 6 presents robustness checks, adjusts for endogeneity, and discusses the implications of the study’s key findings. Section 7 concludes.
2. Literature review
Several streams of theoretical and empirical literature inform our study. There is a general literature on organization and optimal control of corporations that draws principally on the work of Alchian and Demsetz (1972) and Jensen and Meckling (1976). Alchian and Demsetz show that, when there is perfect information, control rights should optimally be entrusted in one agent, the firm’s owner. Jensen and Meckling show that agency problems arise whenever there is a separation of ownership and control and that institutional arrangements arise to ameliorate these costs. These seminal articles laid the foundations for the modern theory of corporate governance in public companies, as developed by Fama (1980), Jensen and Ruback (1983), Fama and Jensen (1983a, b), Jensen (1986), Stulz (1988), and others.
This literature was summarized generally in Shleifer and Vishny (1997) and in the international context in Denis and McConnell (2003).
There is also a substantial stream of research examining the specific issue of labor managed firms and the German Codetermination policy that mandates substantial worker representation (reserving between one-third and one-half of board seats) on the boards of publicly listed companies. The most influential—and decidedly hostile--early analysis of labor managed firms and codetermination was presented in Jensen and Meckling (1979), who described the organizational, contracting, and commitment problems they predict must naturally arise when labor is made the owner/manager of corporate assets. These authors also make the simple but devastatingly insightful observation that the best evidence against the viability of labor managed and codetermined firms is that these are never observed except where mandated by law—and even where mandated Jensen and Meckling assert that corporations expend great time and energy trying to escape the strictures imposed by this format.
More recently, however, several researchers have suggested that employee participation in firm governance can be value-enhancing, at least under certain conditions. Allen, Carletti, and Marquez (2007) predict that stakeholder-oriented firms, that are concerned with employees and suppliers in addition to shareholders, will often prosper in competition with purely shareholder-oriented firms, and Claessens and Ueda (2008) present empirical evidence supporting this prediction. Galai and Weiner (2008) make a similar prediction regarding the optimal allocation of board representation for companies confronting economic or financial distress. Acharya, Myers, and Rajan (2008) point to the critical monitoring role that highly productive, but non-executive employees can play in constraining any self-serving actions by senior managers, even in the absence of external governance. Finally, Raheja (2005), Coles, Daniel, and Naveen (2008), and Gillette, Noe, and Rebello (2008) all predict that insider-dominated boards may have some competitive advantages over boards consisting principally of disinterested outsiders.
The German system of codetermination is analyzed theoretically and empirically in several studies. As described in Fauver and Fuerst (2006), the system of Mitbestimmungrecht (right of codetermination) began in 1951 for mining, coal, and steel companies, and was extended to all firms with more than 2000 workers in 1976. This policy requires that workers receive one-half of all seats on the supervisory board (Aufsichgtrat) of German Aktiengesellschaft (AG), or publicly traded companies. A separate law mandates that workers receive one-third of board seats in companies with between 500 and 2000 workers, and various supplemental regulations have narrowed the scope for German companies to escape these codetermination strictures.
Fauver and Fuerst (2006) also present the most compelling empirical study supporting the proposition that codetermination may actually create value by conferring first-hand operational knowledge to corporate decision-making. Using a comprehensive sample of listed German companies in
2003, they document that 51% have employee representation. While the median level of representation is one-third of board seats, over one-third of companies with representation show higher levels than legally required. Fauver and Fuerst show that firms with employee representation are consistently larger, more profitable and more likely to pay dividends than are companies without worker representation. They also find that Tobin’s Q is significantly higher for firms with greater employee representation in industries that demand high levels of coordination—principally industries with complex supply chains.
Several other studies describe, and applaud, the workings of Germany’s codetermination system, including Furubotn and Wiggins (1984), Levine and Tyson (1990), Freeman and Lazear (1995), and Allen and Gale (2002). However, most empirical studies that explicitly analyze the German model reach conclusions similar to those foreshadowed by Jensen and Meckling (1979). As did Jensen and Meckling, Roe (1998) proposes that high levels of mandated employee representation will diminish supervisory board power and encourage shareholders and managers to circumvent employee-directors in decision-making. One way to do this is to construct concentrated ownership blocks held by founding families or banks, and many authors—including Roe (1998), Becht and Böehmer (1997), Franks and Mayer (2001), and Gorton and Schmid (2000)--confirm high levels of ownership concentration in Germany. Gorton and Schmid (2004) examine German companies with equal representation by employees and shareholders, and find that these companies trade at a 31% market discount compared to companies where employee representatives fill only one-third of the supervisory board seats. Interestingly, Fauver and Fuerst (2006) also find diminishing returns to employee representation over the level of one-third of board seats, though they conclude greater representation still creates value.
Several studies examine the impact of employee stock ownership and board representation in the United States, with generally inconclusive results. Most of this research studies the adoption of employee stock ownership plans (ESOPs) either using event study techniques or by employing accounting and stock return measures to test whether financial performance improves after plan adoption. Event study tests that document positive announcement period returns around ESOP adoption include Chang (1990), Faria, Trahan, and Rogers (1993), and Beatty (1995), while Gordon and Pound (1990) find insignificant announcement period returns. Studies examining the taxation and accounting implications of ESOP adoption include Chaplinsky and Niehaus (1990), Scholes and Wolfson (1990), Beatty (1995), and most recently, Kim and Ouimet (2008). Kim and Ouimet document that firms adopting small (less than 5% of outstanding shares) ESOPs experience a significant increase in firm value, but companies adopting larger plans do not. They show that employees in companies adopting large plans are able to capture all the benefits resulting from ESOP-induced productivity increases in the form of higher wages and benefits, whereas shareholders capture the productivity returns resulting from adoption of small plans.
The most comprehensive, and damning, analysis of the impact of labor voice on American public companies is provided by Faleye, Mehrotra, and Morck (2006). They compare the valuation and financial performance of a sample of 255 “labor voice firms,” in which employee ownership exceeds 5% (and labor representatives, rather than managers, vote the employee shares), to a control sample of companies with employee ownership of less than 5%. Compared to the control sample, labor voice firms have lower Tobin’s Q, invest less in long-term assets, take fewer risks, grow more slowly, create fewer new jobs, and exhibit lower labor and total factor productivity. They model labor’s contractual stream of wages as similar to risky debt in that it consists of a fixed claim on the firm—the promised stream of wages and benefits—less a put option with the exercise price equal to the value of labor’s claim in bankruptcy. Faleye, Mehrotra, and Morck posit that labor will maximize the combined value of the fixed claim and the put option, and will encourage policies contrary to shareholder wealth maximization.
A final related stream of research examines how managers might deliberately form coalitions with workers to protect the firm (and their own jobs) from a hostile takeover. Pagano and Volpin (2005) model this tendency of managers to enlist workers as allies, and Bertrand and Mullainathan (2003), Atanassov and Kim (2008), and Cronqvist, Heyman, Nilsson, Svaleryd, and Vlachos (2008) document a tendency for managers who are insulated from takeovers—through the influence, respectively, of U.S. state business combination laws and concentrated personal share ownership of Swedish managers—to pursue the “quiet life” by paying workers higher than necessary wages and by monitoring employees less intensively.
3. French law and employee representation on corporate boards
Though partly inspired by Germany’s codetermination model, the French employee representation system was launched three decades later and has evolved quite differently. The first such piece of legislation was the July 23, 1983 Law, passed by a left-wing government, that allowed worker representation on the board of directors of state-controlled companies (where the state owns more than 50% of the share capital). Depending on the total number of workers, employee-selected directors can represent up to one third of the members of the board. Three years later, the Ordonnance 21 Octobre 1986 allowed privately owned firms to change their statutes to have employees elected on the board.1 To
1
The ordonnance specifically states that “The number of these directors cannot be higher than five, nor exceed one third of the number of the other directors. When the number of the directors elected by the employees is equal or higher than two, the ‘engineers and managers’ have at least one seat.” The directors elected by the employees are not taken into account for the determination of the minimal number and the maximum number directors envisaged in article 89 – 3 and 18.
date, however, this option has never been adopted by any large publicly traded company that was not once state-owned.
The Law of July 25, 1994 mandated that the statutes of the company being privatized should be modified before sale to reserve a certain number of seats on the board of directors for the representatives of employees. The specific required reservations were: (1) two seats for the representatives of the labour force as a whole and one seat for the shareholder employees if the board of directors is made up of less than 15 members; and (2) three seats for the representatives of the labour force as a whole and one for the shareholder employees if the board of directors consists of more than 15 members. However, once the company was privatized, shareholders could again change the firm’s statutes to cancel the reserved seats for employee representatives on the board. This same law obliges companies, in which employees hold at least 5% of the capital, to submit to a vote of the general meeting a resolution giving one or more seats to directors representing employees (in addition to elected employees on the board), though the other shareholders could agree or disagree. The Law of February 19, 2001 reduces the previous threshold of 5% to 3%.
The Law of January 17, 2002 went further, mandating that an employee director had to be nominated when employee ownership exceeds 3%, not just that such a proposal had to be submitted for a vote at the general meeting. However, the companies whose board of directors already includes one or more directors who are members of the board of the employees’ mutual funds or one or more employees elected are not obliged to nominate another employee representative.
As we show later, this law truly seems to have promoted board representation for employee-shareholders, as the fraction of companies with such directors increases sharply after 2001. In many companies (such as Alcatel, Vivendi, and Total), it is the president of the employee mutual fund who sits on the board. On the other hand, this law did not by itself prompt universal compliance, as implementing decrees and regulations were not immediately passed—and indeed remain unspecified to this day. Several CEOs were reluctant to nominate new directors representing employee-shareholders, in particular in cases where employees were already represented on the board by director elected by employees as a right (in privatized companies). For example, shareholder-employees of Société Générale are not represented on the board, even though they hold 7% of the capital and 12.2% of the voting rights. This suggests that managers are generally unwilling to promote increased employee board representation unless compelled by law to do so, especially when there are already directors elected (by right) to represent workers.
Privately owned firms (those that were never state-owned) can choose to have elected employees as directors, but never do. These companies are supposed to nominate a shareholder employee if employee ownership is at least 3%, but few have done so since there is as yet no sanction for violating this mandate. Privatized firms sold before 1993 that are no longer state owned face requirements similar
to the ones that private companies face. Firms privatized after 1994 were obliged at the date of privatization to have 2 or 3 elected employees on the board, depending on the size of the board, plus one shareholder employee, but they could change their statutes whenever they wanted after being privatized.
Several privatized companies deleted one or both classes of employee representatives when they merged with other firms. As examples, employee directorships on the board of Elf Aquitaine were not taken onto the board of Total when these two companies merged. The same occurred when Pechiney was purchased by Alcan or when Aventis (including formerly state-owned Rhône Poulenc) was bought by Sanofi. In fact, almost half of all formerly state-owned companies dropped their employee representatives from their combined boards after merging.
Few companies explicitly voted to delete employee representation by non-shareholding employees in isolation (not as a result of merger or recapitalization). One company that did was Saint Gobain, which had two elected employees on the board until 1998. It proposed to the 1999 extraordinary general meeting (2/3 majority required) to cancel the requirement to have elected employees on the board. Shareholders agreed and from 1999 Saint-Gobain had no more employee-elected directors. The document submitted to vote explicitly said “ending the transitory period that began with privatization, we propose to…” Even with the deletions resulting from mergers and explicit votes, however, we will show that employee representation is far higher in formerly state-owned companies than in those that have always been private, and significantly higher in recently privatized companies than in those divested before 1994.
4. Data and univariate results
The sample of firms is drawn from the Société des Bourses Françaises (SBF) 120 Index and includes 156 unique firms covering 1,025 firm-years over the period 1998-2005. The SBF 120 Index regroups the 120 largest companies by market capitalisation and by trading volumes on Euronext Paris. Overall, 207 firm-year observations (20.20% of the sample) have employee directors on their boards. 126 firm-year observations (12.29% of the sample) have directors elected from among the employee-shareholders and 128 (12.49%) have directors elected by right by employees, so 47 firm-years (4.59%) have both types of employee representatives on their boards.
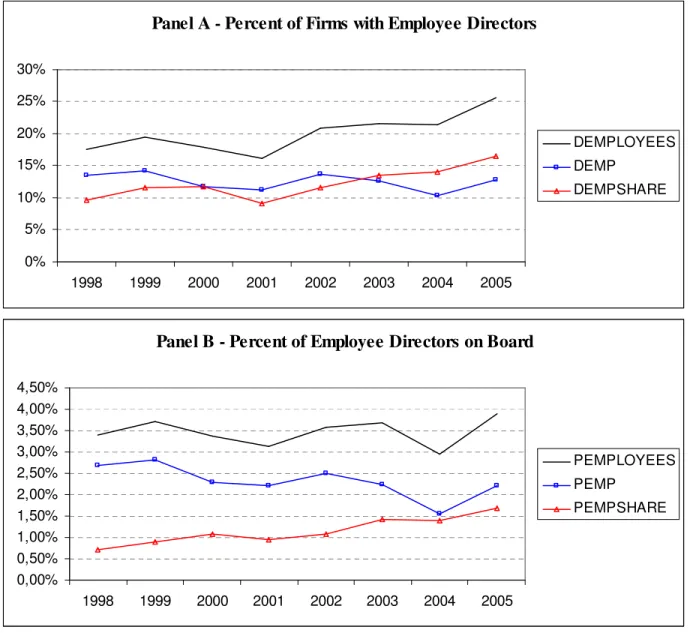
Figure 1 shows the time trend of the percent of SBF 120 firms with employee directors and the percent of employee directors on boards from 1998 to 2005. Panels A and B report that while the percent of directors elected by right by employees on corporate boards remains quite stable over the study period, there is a continuous increase in the fraction of firms with employee-shareholder directors and in the fraction of all board seats they command—and these trends accelerate after 2001. This observation reflects the emergence of better governance practices, such as the introduction of more women and
outside directors on corporate boards of directors, and the general promotion of employee ownership in companies. For example, Euronext and the Fédération Française des Associations d’Actionnaires Salariés et d’Anciens Salariés (FAS) launched the first employee shareholding index in the world in December 2006. This index is composed of all SBF 250 stocks having a significant percentage of employee shareholding—defined as at least 3% of the company’s stocks being owned by more than three-fourths of its employees.
**** Insert Figure 1 about here ***
The largest company with directors elected by right by employees is BNP Paribas (Banque Nationale de Paris); these directors accounted for 19% of its board in 2005. The largest company to have directors elected by employee-shareholders is the insurer AXA, which in 2005 had a board where such directors accounted for 8% of all seats. The company with the highest percentage of employee directors on its board is Air France, with a fraction of 41% in 2000. More accurately, the company which has the highest fraction of directors elected from among the employees on the board is Air France in 2000 with a fraction of 0.35. Finally, the company with the highest fraction of directors elected by employee-shareholders is Essilor International, with 27% in 2000.
Data on corporate boards is extracted from registration documents available on the Autorité des Marchés Financiers (AMF) website, on the Thomson One Banker database or on the Internet websites of individual companies. In some cases, we use “Rapports de contrôle interne et de gouvernement d’entreprise” available on the AMF website.
Information displayed in registration documents or in annual reports is not always accurate, especially for years before 2001. After that year, new regulations forced companies to publish more details on the composition of their boards. Several databases have been used to fill in missing biographical information of directors (such as gender, age, nationality, academic background), including “Who’s Who”, “Guide des Etats-Majors des Grandes Entreprises” and press issues available from the Factiva database and other Internet sites.
In order to accurately count the number of outside directorships held by directors, we count only directorships in other listed companies as listed in the Dafsaliens database. Even though this indicator may be biased downwards, this choice was necessitated by the fact that companies consistently report only directorships in listed companies in their published documents. We decide whether directors are dependent or independent using the criteria presented by Viénot (1995, 1999) and Bouton (2002), who define independent directors as directors who “do not have any links with the company, its group or management liable to affect their unbiased judgement.”
Economic and financial data have been collected from the Worldscope database. Other sources of information or databases have been used in some cases, such as registration documents and annual reports
and the Diane and Stockproinfo databases. For most of our multivariate tests, we follow La Porta et al. (2000) and Faccio et al. (2001), and exclude firms with negative net income, negative cash flow and firms whose dividends exceed sales.
4.1. Firm, ownership, and board variables
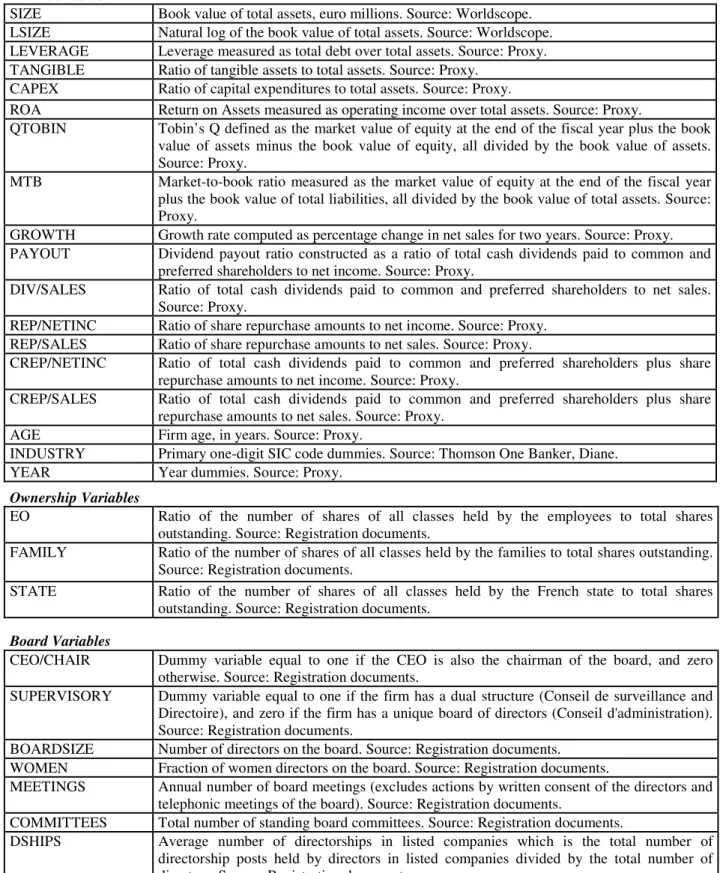
Table 1 defines the firm, ownership, and board variables used in our tests and regressions. The firm variables used in this article are the following: SIZE is the book value of total assets in euro billions. LSIZE is the natural log of book value of assets; LEVERAGE is measured as total debt over total assets; TANGIBLE is the ratio of tangible assets to total assets; CAPEX is the ratio of capital expenditures to total assets; ROA is the return on assets measured as operating income over total assets; QTOBIN is the Tobin’s Q defined as the market value of equity at the end of the fiscal year plus the book value of assets minus the book value of equity, all divided by the book value of assets; MTB is the market-to-book ratio measured as the market value of equity at the end of the fiscal year plus the book value of total liabilities, all divided by the book value of total assets; and GROWTH is the growth rate computed as percentage change in net sales for two years. PAYOUT is the dividend payout constructed as a ratio of total cash dividends paid to common and preferred shareholders to earnings after taxes but before extraordinary items; DIV/SALES is the ratio of cash dividends paid to common and preferred shareholders to net sales; REP/NETINC is the ratio of share repurchase amounts to net income; REP/SALES is the ratio of share repurchase amounts to net sales; CREP/NETINC is the ratio of cash dividends paid to common and preferred shareholders and share repurchase amounts to net income; and CREP/SALES is the ratio of cash dividends paid to common and preferred shareholders and share repurchase amounts to net sales. AGE is the firm age in years; EO is the ratio of the number of shares of all classes held by the employees to total shares outstanding; FAM is the ratio of the number of shares of all classes held by the families to total shares outstanding; STATE is the ratio of the number of shares of all classes held by the employees to total shares outstanding; CEO/CHAIR is a dummy variable equal to one if the CEO is also the chairman of the board, and zero otherwise; SUPERVISORY is a dummy variable equal to one if the firm has a dual structure (Conseil de surveillance and Directoire), and zero if the firm has a single board of directors (Conseil d’administration); BOARDSIZE is the number of directors on the board; and WOMEN is the fraction of women on the board. MEETINGS is the annual number of board meetings (excludes actions by written consent of the directors and telephonic meetings of the board), as described in Vafeas (1999); COMMITTEES is the total number of standing board committees, and DSHIPS is the average number of directorships in listed companies which is the total number of directorship posts held by directors in listed companies, excluding the directorship in the sample firm, divided by the total number of directors. PEMPLOYEES is the fraction of directors elected from among the employee-shareholders on the board;
PEMP is the fraction of directors elected from among the employees on the board; and PEMPSHARE is the fraction of directors elected from among the employee-shareholders on the board.
**** Insert Table 1 about here ****
France seems to be the only major country to offer the opportunity of choosing either a single or dual-board structure for any corporate firm, even when listed. The 1966 French Business Law allows corporate firms (Sociétés Anonymes) to choose between two different corporate governance systems. These are: (1) A one-board system, relying on a board of directors (Conseil d’administration), elected at the general meeting of shareholders. The board of directors appoints a Chairman/CEO (Président Directeur Général) charged with the day-to-day running of the company. Since 2001 (law of the 15 May 2001, called NRE = Nouvelles régulations économiques = new economic regulation), companies are allowed to appoint a CEO who is not the chairman of the board. CEO/CHAIR is a dummy variable equal to one if the CEO is also the chairman of the board, and zero otherwise. (2) A two-board system relying on a Supervisory board (Conseil de surveillance) and a management board (Directoire). As in the one-board system, the members of the supervisory one-board are shareholders appointed by vote at the shareholders’ general meeting. The supervisory board then appoints the management board, whose members do not necessarily own shares in the company. This board is in charge of the day-to-day running of the company but has stricter reporting obligations than the Chairman/CEO in the one-board system.
4.2. Industrial breakdown of sample firms
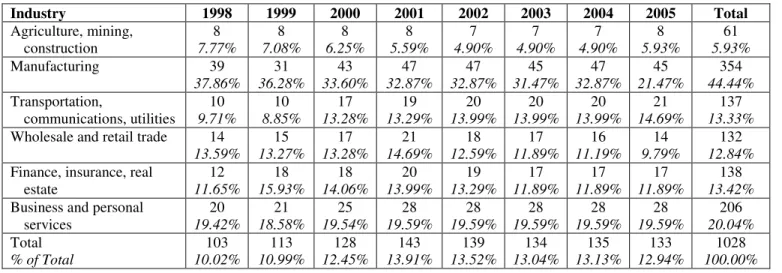
Table 2 describes the industrial breakdown of the firms that are included in the SBF 120 over 1998-2005. Manufacturing accounts for easily the largest fraction (44.4%) of all firm-year observations, while agriculture, mining, and construction account for the smallest (5.9%). Business and personal services represent one-fifth (20.0%) of all observations, while wholesale and retail trade, finance, and the transportation, communications and utilities sectors account for about 13% of all observations, respectively.
**** Insert Table 2 about here ****
We should note again that privatized firms are extremely important in France, and 233 of all firm-year observations (22.9%) are of fully or partially privatized companies. These are heavily over-represented among the very largest companies in the SBF every year and for the entire 1998-2005 study period. Roughly two-thirds (155 of 233) of the firm-year observations are for companies that were privatized less than ten years before the observation year, while the remaining one-third (78 observations) are for companies privatized more than ten years previously. The French state owns an average (median) 19.49% (4.47%) of the stock of companies that were privatized recently, while the state owns only an
average (median) 1.70% (0%) of the companies privatized more than 10 years previously. 786 firm-year observations are for companies that were never state-owned, though the French state still owns an average 1.10% (0%) of the stock of these firms.2 State ownership declines monotonically with time after the initial privatization sale.
4.3. Univariate analyses
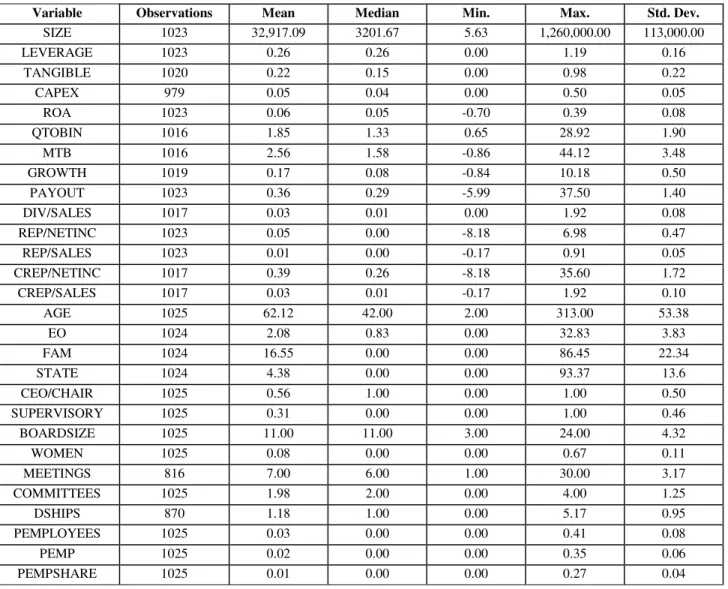
As a first look at how firms with employee directors differ from other large French companies, we perform univariate comparisons. These are presented in Table 3. The first column of data presents mean and median values for the full sample of SBF 120 firms for 1998-2005, while the next three columns present comparisons of firms with (1) and without (0) any types of employee-directors; firms with and without employee-directors elected by right; and firms with and without directors elected by employee-shareholders. Univariate tests are reported for the test for equality of means (Student-t test) and the test for equality of medians (Wilcoxon test) between firms having employee directors, directors elected from among the employees or from among the employee-shareholders, and firms which don’t have these characteristics.
**** Insert Table 3 about here ****
Not surprisingly, SBF 120 firms are very large, as measured by the book value of assets, with an overall average (median) size for all firm-year observations of €32.92 billion (€3.20 billion). Firms with all types of employee-directors are highly significantly larger than those without, and firms with directors elected by employees by right are the largest of all. This is unsurprising, since these tend to be recently privatized companies. The average (median) book-value leverage ratio for the entire sample is 25.8% (25.7%), and there is no significant difference in leverage ratios between any groups based on whether they have employee directors.
The full sample average (median) ratio of tangible to all assets is 22.1% (14.9%), and firms without employee directors have significantly higher tangible asset ratios than all categories of firms with employee-directors. Similarly, companies without employee directors are significantly more profitable than firms with such directors. The sample average (median) ROA is 5.6% (5.1%), and the ROA for firms without employee-directors averages 5.9% (5.4%) versus average ratios of between 3.4% (2.3%) and 3.8% (2.6%) for companies with directors elected by employees. Companies without employee representation on boards also growth significantly more rapidly than do those with employee directors, with average (median) growth rates of 19.3% (8.8%) versus rates between 5.1% (3.7%) and 6.7% (4.0%). The overall average growth rate for all firm-year observations is 16.8% (7.7%), but companies without
2
The French state actually owns these stakes through the CDC, or Caisse des depôts et consignation, which is a state institutional investor similar to a modern sovereign wealth fund.
employee board representation grow significantly more rapidly than any category of firms with such representation.
There are generally no significant differences between firms with and without employee directors with respect to return volatility (STD), payout ratios (PAYOUT), and the fraction of women (WOMEN) on the corporate boards. The exceptions to this are that firms with directors elected by right (DEMP=1) have significantly higher volatility than firms with no employee representation, and the median fraction of women directors is higher in firms with directors elected by right and in firms with directors elected by employee-shareholders than in companies without employee directors—for whom the median fraction of women directors is zero.
On the other hand, firms with employee directors are significantly older than firms without such representation and have significantly larger boards that meet significantly more frequently and have significantly more standing committees. The average ages of firms with employee directors (DEMPLOYEE=1), with directors elected by right (DEMP=1), and with directors elected by employee-shareholders (DEMPSHARE=1) are, respectively, 79.2, 68.8, and 88.8 years versus 57.9 years for firms with no employee board representation and 62.2 years for the full sample of all companies.Medians ages show even greater differences, with a no-representation company median age of 39.0 years compared with medians of 60.0, 69.0, and 72.0 years for DEMP=1, DEMPLOYEE=1, and DEMPSHARE=1 firms. The average (median) size of corporate boards without employee representation is 9.9 (10.0) directors, significantly smaller than the 15.4 (15), 16.1 (16), and 15.0 (15) member boards of companies with any type of employee-directors, those with directors elected by right, and those with directors elected by employee-shareholders. The boards of firms without employee directors meet an average (median) of 6.9 (6) times per year and have an average of 1.79 (2) standing committees. Companies with employee-directors meet on average 7.42 (7) times per year and have a mean 2.71 (3) standing committees, and the mean and median values are similar for firms with directors elected by right and for companies with directors elected by employee-shareholders. Thus, companies with board members representing employees have significantly larger, more complex, and more active boards than do companies without employee representatives.
As noted above, French corporate law allows, but does not mandate that firms may select a two-tiered board, with separate supervisory and management boards, as per the German model. Companies are also allowed, but not required, to combine the positions of CEO and Chairman of the Board of Directors. These choices allow for a very interesting comparison between firms that do and do not select a supervisory board and combine the positions of CEO and board Chair, and we find significant differences between firms with and without employee board representation for both variables. Companies without employee representation are, on average, three times more likely to have a two-tiered board than are firms
with employee directors, with 34.6% of the former having supervisory boards versus 11.1% in the latter. Conversely, companies with employee directors are far more likely to combine the positions of CEO and board Chair than are firms without employee representation, with 51.3% of the latter companies having combined CEO/Chair positions versus 75.4% for the former. Both of these findings reflect the greater likelihood that companies with employee directors will be privatized companies, where the state designed in corporate governance structures that mirror perceived global—or at least American--standard practice. Firms with employee and employee-shareholder directors on their boards have greater state ownership than their counterparts. However, family ownership is less massive in these firms. Results remain robust when we use voting rights (both in univariate and multivariate tests) rather than shareholdings.
In sum, these univariate comparison suggest that, compared to companies without employee board representation, firms with employee-directors are larger, older, less profitable, have more intangible and fewer tangible assets, have larger and more complex boards that meet more frequently, are less likely to have a two-tiered board structure, and are more likely to be headed by a manager with the combined duties of CEO and Board Chair. Furthermore, the univariate analyses reveal little difference in observed financial policies between companies with directors elected by employees as a matter of right and companies with directors elected by employee-shareholders. Naturally, univariate comparisons can only tell us so much, so we now employ regression analyses to examine the impact of employee directors on corporate valuation and financial policies.
5. Methodology and regression results
Our multivariate analyses consist of a series of regressions, with which we examine how employee representation impacts corporate valuation, payout policy, and board of director performance. We measure valuation using two ratios, Tobin’s Q and return on assets (ROA), with Tobin’s Q defined as the market value of equity at the end of the fiscal year plus the book value of assets minus the book value of equity, all divided by the book value of assets. Payout is measured variously as cash dividend payments divided by net income (PAYOUT), cash dividends divided by sales (DIV/SALES), share repurchases divided by net income (REP/NETINC) and sales (REP/SALES), and the combined value of cash dividends and share repurchases divided by net income (CREP/NETINC) and sales (CREP/SALES). Board performance is measured as the annual frequency of board of director meetings, with the fewer meetings required being considered a measure of superior performance [Vafeas (1999)]. Finally, we estimate the likelihood of directors being elected by employees (by right) and by employee-shareholders based on observable firm characteristics.
We employ three types of cross-sectional regressions: ordinary least squares, Logit (when the dependent variable is a dummy); and Tobit (when the dependent variable is censored) regressions. As discussed in Greene (2003), an OLS regression model is not suitable for a discrete-censored variable like MEETINGS as it provides biased and inconsistent estimations. For each of our regressions, we report the size of the sample (i.e. the number of non-missing observations in the sample) and the adjusted R² or the Pseudo R². Our tables present the coefficients and t-statistics and indicate coefficient significance levels at 1%, 5% and 10%. Then, results are corrected for heteroscedasticity using the White (1980) test.
5.1. The impact of employee board representation on firm value
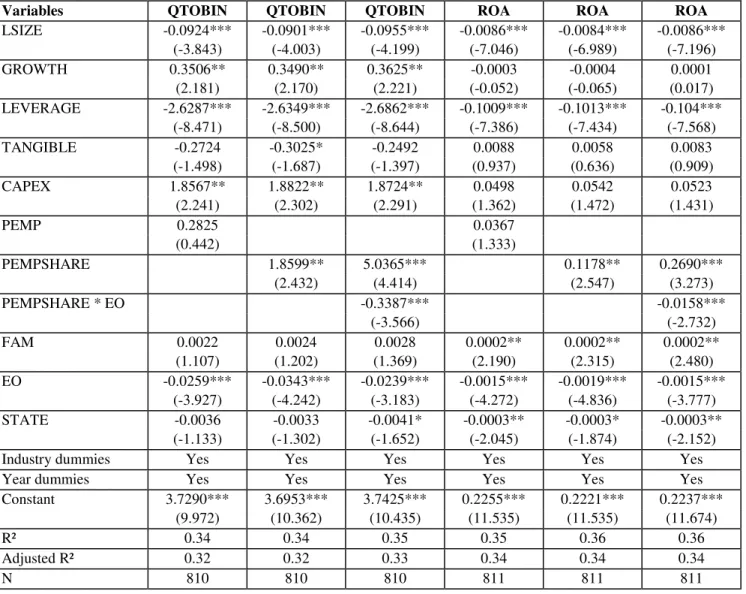
Table 4 presents the results of estimating the impact of employee ownership on firm valuation and profitability. Columns 2-4 of Table 4 present estimations of Tobin’s Q, while columns 5-7 present estimations of ROA. Consistent with extant literature, both of these measures are significantly negatively related to firm size and financial leverage, suggesting that smaller and less indebted companies have higher valuations and are more profitable. Also unsurprisingly, Tobin’s Q is significantly positively related to growth rate and the level of capital investment spending divided by total assets, but ROA is not significantly related to either growth or capital spending. The level of tangible assets as a fraction of total assets is not significantly related to either Tobin’s Q or ROA.
**** Insert Table 4 about here ****
Turning to the ownership structure and employee representation variables, we see that the fraction of directors elected by right by employees (PEMP) does not significantly impact either Tobin’s Q or ROA, but the fraction of directors elected by employee-shareholders (PEMPSHARE) is significantly positively related to both valuation measures. This is true whether PEMPSHARE is regressed on Tobin’s Q and ROA in isolation (columns 3 and 6) or along with a variable interacting PEMPSHARE with employee ownership (in columns 4 and 7). In the latter cases, the coefficient on PEMPSHARE*EO is significantly negative in the estimations of both Tobin’s Q and ROA. Taken together, these results suggest that low levels of employee-shareholder representation on corporate boards are value-enhancing, but this effect diminishes as employee ownership increases.
The separate effects of family, employee, and state ownership on firm value and profitability contrast sharply. Employee ownership (EO) is significantly negatively related to both Tobin’s Q and ROA in all estimations, suggesting that rising employee stock ownership reduces value, independent of whether this ownership is also reflected in board representation. We have already seen that when these occur simultaneously the effect is significantly negative. Residual state ownership is always negatively related to Tobin’s Q—significantly so in one of the three regressions—and is always significantly
negatively related to ROA at the 10% significance level, or higher. Family ownership is not significantly related to Tobin’s Q, but is significantly positively related to ROA at the 1% level in all three regressions. To summarize these results, we find that Tobin’s Q is significantly higher for smaller, less leveraged, more rapidly growing firms that spend more on capital investment and which have directors elected by employee-shareholders. Tobin’s Q is lower for companies with high levels of employee share ownership and where the state has a higher residual equity ownership. ROA is higher in smaller, less leveraged companies in which family ownership remains high, and where employee-shareholders elected one or more directors. Rising employee and state ownership both reduce ROA. Finally, the fact that the adjusted R2 is 0.33 or 0.34 in all six regressions suggests that our estimation models are explaining a substantial fraction of the cross-sectional variation in valuation and profitability measures in this sample.
5.2. The impact of employee board representation on payout policy
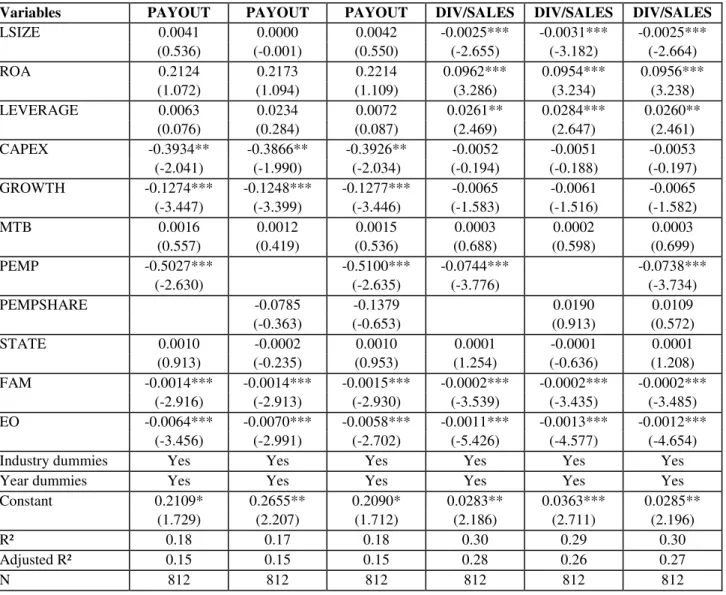
Table 5 presents the results of estimating the impact of employee ownership on corporate payout policy. Columns 2-4 of Table 5’s Panel A present estimations of cash dividend payments as a percent of net income (PAYOUT) and columns 5-7 present similar findings for dividends as a percent of sales (DIV/SALES). Using an analogous format, Panels B and C of Table 5 present estimations of, respectively, share repurchases and combined dividends and share repurchases.
**** Insert table 5 about here ****
Results for the two cash dividend estimations show both similarities and differences with existing empirical research. Consistent with prior research, we find that both PAYOUT and DIV/SALES are significantly positively related to profitability (ROA) and negatively related to firm growth. Additionally, PAYOUT is significantly (at the 10% level) negatively related to capital spending in two of the three regressions, while DIV/SALES is significantly positively related to leverage at the 1% level in all three regressions. On the other hand, our finding of a consistently—and for DIV/SALES, significantly--negative relationship between firm size and dividend payout differs dramatically from the positive relationship between size and payout most other empirical studies report, and is driven solely by including financial firms in the analysis. When the model is re-estimated on a sample of firms excluding financial companies, the typical positive relationship between size and payout is restored. The positive size-payout relationship is also re-established once we define “payout” more broadly to include share repurchases, as detailed below.
The impact of increasing board representation by employee-directors is striking and highly informative. The fraction of directors elected by employees by right (PEMP) is significantly negatively related to both PAYOUT and DIV/SALES at the 1% level in all four regressions where it is employed. Conversely, the presence of directors elected by employee-shareholders (PEMPSHARE) has no
significant effect on either measure of dividend payout. These results suggest that directors who represent workers who are not also shareholders work to reduce the amount of cash distributed by the firm to outside shareholders whereas directors representing employee-shareholders act in the interest of all shareholders and do not reduce payouts.
Employee share ownership (EO) has the same significantly negative impact on both measures of dividend payout that was observed for PEMP, and we interpret this result similarly—as resulting from a desire on the part of employees to retain cash in the firm at the expense of shareholders. Family ownership is also significantly negatively related to both measures of dividend payout, perhaps because founding family members are likely to also be managers and thus able to enjoy the private benefits of control directly—without sharing corporate profits with outside shareholders in the form of dividends. Somewhat surprisingly, state ownership is not significantly related to either PAYOUT or DIV/SALES.
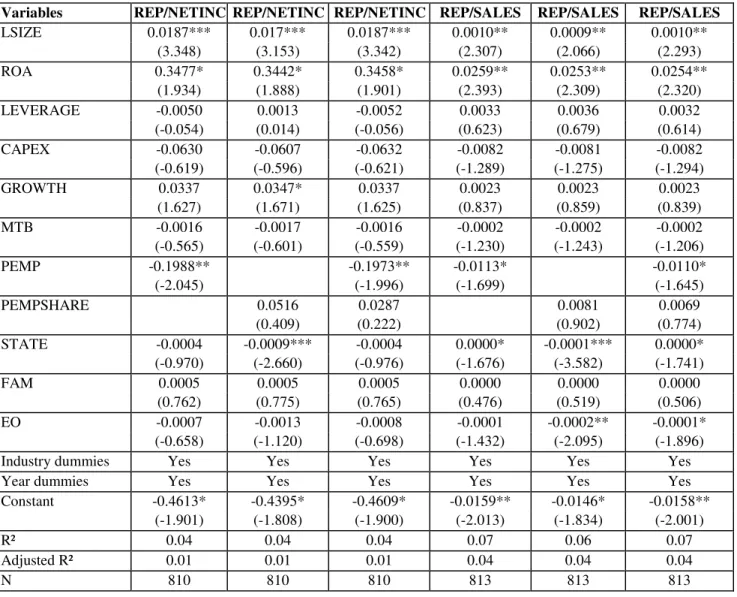
Panel B of Table 5 presents results for estimating payout as share repurchases divided by net income (REP/NETINC) and by sales (REP/SALES), with the former being presented in columns 2-5 and the latter in columns 5-7. Consistent with existing literature [see Skinner (2008) and von Eije and Megginson (2008)] both share repurchase measures are significantly positively related to firm size and profitability (ROA), and significantly negatively related to the market-to-book value ratio (MTB). As with cash dividends, share repurchases are significantly negatively related to the fraction of directors elected by workers as a right (PEMP) and to the level of employee stock ownership. State ownership is now consistently—and, in two of six cases, significantly--negatively associated with payout, defined as repurchases. Once again, the presence of directors elected by employee-shareholders does not significantly impact share repurchases.
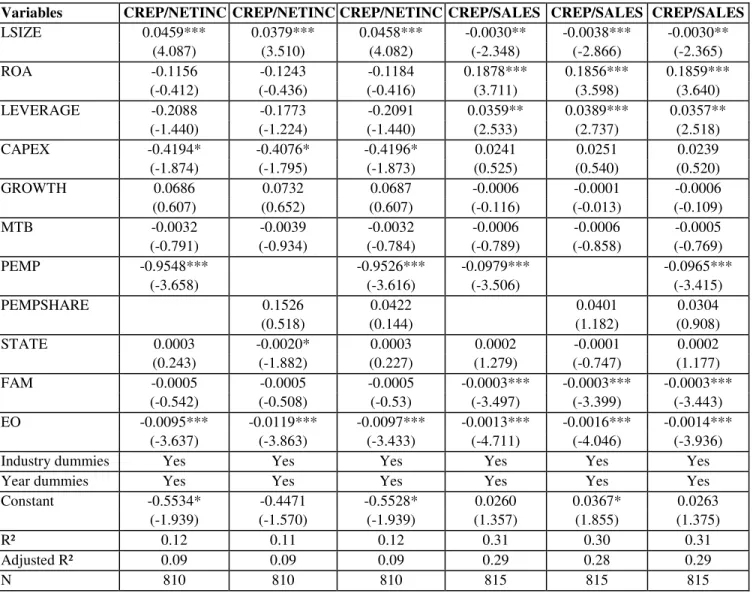
Finally, Panel C presents estimations where payout is defined as the combined level of cash dividend payments as a percent of net income (CREP/NETINC, in columns 2-4) and sales (CREP/SALES). Both combined payout measures are significantly positively related to profitability and negatively related to the fraction of directors elected by employees by right (PEMP) and to employee share ownership. Combined payout as a percent of sales (CREP/SALES) is significantly positively related to leverage and significantly negatively related to family ownership. Rather strangely, CREP/NETINC is significantly positively related to firm size, as in the repurchase estimations, while CREP/SALES is significantly negatively related to SIZE, as was the case for cash dividends.
Taken together, these results show that both ownership structure and board representation materially and significantly influence corporate payout policies. The presence of directors elected by employees as a right (PEMP) has a consistent and generally significant negative impact on both cash dividend payments and share repurchases. The same is true for employee ownership, as distinct from representation. This is consistent with employees who are not also owners acting to block cash
distributions from firms that would benefit shareholders. On the other hand, directors representing employee-shareholders have no impact on corporate payout policies, and instead seem to have the same interests as directors representing outside shareholders.
5.3. The impact of employee board representation on board performance
We estimate the impact of employee representation on corporate board performance in two ways. First, we test whether worker representation on the board leads on average to more frequent board meetings. Second, we estimate the likelihood that directors will be elected by employees as a right and by employee-shareholders based on observable firm characteristics.
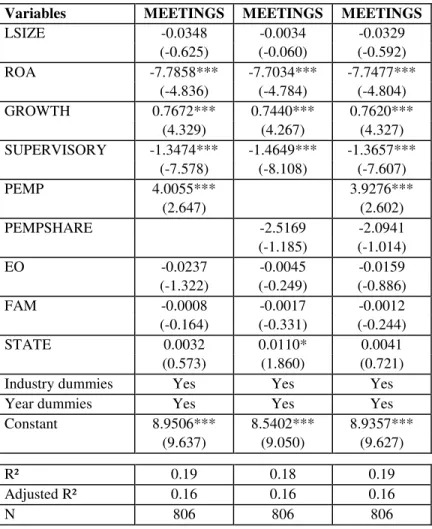
Table 6 presents the results of estimating average board meeting frequency, and many of the findings are fairly intuitive. For example, it is unsurprising that boards of companies that are growing more rapidly will meet significantly more frequently on average than will less complex boards of slower growing firms, or that boards of more profitable companies will meet significantly less frequently than boards of more financially troubled firms. Greater complexity in the task of overseeing a company and more rapid sales growth imply the need to assemble as a board more frequently to assess and adjust firm objectives, while the need to make such adjustments is less when the current corporate plan is working— when profits are high.
**** Insert Table 6 about here ****
The impact of employee representation on board meeting frequency is once more highly informative in that it shows that board members elected by employees as a right (who are not necessarily also shareholders) are associated with significantly more frequent board meetings than are board members who represent shareholders, either employee-shareholders or outside shareholders. The coefficient on the continuous variable measuring the fraction of the board accounted for by workers (PEMP) is significantly positive. These results again suggest that simply giving employees the right to elect a fraction of the board of directors imposes unnecessary costs on the firm, in the form of more frequent board meetings, but that directors elected by workers who are also shareholders do not impose similar costs.
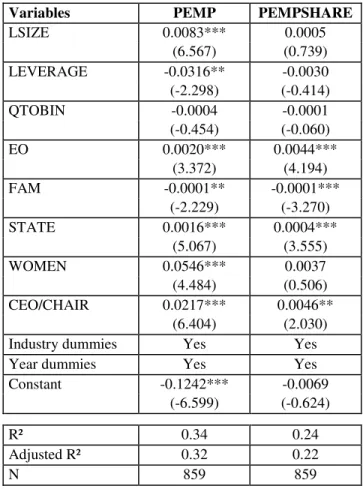
Finally, Table 7 presents the results of estimating the fraction of a corporate board that will be elected by employees. Since the dependent variable is truncated at zero, Tobit regression is used. Column 2 examines the fraction of the board represented by directors elected by workers by right (PEMP), while column 3 examines the fraction of the board represented by directors elected by employee-shareholders. Four variables significantly influence both types of employee representation. Board representation is likely to be higher when the CEO and board chair’s position are combined (CEO/CHAIR), when employee share ownership (EO) is higher, when state ownership is higher (STATE), and when family ownership is lower (FAM). The rationale for the EO and STATE results are fairly obvious, since we
know that employee representation is common only in privatized companies and board representation is likely to be allocated to employees when their share holdings are sizeable (PEMP) and when employees have the votes to elect one of their own anyway (PEMPSHARE). Additionally, Tobin’s Q does not significantly predict either type of employee representation, and PEMPSHARE is not significantly related to any other variable.
**** Insert Table 7 about here ****
On the other hand, PEMP is significantly positively related to firm size (SIZE) and to the fraction of women directors on the corporate board, and negatively related to leverage. These results suggest that employee representation is a result of political and legal forces, especially the amount of stock retained in privatized companies by the state and employees’ own share ownership. Managing families are less willing to grant employees representation, whereas firms with a very powerful managing director (CEO/CHAIR) are more willing to allow workers to be represented on the board. Though political influences matter for both types of representation, the election of directors representing employees who are not also shareholders seems to be driven by more explicitly political factors—especially the presence of larger fractions of women directors—and is more likely in the largest firms, which naturally tend to be privatized companies. There is also some evidence that firms employ leverage in order to reduce the size of their outstanding equity capital and thus reduce the need to grant director positions to employees who are not also shareholders.
6. Robustness checks and discussion
6.1. Testing for endogeneity in financial policy choice
While the univariate and regression results presented above are suggestive and present a clear message that board representation granted to employees as a matter of right tends to be value-reducing, we must subject these findings to robustness checks before accepting them as fully valid. In particular, we must check for endogeneity in the choice of financial policies, particularly payout policy. We do this by employing two-stage least squares to first compute a predicted level of employee representation based on observable firm and ownership structure characteristics, and then using that predicted measure in tests of dividend payout and share repurchases. This explicitly allows for the possibility that some factor other than the presence of employee directors on corporate boards—in particular, the fact that a company had once been state-owned—might actually be driving valuation results and corporate payout policies.
Table 8 presents the endogeneity-adjusted results of estimating the impact of employee ownership on corporate payout policy. As before, columns 2-4 of Table 8’s Panel A present estimations of cash dividend payments as a percent of net income (PAYOUT) and columns 5-7 present similar findings for
dividends as a percent of sales (DIV/SALES), firm valuation, and profitability. Panels B and C of Table 8 present analogous estimations of, respectively, share repurchases and combined dividends and share repurchases.
**** Insert Table 8 about here ****
Results for the two cash dividend estimations, adjusted for endogeneity, are generally similar to the original unadjusted findings. Additionally, while there are fewer significant relationships overall, the adjusted R2 values are virtually identical to those in the unadjusted regressions of Table 5. Both PAYOUT and DIV/SALES are always significantly negatively related to firm growth, and are positively related to profitability (ROA) when both the percent of directors elected by employees as a right (PEMP) and the percent of directors elected by employee-shareholders (PEMPSHARE) are included simultaneously. When only PEMP is included, the relationship between size and dividend PAYOUT and DIV/SALES is insignificant, while there is a significant negative relationship SIZE and DIV/SALES when only PEMPSHARE is included. PAYOUT is again significantly negatively related to capital spending (CAPEX/ASSETS) in two of the three regressions, now at the 5% significance level, while the market-to-book (MTB) ratio is now significantly positively related to DIV/SALES at the 1% level. Adjusting for endogeneity materially weakens the positive relationship between LEVERAGE and DIV/SALES, which is now significant (at the 10% level) only once.
The impact of increasing board representation by employee-directors changes subtly once we adjust for endogeneity. As before, the fraction of directors elected by employees by right (PEMP) is significantly negatively related to both PAYOUT and DIV/SALES (at the 1% level) in all four regressions where it is employed. However, the coefficients on the four estimations of PEMPSHARE, the fractional representation of directors elected by employee-shareholders, are much larger than before and the relationship between PEMPSHARE and DIV/SALES is now significantly positive (at the 1% level) in the estimation where both employee representation measures are included. These results suggest that directors who represent workers who are not also shareholders work to reduce the amount of cash distributed by the firm to outside shareholders, whereas directors representing employee-shareholders actually increase payouts.
Both employee share ownership (EO) and family ownership (FAM) have the same negative impact on PAYOUT and DIV/SHARE documented previously, but coefficient size and significance levels are reduced after adjusting for endogeneity. Both measures are now significant in only three of six estimations, rather than consistently so as before. Interestingly, state ownership (STATE) becomes significantly positively related to both PAYOUT and DIV/SALES in all four regressions where PEMP is also an explanatory variable, suggesting that state ownership offsets the payout-reducing influence of
directors elected as a right by employees. STATE has the opposite impact on DIV/SALES when representation by employee-shareholders (PEMPSHARE) is high.
Panel B of Table 8 presents the endogeneity-adjusted results of estimating payout as share repurchases divided by net income (REP/NETINC) and by sales (REP/SALES), with the former being presented in columns 2-5 and the latter in columns 5-7. The financial variables generally have the same coefficient signs and significance levels observed before, with both share repurchase measures being significantly positively related to firm size and profitability (ROA), and significantly negatively related to the market-to-book value ratio (MTB). Now, however, repurchases are always negatively related to capital investment spending, and significantly so in five of the six regressions. Share repurchases are still negatively related to the fraction of directors elected by workers as a right (PEMP), to the level of employee stock ownership (EO), and to the level of state ownership (STATE). Though the coefficients on these variables are now much larger than in the previous regressions (unadjusted for endogeneity), they are less frequently significant. As with cash dividends, adjusting for endogeneity makes the relationship between the fraction of directors elected by employee-shareholders and share repurchases significantly positive in three of the four regressions where PEMPSHARE is included. Employee shareholders seem to promote share repurchases by companies on whose boards they are represented.
Finally, Panel C presents estimations where payout is defined as the combined level of cash dividend payments as a percent of net income (CREP/NETINC, in columns 2-4) and sales (CREP/SALES). Most relationships are similar to those observed in the earlier regressions that did not adjust for endogeneity, though fewer are significant and the overall explanatory power of the regressions is somewhat reduced. Combined payout is always positively related to size, profitability, and leverage, though only significantly so twice with ROA and once with LEVERAGE, when PEMP is also included in the regressions. Employee ownership (EO) is always negatively related to payout, significantly so in four of six regressions, while there is less consistency in the relationship between payout and family and state ownership (FAM, STATE). The coefficients on STATE are generally negative, and significantly so in two regressions, but the FAM coefficient is positive three times and negative three times, with one of each sign being significant. Most importantly, the fraction of a firm’s board represented by directors elected by right by employees (PEMP) is always negatively related to the combined payout ratios, and significant in two of four regressions, while the fraction of directors elected by employee-shareholders (PEMPSHARE) is always positively related to the combined payout ratio, and significantly so in three of four regressions.
These endogeneity-adjusted results support the robustness of our previous findings. The presence of directors elected by employees as a right (PEMP) has a consistent and generally significant negative impact on both cash dividend payments and share repurchases. Employee ownership, as distinct from
representation, similarly reduces payout, supporting the conclusion that employees who are not also owners act to block cash distributions from firms that would benefit shareholders. In contrast to prior findings, however, adjusting for endogeneity reveals that directors representing employee-shareholders significantly increase cash distributions by companies on whose boards they sit, which strengthens the conclusion that employee-shareholders have interests that are very much consistent with those of other shareholders.
6.2. Robustness checks and extensions
In this section, we present results of various tests of the impact of employee representation on firm value using alternative measures of employee participation as well as several different measures of performance. In particular, we examine whether workers’ affiliation with a radical left-wing union affects the objectives of their elected board representatives, and in turn affects firm valuation, payout policy,
6.2.1. Staff costs
As discussed in Allen and Gale (2002), it may be in the interest of both shareholders and workers to cut dividends in order to maintain wages and employment. We examine the impact of employee representation on staff costs, where STAFFCOST is a continuous variable representing wages paid to employees of the company divided by the number of employees. It includes all employee benefits, such as health insurance and contributions to pension plans. This variable is expected to be higher for knowledge-intensive firms. As we control for industry, size, growth, capital expenditure and all the variables included in regressions of Table 4, we may also measure a high wage policy. In unreported results, we observe a positive and significant impact of employee board representation, both elected and shareholder employees, on staff costs. This is consistent with previous findings reported in Table 4, which show performance also increases with shareholder employee directors, implying that shareholders may actually benefit from a high wage policy.
6.2.2. Union affiliation of employees on the board
Nearly 94% elected employee directors are union representatives, whereas shareholder employee directors are mainly non-affiliated. French industrial relations differ from those in other developed countries in that the relationship between labour and capital is more adversarial and ideologically charged than elsewhere, so we investigate the impact of radical union affiliation of employee directors on corporate valuation and payout policies.3 Data on union affiliation of employee-directors comes from
3
registration documents, Factiva and LexisNexis databases, or from direct contacts with trade unions or corporate investor relations centers.
Over the period 1998 to 2005, 82% of the employee-directors elected by right are affiliated to one of the five confederations (unions) recognized by the French state as negotiating partners in 1966 (CGT, FO, CFDT, CFTC and CFE-CGC), while 11% are affiliated with other French or foreign confederations and 7% are non-affiliated. We split union affiliations into two groups based on radical ideology--the communist/class struggle unions and others. We replicate the Table 4, 5 and 6 regressions including alternatively the fraction of employees on the board belonging to the more left-oriented unions, the fraction of employees belonging to other unions, and both variables. We find that results remain qualitatively similar for payout policy. Both groups of union representatives have a negative impact on payouts. However, we find that increasing the number of left-oriented employee directors on the board increases staff costs, all else equal, but has no impact on Tobin’s Q, and even has a positive impact on ROA. On the other hand, more consensual union representatives lead to an increase in the number of board meetings, which is not the case for more left-oriented representatives. These results favor left wing union directors getting better salaries for employees working harder, whereas more consensual union directors enhance monitoring by increasing the number of meetings.
6.2.3. State ownership versus privatization variables
Most of the firms that have elected employees on the board are privatized firms. Some of them were first privatized more than 20 years ago, some more recently, and the French Sate still owns shares in most of them. The state ownership decreases over time after privatization. Therefore state ownership and privatization variables (number of years since privatization, period of privatization, government under which privatization took place) are highly correlated. In tables 4 to 8, we include state ownership as an independent variable rather than a privatization variable, because it is more homogeneous relative to other shareholders (family, employee ownership). If we include privatization variables instead of state ownership, the results are qualitatively similar.
6.2.4. Board characteristics
In our sample, the correlation between firm size and the number of directors on the board is 0.709. Introducing them together in the regressions would lead to potential spurious relations. We replicate tables 4 to 8 analyses including board size instead of firm size. We find similar qualitative and statistical results to those reported in the tables. We also perform variations of regressions excluding two-tier board firms from our sample. In each specification, the signs and significance of the coefficients of independent variables are essentially unchanged. Next, we examine if employee directors sit on board