HAL Id: tel-00669877
https://tel.archives-ouvertes.fr/tel-00669877
Submitted on 14 Feb 2012HAL is a multi-disciplinary open access archive for the deposit and dissemination of sci-entific research documents, whether they are pub-lished or not. The documents may come from
L’archive ouverte pluridisciplinaire HAL, est destinée au dépôt et à la diffusion de documents scientifiques de niveau recherche, publiés ou non, émanant des établissements d’enseignement et de
Syed Yasir Alam
To cite this version:
Syed Yasir Alam. EXPERIMENTAL STUDY AND NUMERICAL ANALYSIS OF CRACK OPEN-ING IN CONCRETE. Mechanics of the structures [physics.class-ph]. Ecole Centrale de Nantes (ECN), 2011. English. �tel-00669877�
SCIENCES POUR L’INGENIEUR GEOSCIENCES ARCHITECTURE
Année 2011
N° B.U. :
Thèse de D
OCTORAT
Spécialité : GENIE CIVIL
Présentée et soutenue publiquement par:
S
YED
Y
ASIR
ALAM
le 10 Mai 2011 à l’Ecole Centrale de Nantes
T
ITREE
XPERIMENTAL STUDY AND NUMERICAL ANALYSIS OF CRACK OPENING IN CONCRETEJ
URYPrésident : M. Gilles PIJAUDIER-CABOT Professeur - Université de Pau et des Pays de l’Adour Rapporteurs : M. Frédéric COLLIN Chercheur qualifié FNRS - Université de Liège
M. Alain SELLIER Professeur - Université Paul Sabatier, Toulouse Examinateurs : M. Nicolas CHEVAUGEON Maître de Conférences - Ecole Centrale de Nantes
M. Panagiotis KOTRONIS Professeur - Ecole Centrale de Nantes M. Ahmed LOUKILI Professeur - Ecole Centrale de Nantes
M. Stéphane MOREL Maître de Conférences, HDR - Université de Bordeaux I M. Jean Michel TORRENTI Professeur - Ecole Nationale des Ponts et Chaussées
Directeur de thèse : Ahmed LOUKILI
Laboratoire : Institut de Recherche en Génie Civil et Mécanique, Nantes Co-encadrant : Nicolas CHEVAUGEON
Laboratoire : Institut de Recherche en Génie Civil et Mécanique, Nantes
I would like to express my deepest gratitude to Higher Education Commission of Pakistan for the financial support towards my Doctorate degree.
I am highly grateful to Prof. Ahmed Loukili, my dissertation director for his guidance, support and encouragement during all these years. Discussion with him has always been a source of enthusiasm for me to perform quality research. I am very thankful to Prof. Panagiotis Kotronis, for his help, advice and fruitful discussions. I am also grateful to Dr. Nicolas Chevaugeon, my co-supervisor for his kind assistance during this study.
I am grateful to the students, Annie and Thibault who worked with me during this research work.
I’m indebted to Mr. Jean-Pierre Regoin for his expertise in building the experimental setup and full fledge cooperation through out this research. I am also thankful to Mr. Jean-Yves Letouzo and Mr. Patrick Denain for their skilled assistance in building the experimental setup.
I thank all the colleagues of the Civil Engineering group for their support more specifically for the administrative issues and the French language. I am highly grateful to my colleague friends Achraf and Jacqueline for their continuous help and the friendly environment during work.
I am very thankful to my Pakistani friends, Bilal, Sami, Atif, Naeem,…… for the support and loving environment during my stay.
I cannot thank enough to my parents and my sister for their love, support and prayers without which I would not be able to complete this task.
I am also thankful to my wife for her understanding, support, love and encouragement in the difficult phases of this journey.
It is commonly accepted that there is a size effect on the nominal resistances of quasi-brittle materials such as cementitious materials. This effect must be taken into account in the design of the ultimate behaviour of concrete structures in order to avoid damage and crack openings. These parameters are frequently used to study the behaviour of concrete and to characterize the durability of structures. Different theories exist in the literature to describe the size effect. Among them, we find the deterministic theory of Bazant where fracture energy is considered independent of the size and it is assumed that at peak load, the crack length is proportional to the size of the specimen.
In this work, attention is paid to investigate experimentally and numerically, the relationship between crack openings and length, and the size of the specimens.
In the experimental study, RILEM size effect method is adopted to test geometrically similar concrete beams of various sizes. Two types of concrete mixes are used with varying aggregate sizes in order to further investigate the effect of aggregate size on fracture behaviour. Digital Image Correlation (DIC) technique is adopted in this study to measure the cracking in concrete on the surface of the concrete specimen. It is established as a robust and highly precise tool for fracture measurements such as crack opening and crack length. The results have shown a significant size effect on the process of crack propagation. Furthermore, as the aggregate size increases the size effect becomes more critical. A case study of the size effect on crack openings and crack spacing in reinforced concrete beams is also presented. From serviceability point of view, it is observed that the Eurocode 2 underestimates the crack openings.
In the numerical study, the concrete beams are simulated using a nonlocal damage model. The internal length and other model parameters are calibrated by an inverse calibration technique using an automatic procedure. Crack opening profiles are extracted through post-treatment procedures. The mechanical behaviour and the crack propagation are finally analysed, reflecting a similar size effect as detected by the experimental results.
KEYWORDS
Concrete, cracking, crack opening, crack length, size effect, digital image correlation, nonlocal, modelling, damage, automatic calibration, inverse calibration.
Il est communément admis l’existence d’un effet d’échelle sur les résistances nominales des matériaux quasi-fragiles tels que les matériaux cimentaires. Cet effet doit être pris en compte dans le dimensionnement vis-à-vis du comportement ultime des structures en béton afin de limiter les dommages et les ouvertures de fissures. Celles-ci sont de plus en plus utilisées pour étudier le comportement du béton et caractériser la durabilité des structures. Différentes théories existent dans la littérature pour décrire l’effet d’échelle. Parmi celles-ci on trouve la théorie déterministe de Bazant où l’énergie de fissuration est considérée comme indépendante de la taille et il est supposé qu’à charge maximale, la longueur de fissure est proportionnelle à la taille de l'échantillon.
Dans le cadre de ce travail, on s’est attaché à étudier expérimentalement et numériquement les relations entre la longueur de fissure et la taille des éprouvettes.
Sur le plan expérimental, l’effet d’échelle est caractérisé par des essais de flexion trois points sur des poutres de béton entaillées de tailles géométriquement similaires. L'influence de la taille des agrégats sur le comportement à la rupture a aussi été étudiée. La technique de Corrélation d'Images Numériques (DIC) est adoptée dans cette étude pour déterminer à la fois la longueur et l’ouverture de la fissure à différentes étapes de chargement. Cette méthode s’est révélée comme un outil robuste et de haute précision pour la mesure des paramètres caractérisant les fissures. Les résultats ont montré un effet de taille significatif sur le processus de propagation des fissures. En outre, l’effet d’échelle diminue lorsque la taille des agrégats augmente. Une étude sur poutres en béton armé est aussi réalisée pour étudier l’effet d’échelle sur l’ouverture et l’espacement des fissures. De point de vue réglementaire, il a été observé que l’Eurocode 2 sous estime les ouvertures de fissures.
Sur le plan numérique, le comportement à la rupture des poutres en béton est simulé en utilisant un modèle d'endommagement non local. La longueur interne et d’autres paramètres du modèle sont calibrés par une technique de calibration inverse qui utilise une procédure automatique. Les profils d’ouverture de fissures sont déterminés par des procédures de post-traitement. L’analyse du comportement mécanique et de la propagation des fissures indiquent un effet d'échelle similaire à celui détecté par les résultats expérimentaux.
MOTS-CLÉS
Béton, fissuration, ouverture de fissure, longueur de fissure, effet d’échelle, corrélation d’images, nonlocal, modélisation, endommagement, calibration automatique, calibration inverse.
TABLE OF CONTENTS
TABLE OF CONTENTS ...1
GENERAL INTRODUCTION ...5
1 CHAPTER : LITERATURE REVIEW ON CRACKING IN CONCRETE ...9
1.1 Morphology of concrete and different levels of observation... 10
1.2 Microstructure of concrete ... 11
1.2.1 Microstructure of cement paste ... 11
1.2.2 Aggregates, properties and particle distribution... 12
1.2.3 Interfacial properties between aggregates and cement paste... 13
1.3 Fracture behaviour of concrete in tension... 14
1.3.1 Strain localization and softening behaviour ... 14
1.3.2 Toughening mechanisms ... 16
1.3.3 Crack interface bridging ... 17
1.3.4 Characterization of the cracking process... 18
1.3.5 Size of fracture process zone ... 19
1.4 Effect of aggregate size on fracture behaviour ... 20
1.4.1 Effect on microcracking characteristics ... 21
1.4.2 Effect on brittleness and fracture energy ... 22
1.5 Size effect on strength of concrete structures... 22
1.5.1 Size effect theories... 23
1.5.2 Brittleness number ... 27
1.5.3 Size effect on fracture energy and softening curve... 28
1.5.4 Boundary effect on fracture properties... 29
Conclusion ... 33
2 CHAPTER : EXPERIMENTAL APPROACH TO CHARACTERIZE FRACTURE IN CONCRETE: THEORETICAL BACKGROUND AND METHODOLOGY... 35
2.1 Digital Image Correlation as a fracture measuring tool ... 36
2.1.1 Introduction ... 36
2.1.2 Principles of Planar Digital Image Correlation ... 37
2.1.3 Overview of DIC application in fracture measurements... 41
2.2 RILEM methods to determine material fracture parameters ... 42
2.2.1 Work of fracture method... 42
2.2.3 Size effect method ... 43
2.3 Experimental research ... 44
2.3.1 Materials ... 44
2.3.2 Specimen preparation... 45
2.3.3 Loading frame and mechanical measurement devices ... 47
2.3.4 Test control ... 48
2.3.5 Digital Image Correlation - experimental setup... 49
Conclusion ... 51
3 CHAPTER : EXPERIMENTAL INVESTIGATION OF CRACK OPENING IN CONCRETE FRACTURE... 53
3.1 Mechanical response of the concrete beams in terms of global variables... 55
3.1.1 M1 concrete beams ... 55
3.2 Digital Image Correlation : Determination of crack characteristics & validation... 57
3.2.1 Displacement and strain fields... 57
3.2.2 Determination of crack opening displacement ... 59
3.2.3 Description of the crack opening profile ... 61
3.3 Digital Image Correlation : Results & characterization of the fracture behaviour ... 63
3.3.1 Crack opening in the elastic phase... 63
3.3.2 Crack opening profile near the peak load... 64
3.3.3 Crack opening profile in post peak ... 66
3.3.4 Measurement of crack length from crack opening data ... 67
3.3.5 Crack bridging effect and tail softening ... 69
3.3.6 Aggregate interlock and softening... 70
3.4 Influence of aggregate size on the fracture behaviour ... 72
3.4.1 Influence on the mechanical behaviour ... 72
3.4.2 Influence on the crack length evolution ... 73
3.5 Size effect on the mechanical behaviour ... 73
3.5.1 Analysis of size effect according to RILEM size effect method... 75
3.5.1.1 Determination of fracture parameters... 75
3.5.1.2 Analysis of size effect on peak load based on Bazant size effect law... 78
3.6 Size effect on crack opening... 80
3.6.1 Size effect on crack initiation ... 80
3.6.2 Size effect on crack opening profile at peak load ... 81
3.6.3 Size effect on crack length ... 82
3.7.1.1 Design crack opening... 83
3.7.1.2 Maximum final crack spacing ... 84
3.7.1.3 Analysis of test data ... 85
3.7.2 Size effect on crack opening in RC structures... 85
3.7.3 Experimental program ... 86
3.7.3.1 Materials... 86
3.7.3.2 Beams geometry... 86
3.7.3.3 Test procedure ... 88
3.7.4 Results and discussions... 90
Conclusion ... 93
4 CHAPTER : MODELLING OF SIZE EFFECT AND CRACK OPENING PROFILES: COMPARISON WITH THE EXPERIMENTAL RESULTS... 95
4.1 Fundamentals of crack propagation... 97
4.1.1 Linear elastic crack... 97
4.1.2 Critical crack tip opening displacement ... 98
4.1.3 Fracture energy dissipation in a quasi-brittle crack... 100
4.1.4 Fictitious crack model ... 101
4.2 Damage Mechanics and Smeared crack concept... 102
4.2.1 Crack band Model ... 102
4.2.2 Continuum damage modelling of concrete ... 104
4.2.2.1 Mazars damage model ... 104
4.2.2.2 Influence of model parameters ... 107
4.2.2.3 Nonlocal continuum damage ... 108
4.3 1D bar: Numerical investigations ... 110
4.3.1 Mesh discretization... 110
4.3.2 Material parameters ... 110
4.3.3 Local calculation... 111
4.3.4 Nonlocal calculation... 112
4.3.5 Calculation of crack opening... 114
4.4 Three point bending test... 116
4.4.1 Mesh discretization... 116
4.4.2 Boundary conditions ... 117
4.4.3 Determination of the nonlocal damage model parameters... 118
4.4.4 Size effect and computation of global fracture parameters... 122
4.4.5 Evolution of the damage variable ... 124
4.4.6 Estimation of crack opening and comparison with experiments ... 124
4.4.7 Influence of characteristic length on the crack opening profile ... 125
Conclusion ... 127
GENERAL CONCLUSIONS...129
PERSPECTIVES ...133
GENERAL INTRODUCTION
Cracks are everywhere around us. Any quasi-brittle material like concrete is generally full of cracks. Throughout the decades, humans have been trying to understand the mechanism of the growth of cracks. In particular, after the pioneering work of Griffith on the quasi-brittle growth of cracks, much research has been directed towards a better and deeper understanding of this observed phenomenon.
It is known that the mechanical behaviour of quasi-brittle composites such as concrete, coarse grained ceramics and fibre-reinforced composites, is manifested by mechanisms like strain localization and progressive fracture in the material. The fracture is usually in the form of multiple cracks branching out in the zone where strains are localized. This is an intrinsic property of quasi-brittle materials and the Fracture Process Zone (FPZ) is generally considered as a characteristic parameter which is used to analyze the failure process. Due to the sizable FPZ in comparison with structure/specimen size, the linear elastic fracture mechanics (LEFM) laws cannot be applied.
Many theoretical techniques consider the size of FPZ as a material parameter. In these theories, the fracture process (or material degradation) is assumed to be accumulated in a certain length or width of FPZ at the crack tip. In this regard, the first attempt was made by Irwin [59], who identified the singularity of the (LEFM) stress-field at the crack tip and proposed the presence of a crack tip plastic
zone. Hillerborg [51] improved the Irwin model by replacing the crack tip plastic stress with
monotonic decreasing cohesive stress. He assumed that the energy dissipation during fracture process can be completely characterized by a cohesive stress-crack opening relationship. He regarded the fracture energy as a size/shape independent material property represented by the area under the entire softening stress-crack opening curve. Unlike Hillerborg, a distributed microcracking effect was
considered by Bazant and Oh [11]. They modelled the fracture process zone with a band of uniformly
distributed microcracks (or damage zone) which had a fixed width. In order to determine size/shape independent fracture energy, the damage band width was regarded as a material property (related to
the size of aggregates in concrete). Recently, however, Duan and co-workers [38] have proposed a
fracture model in which the fracture energy is subjected to boundary effects related to the crack length. Their model is based on the experimental observations that FPZ size is not constant as the crack reaches the boundary of the specimen/structure. Other researchers also consider that evolving
Size effect in concrete structures
The study of the fracture behaviour of concrete cannot be separated from the size effect. In these materials, a large sized FPZ is present which consumes a considerable amount of energy supplied by
the applied load. As a consequence, a decrease of nominal strength σN can be observed with the
increase in size. Considering any type of geometrically similar specimens or structures of various sizes, with geometrically similar cracks, the variation of structural strength can be described by
plotting the logarithm of the nominal stress σN versus the logarithm of their size (Figure 0.1).
Figure 0.1 Transitional scaling of nominal strength of quasi-brittle structures [10].
On one hand, the strength criterion predicts σN at failure to be independent of size, while all tests
indicate a decrease of σN when the size increases. On the other hand and according to the LEFM, σN is
proportional to (size)-1/2. This slope, however, appears to be too steep in comparison with the
experimental data. The reality seems to be a gradual transition from the horizontal straight line for the strength criterion, to the inclined straight line of slope – ½ for LEFM.
Scope of the thesis
In order to test the robustness of the different numerical models used to predict the mechanical behaviour, fracture behaviour and the size effect, one needs to use experimental data on nominal strength but also on crack openings and crack lengths. Nevertheless, crack openings and crack lengths are very difficult to measure. Different techniques have been introduced in the past e.g. LVDTs, dye
penetration method, acoustic emissions and interferometry [91] but they do not usually provide
accurate measurements. Other techniques are able to produce precise crack openings and lengths but are not accessible to everyone and present many limitations to their application (e.g. microtomography
Log (Nominal strength)
Real Structures Laboratory beams LEFM Strength criteria Log (Size)
In this thesis, a large scale experimental campaign on geometrically similar concrete specimens has been conducted. In order to measure crack openings and crack lengths on the surface of the specimens the Digital Image Correlation technique (DIC) has been adopted. It is a robust technique and provides fracture measurement of high precision.
The numerical models usually used to describe crack or damage growth in concrete can be divided into two categories: models based on a continuum damage approach and on a discrete crack approach. Models based on continuum mechanics are incapable of determining crack openings directly. Therefore, post treatment procedures have been developed to extract the crack profiles from a continuum strain field [80, 81]. Discrete crack models are based on an explicit description of the discontinuity within the material e.g. cohesive crack model of Hillerborg [51]. Generally, the entire energy that is dissipated in the FPZ is “converted” into a crack length. Some part of this energy may be dissipated in the process zone outside the crack, and it follows that the crack length and the crack opening are probably overestimated. Furthermore, global experimental results (e.g. load versus displacement) are often used in literature to calibrate the above models and therefore they predict the maximum load well but not predict crack profiles, openings and length at different loading stages accurately.
In this work we choose to work with a classical non local damage mechanics model calibrated with global parameters (crack mouth opening displacements, CMOD) coming from the experimental campaign coupled with an optimisation algorithm, in order to improve the representation of size effect. Validation is provided using global but also local results.
Outline of the thesis
The above problem is analysed in the present document in four chapters.
• The first chapter presents a literature review of different physical mechanisms involved in the
cracking process of concrete. The objective is to present state of the art developments and the tools to comprehend the problem. Finally, the basis of the principal physical theories, interpretations and experimental observations by different researchers, are discussed
• The second chapter is dedicated to the procedures, techniques and protocols adopted in the
experimental campaign. Digital Image Correlation technique (DIC) and its application as a fracture measuring tool are discussed. RILEM (Reunion Internationale des Laboratoires et Experts des Materiaux, Systemes de Construction et Ouvrages) recommended test methods to measure fracture parameters of concrete are presented briefly, including RILEM
recommendation of the size effect method. The merits and demerits of these methods are discussed. Details of the experimental campaign are then presented, including material aspects, specimen preparation, experimental setup and the loading system.
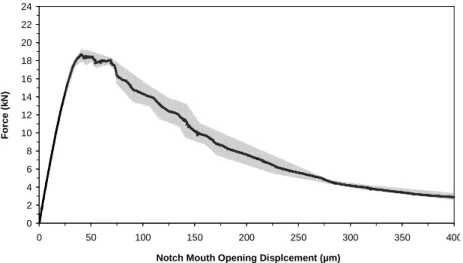
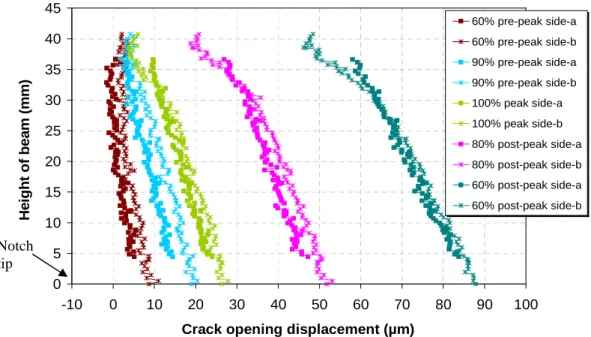
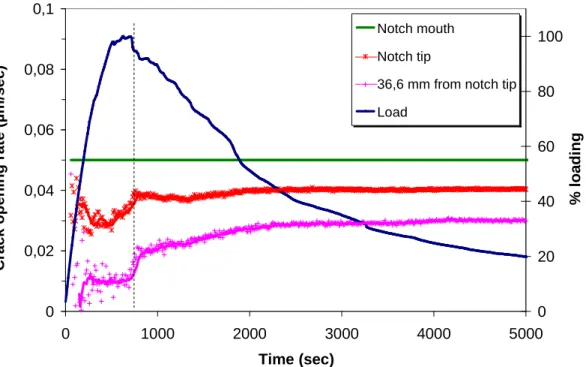
• In the third chapter, experimental results of three point bending tests on concrete beams are analysed in order to characterize the fracture process. Crack opening is used as a key parameter. Experimental data of loading and crack notch opening displacement are analyzed first. Then, an experimental method to measure the crack opening displacement and profile using DIC is presented. The fracture process is monitored and the effect of aggregate size on cracking is also studied. The size effect is also identified on the mechanical response and crack opening respectively. Lastly a case study is presented in which crack openings and crack spacing in reinforced concrete beams are monitored. The results are compared with the values obtained by Eurocode expressions.
• In the fourth chapter, the most frequently used numerical approaches to simulate crack
propagation are presented. Damage mechanics concepts for concrete structures are described in detail. Numerical simulations are then carried out using a nonlocal damage model. Validation is provided by comparing with the experimental results.
1
CHAPTER : Literature
Review on Cracking in
Concrete
Failure in concrete is usually accompanied by cracking. Concrete being a tension-weak material, the process of cracking is more critical under tensile loadings. It is often found in literature that concrete even cracks under its own weight.
Crack creation and its propagation are the results of physical processes that are generally explained using the laws of conservation of energy. In most of these theories, concrete is assumed as a homogenous material. However, the effect of the fabrication process and the constituents shape and size influence the cracking process. Crack usually initiates from the weakest link in the material. It develops under the action of stresses developed around it. The process involves phenomena from the very small scale (e.g. uneven distribution of calcium silica hydrates which is the main hydration component) to the very large scale (e.g. effect of structural dimensions, known as size effect).
This chapter presents a bibliographic review of different physical processes affecting the cracking mechanism in concrete.
• In the first section, the different possible scales of observation are discussed.
• The second section describes the microstructural properties of concrete that may influence the
fracture process.
• In the third section, a state of the art review on the fracture behaviour of concrete under the
action of tensile loadings is presented. Discussion is made on the basis of physical interpretations and experimental observations provided by different researchers.
• The effect of structural size on the fracture behaviour of concrete is presented in the last section. Bazant’s size effect theory is discussed in detail.
Chapter 1
Literature Review on
Cracking in Concrete
1.1
Morphology of concrete and different levels of observation
Concrete is generally considered as a continuum material in most numerical models. Nevertheless, its
material structure varies depending on the scale of observation. In Figure 1.1[55], it can be seen that
concrete is a multi-scale material. Cement, sand, aggregates, water and sometimes other additives are mixed together and hardened to form a solid structure.
• The smallest or elementary particle of concrete is the atomic form of the cement and aggregates,
which can be observed at nanometre scale (10-9 m).
• Then, the individual cement hydrated products are identified at micrometer scale (10-6 m). This
includes primarily calcium-silicate-hydrate (C-S-H), calcium-hydroxide (C-H) and calcium
sulfo-aluminates (ettringite, C3A.3CaSO4.32H2O). The complex pore structure becomes visible as well.
• In the next scale (10-3 m), also known as meso-scale, concrete is generally considered as a two phase material consisting of matrix and aggregates. Internal voids ranging up to several millimetres in size may be regarded as another important component of the hardened concrete. This void structure or defects depend on the packing of aggregate particles in the cement matrix. They mainly includes pores in the cement paste, cracks at the aggregate interface and shrinkage cracks. These defects play an important role in the mechanical behaviour of concrete.
• In the next scale (10-3 to 10+0 m), the laboratory scale (mechanical) experiments are carried out. No
internal structure is emphasized and the overall mechanical response is generally of importance. This scale is often called as macro-scale. In this scale and even in the larger scale (10+3 m and more), the material is assumed to have isotropic properties. At larger scales i.e. the scale of buildings and other civil engineering structures, the material is modelled as a continuum, or alternatively, some internal structure details can be identified, specifically when structure is formed by steel reinforcement.
Figure 1.1 Various scales of observation of concrete material from atomic structure to large scale
10-8 10-7 10-6 10-5 10-4 10-3 10-2 10-1 100 10+1 10+2 10+3 [m]
Crystal calcium silicate concrete laboratory structures structure hydrates particle stack scale
In material science of concrete structures, research is concentrated mainly into three levels of
observation, namely the micro-level, the meso-level and the macro-level [133] identified in the
previous paragraphs. Different mechanisms are occurring in the different scales. It is now understood that the mechanical behaviour depends on the fracture process. As concrete is a scale and multi-phase material, the fracture process occurs within the micro and the meso-scale. In the next section, a brief description of the microstructure properties of concrete that may influence the fracture process is presented below.
1.2
Microstructure of concrete
Based on different constituents, cementitious materials can be classified as paste, mortar or concrete. Paste is a mixture of cement and water. Mortar is a mixture of sand, cement and water. Concrete is composed of cement, sand, coarse aggregate and water. Other admixtures may be used to improve the properties of these constituents. In all these mixtures, cement acts as the binder material. It hydrates when mixed with water and forms a matrix. In the fluid form, this matrix fills the space between the aggregates and sand. After a certain period of curing, the cement matrix hardens and bonds together all constituents into the form of hardened concrete.
1.2.1 Microstructure of cement paste
Hydration products of cement primarily include C-S-H, C-H and ettringite. The C-S-H is a purely crystalline material, a principal hydration component that makes up about one-half to two-thirds of the volume of the hydrated paste. The C-S-H forms extremely small particles of size less than 1µm in any
dimension (Figure 1.2). The C-H is a crystalline material and occupies about 20 to 25% of the paste
volume. The C-H crystals have distinctive hexagonal prism morphology with typical crystal dimension ranging from 0.01 to 0.1mm. Ettringite usually crystallizes as long, slender prismatic needles, typically of 10 x 0.5µm, in the cement paste and makes up approximately 10 to15% by volume of the cement paste.
Porosity is another major component of the microstructure of the hardened cement paste. It is usually classified as gel porosity and capillary porosity. Gel porosity, ranging approximately from 0.5 to 10nm in size, can be regarded as part of the C-S-H, whereas the capillary porosity varying from 0.01 to 10µm in size can be seen as remnants of water filled spaces that exist between the partially hydrated cement grains. The volume of porosity decreases during hydration.
Figure 1.2 Electron microscopic images of (a) foil-like Calcium Silicate Hydrates, C-S-H and fine
bundles of C-S-H fibres (b) c) Ettringite needles and plate-like C-H morphology (from [124]).
In the different models proposed in the literature to describe concrete microstructure, the C-S-H needles are of major importance. Many researchers believe that concrete structure is damaged during Scanning Electron Microscopy (SEM) preparation. Therefore, several of the structural models of the hardened cement paste are not directly derived from SEM observation only, but from other chemical and physical analysis techniques as well. Among several structural models proposed in the past, the
best known are the models of Powers [101], Feldman [41] and Wittmann [133].
1.2.2Aggregates, properties and particle distribution
Aggregates are generally about 75% of the total volume of concrete and therefore control many of its properties. Natural aggregates like limestone, quartz, basalt, granite etc are mostly in use. In addition to the natural aggregates, alternative materials can be also used, e.g. blast furnace slag, fly-ash, river gravel or lightweight by-products from industrial processes. The mechanical and other properties of these aggregates differ from those of natural aggregates e.g. density, water absorption and particle strength. The densities of such materials are very low due to high porosity, which has a significant effect on the flow of water at the matrix aggregate interface. Therefore, one must take care that a relevant correction of water cement ratio is made.
For a high strength concrete, aggregates like basalt or good quality limestone are recommended. In this case, balanced aggregate grading is very important in order to reduce the porosity of the material. Usually the different model codes contain detailed description of the aggregates grading that must be used in practice. Well graded aggregates not only decrease the porosity of concrete, but also have a significant effect on the amount of water in order to obtain certain workability. More water is absorbed
texture have also an important effect on the workability. Round, smooth aggregates generally give an improved workability.
Until now it has been assumed that in a concrete volume, the cement and aggregate particles are uniformly distributed. However, this may not be true, as concrete is generally cast in moulds and wall effects appear near the mould-concrete interface. Two types of such effects are generally observed. Firstly, the microstructural gradients appear at the casting surface where water is free to evaporate from the concrete [69]. Secondly, wall effect causes a rather different size distribution of aggregate particles in the part of concrete that are in contact with the mould. Many small particles fill the space between the larger aggregates and the mould. Usually the skin is also rich in cement content.
1.2.3Interfacial properties between aggregates and cement paste
In most cases, concrete is considered as a two-phase material consisting of a cement paste matrix and aggregates. These two constituents are bonded together at the interface. For normal concrete, this interface is generally considered as the weakest link in the material; however, for concrete containing alternative aggregates or improved cement matrices, the interface might have different properties.
The strength of the interfacial transitional zone between cement matrix and aggregates has a significant effect on the global strength of concrete. Since bleeding or segregation normally occurs for fresh concrete, some cracks form at the interface between the matrix and the aggregates when the concrete is hardened. On the other hand, since the matrix and aggregates have different modulus of elasticity, thermal coefficients and response to change of moisture content, the interfacial transition zone between the matrix and the aggregates often has more voids and is weaker than the bulk cement matrix.
A structural model of the cement matrix-aggregate (rounded river gravel) interface is shown in Figure
1.3. The model is generally accepted and is based on the research carried out in [35, 79, 90]. It is assumed that a layer of C-H precipitates at the physical boundary between aggregates and cement matrix. It follows a layer containing C-H crystals, ettringite and C-S-H. This so called intermediate layer or interfacial transition zone has very high porosity and its thickness varies from 20 to 60µm for the concrete containing river gravels. A closer observation of the fracture surfaces has shown that fracture occurs not directly at the physical boundary but at the intermediate layer or the porous interfacial transition zone [136]. Using SEM in combination with image processing techniques, it is revealed that the weak transitional zone is due to an increased porosity close to aggregate surface and
Figure 1.3 Structure of interfacial transition zone between rounded, dense, natural aggregate and
Portland cement matrix (from [124]).
1.3
Fracture behaviour of concrete in tension
Failure of concrete is usually caused by the loss of material strength due to crack growth associated with microcracking. Concrete microstructure is very complex as the density, porosity and mechanical properties are not identical at each point within the sample, which induce stress concentrations when subjected to mechanical loadings. Microcracks start to develop from the weakest points or defects in the material structure. They make concrete highly weak in tension and its tensile strength approximately ranges from 8 to 15 % of its compressive strength. Various characteristics of cracking in concrete under tensile loadings are explained below.
1.3.1Strain localization and softening behaviour
When concrete is subjected to tensile loading, strains are quickly localized in the weaker areas of the
specimen. Li and co-workers [74, 75] examined a notch-less concrete plate under uni-axial tension
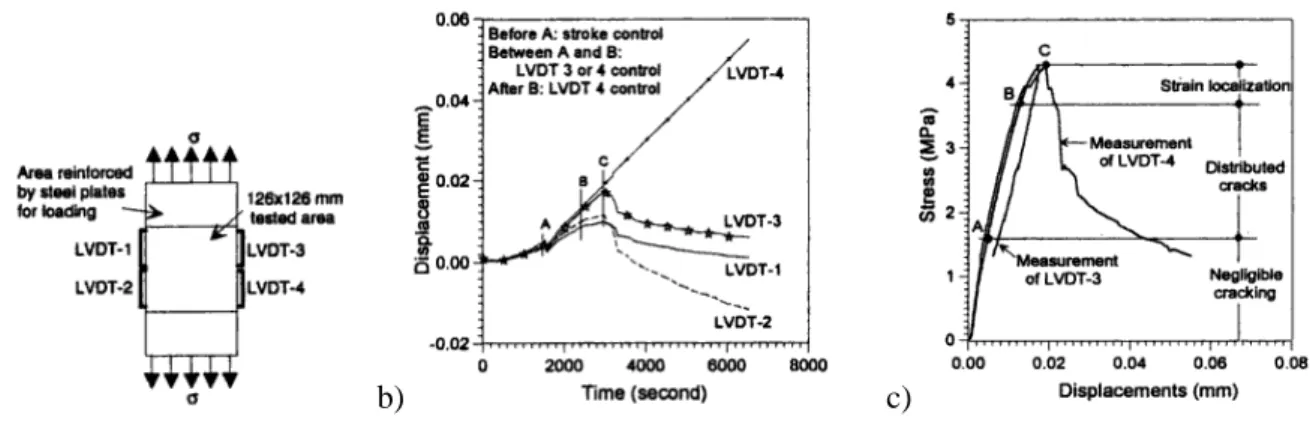
(Figure 1.4). It can be seen that prior to point A, the specimen behaves elastically and the displacements measured from the four LVDTs are essentially the same and they increase linearly with the loading. For higher values of loading, the stress displacement relationship is no longer linear. After the peak load (point C), displacements from the three LVDTs decrease, while the displacement recorded by LVDT-4 continuously increases and the corresponding load decreases gradually
(softening behaviour), (Figure 1.4(c)). Acoustic emission (AE) measurements indicate the initiation of
internal cracks at point A which are uniformly distributed up to point B. After that point, the development of a narrow band of microcracks is detected near LVDT-4, indicating the onset of damage localization.
a) b) c)
Figure 1.4 Concrete plate subjected to tension: (a) specimen geometry and arrangements of LVDTs, (b) relationships between displacements and time (c) stress-displacement relationship for four LVDTs
(from [75]).
Other experiments [74, 75, 122, 125, 102] have shown that at the peak of the stress-deformation
diagram, a macrocrack zone starts to develop and slowly transverses the whole cross-section of the specimen. In the post-peak regime, the residual load carrying capacity decreases with the propagation of the macrocrack. However, some residual carrying capacity remains, caused by toughening
mechanisms as remnants of the non-uniform crack process (see Section 1.3.2 and 1.3.3).
In laboratory experiments, as the specimen has a finite size, such a load drop is observed and can be measured. For the case of a crack in an infinitely large plate subjected to far-field tension perpendicular to the crack, it is highly unlikely that softening would occur [127]. This is perhaps a theoretical case, but most classical fracture mechanics theories have been derived for cracks in infinitely plates. The use of finite dimensions leads to the introduction of a geometrical factor, which emphasizes the structural aspect of softening. Therefore, another school of thought is that softening is not a material property, but rather the outcome of a specific structure under certain boundary
conditions loaded beyond its maximum carrying capacity [127].
In summary, tensile softening comprises of three distinct mechanisms: (1) the growth of microcracks that rapidly coalesce to a macrocrack (2) the progress of the macrocrack that gradually decreases the load carrying capacity of the specimen (3) toughening mechanisms that emanate due to the heterogeneous material structure and the randomly distributed material weaknesses.
The onset of localization is an important point in the fracture process. In different articles, localization is reported to occur at peak strength or just before the peak load [25, 102]. Both Cedolin and
co-workers [25] and Raiss and co-workers [102] adopted Moiré interferometry methods that allow for measuring the full-field strain distribution at the specimen surface. The experiments using AE
techniques [70, 75, 94] have shown that AE events corresponding to damage localization begin to
form well before the peak load (about 70 to 80 % of the peak load). Even at 30% of the peak load in the pre-peak regime, AE events are detected ahead of the notch.
1.3.2Toughening mechanisms
Beyond the elastic range, strains localize into a zone known as the fracture process zone (FPZ) and are
responsible for the softening behaviour (Figure 1.4). Different local toughening mechanisms occur in
the fracture process zone:
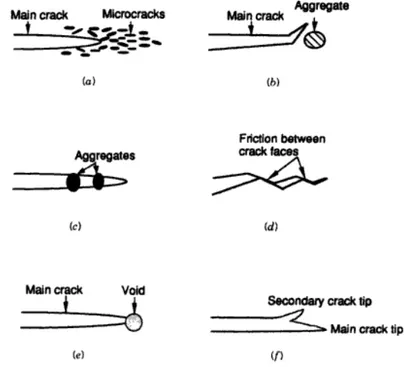
• During fracture, the high-stress state near the crack tip causes microcracking at the weakest links.
Such links result from water filled pores, air voids created during casting and shrinkage cracks due
to the curing process. This phenomenon is known as microcrack shielding (Figure 1.5(a)) and
consumes a part of the external energy received by the applied load.
• Crack deflection occurs when the path of least resistance is around a relatively strong aggregate
particle or along a weak interface between cement matrix and aggregate (Figure 1.5(b)).
• Another important toughening process is crack interface bridging as shown in Figure 1.5(c). It
occurs when the crack advances beyond an aggregate that continues to transmit stresses across the crack until it ruptures or is pulled out.
• Furthermore, during grain pullout or opening of a tortuous crack, there may be some contact or
interlock between the cracked surfaces (Figure 1.5(d)). This causes energy dissipation through friction and crack interface bridging across the crack.
• It has been reported that crack tip is sometimes arrested by internal voids, which produces a blunt
tip. This is called crack tip blunting by voids and is shown in Figure 1.5(e). Additional energy is
required to propagate the crack with a new blunt tip.
• The final mechanism is crack branching (Figure 1.6(f)). The crack may propagate into several
branches due to heterogeneity of concrete. More energy should be consumed to form new crack branches.
.
Figure 1.5 Toughening mechanisms in fracture process zone (a) crack shielding (b) crack deflection (c) crack or aggregate bridging (d) crack interlock sue to surface roughness (e) crack tip blunted by
void (f) crack branching (from [114]).
The crack interface bridging is presented in detail hereafter.
1.3.3Crack interface bridging
Van Mier [124] found that cracks in concrete are not continuous, but rather branch and overlap. This
type of overlap is called crack interface bridging. Essentially the two crack surfaces are connected by a ligament between the overlapping crack tips, thus allowing for stress transfer between the crack surfaces. The overlap would fail if one of the crack tips propagates and coalesces in the wake of the
second crack (Figure 1.6). Using microscopy studies it is found that the ligament between two
overlapping crack tips fails gradually. This process is generally responsible for the tail of the softening diagram in the deformation controlled tension experiment. The mechanism is studied in detail for
hardened cement paste in [126].
1.3.4Characterization of the cracking process
Crack growth associated with microcracking is an important phenomenon for fracture or damage analysis and for the development of appropriate constitutive models for concrete. It varies with the size, distribution and type of the constituent materials and involves cracking at different scales (Section 1.1) [124]. It consists of main cracks with branches, secondary cracks and a micro fracture process zone ahead of the main cracks.
Mindess [91] used more than a dozen techniques to study the true mechanism taking place during
tensile cracking. The estimation of crack size and the size of FPZ is varied according to the sensitivity of the measurement technique. He proposed that in fracture mechanics of concrete any crack with a
width over 6µm should be termed macrocrack. Mihashi [86] considered that around the branches of
the main crack there are closed microcracks (Figure 1.7) while opening microcracks exist in front of
them. Another concept published by Hu and Wittmann [57] is shown in Figure 1.8. They separated an
inner macrocracking zone from the isolated microcracking zone.
Figure 1.7 Concept of fracture process zone-1 (from [86]).
Figure 1.8 Concept of fracture process zone-2 (from [57]).
observation (Section 1.1). Thus it can be assumed that microcracks can be stopped in local stress fluctuations caused by specific material structural elements like aggregates and pores; however, macrocracks are more energetic and cannot be arrested in these local stress fluctuations.
In a series of vacuum impregnation experiments and optical microscopy tests, the internal crack
growth is monitored in notched concrete specimens subjected to uni-axial tension [125, 123].
However, this technique is limited to the detection of continuous macrocracks in contact with the outer surface of the specimen. The authors have found that cracks extend from the surface of the specimens into the interior, but do not connect. Cracking in the form of distributed microcracks occur near the vicinity of the notch at lower load levels, an indication of the existence of a microcracking zone before the macrocrack starts to propagate. The macrocrack extends way through the specimen but an intact core seems to remain. This internal core may contain distributed microcracks that cannot be detected with impregnation technique. At a load drop 60 to 70% of the peak load, around 80% of the cross-sectional area is cracked.
The observations from these experiments reveal the false assumption made in the continuum damage models which predict that at final stage, the full cross section of the specimen is cracked and load cannot be transferred. The fact is that at 100% cracked area, the specimen can still carry a certain load
(e.g. 0.2 σpeak for a concrete of maximum aggregate size of 16mm [123]). This clearly shows that other
mechanisms are active allowing the stress transfer between the crack faces.
1.3.5Size of fracture process zone
Both experimental and theoretical studies have shown that fracture process zone has to have a certain width and length to allow for the various toughening mechanisms [55, 124]. Its size relative to the structure size is of fundamental importance and is used as the basic assumption in the development of most numerical models. The width of the FPZ and its length ahead of the propagating macrocrack are generally assumed constant and are considered as material properties.
Otsuka [94] performed an experimental campaign using concrete specimens of different dimensions
and aggregate sizes. Using X-ray and acoustic emission techniques he found that the width of FPZ
increases with an increasing maximum aggregate size (da), however its length decreases (Figure
1.9(a)). However, in his paper the FPZ is considered as the whole zone ahead of the notch in which cumulative AE events are detected. This could be questionable, as FPZ should be measured ahead of the actual crack tip. The detection of the crack tip position is not doubt difficult but it can be measured using optical techniques [91].
(a) (b)
Figure 1.9 Comparison of fracture process zone obtained with AE technique (from [94]) (a) Influence of aggregate size (mm), (b) Influence of specimen size.
It is also detected that the width of FPZ varies with the crack length relative to the specimen dimension. This effect is called as the boundary effect on the FPZ. Studies have shown that FPZ width decreases dramatically when FPZ approaches the back face of a notched concrete specimen. Hu and Wittmann performed a saw-cutting experiment on mortar and showed that the development of FPZ in
a wedge splitting specimen is severely limited when specimen size or ligament length is reduced [57,
55]. When the ligament length (= specimen length - crack length) is small, the specimen dimension
along the direction of the crack propagation can be divided into inner and outer regions. In the inner region, the growth of fracture process zone is not affected by the boundaries of the specimen and its size can be assumed as constant. When the crack reaches the outer region, the fracture process zone
decreases due to the boundary influence [38].
1.4
Effect of aggregate size on fracture behaviour
The use of larger size of aggregates has long been considered a fundamental basis for an economic concrete mixture design. The reason behind this long accepted concept is straightforward. Concrete
made with larger sizes of aggregates requires less mixing water [129]. The well established and almost
universally accepted “water-cement ratio law” says that there should be an increase in strength consistent with the reduced amount of water.
Nevertheless, tests have shown that the size of coarse aggregates exerts an influence on concrete strength independently of the water cement ratio. For a given water cement ratio, strength increases as the maximum size of coarse aggregates is reduced. It seems probable that a point likely to be reached beyond which there is no strength advantage in using smaller sizes of aggregates and if size is further
1.4.1 Effect on microcracking characteristics
Characteristics of microcracks are dependent on the degree of heterogeneity in the material. Fine-grained materials show different micro fracture characteristics than coarse Fine-grained materials. Landis
and Shah [70] characterized microcracks according to their fracture mode. The fine grained materials
show primarily a mixed-mode micro-fracture, whereas the coarse grained materials show a mode-II (shear) micro fracture.
A relationship between the microcracking characteristics and the overall fracture toughness of the
material is established through quantitative AE analysis [70]. The AE source locations in the coarse
mortar specimen shows significantly more scatter than the fine mortar, indicating a larger damage zone. The coarse mortar has a higher overall toughness, attesting to the fact that diffused damage leads to greater energy absorption capacity.
The enhancement of fracture properties of concrete due to large aggregate particles can be explained
by microcrack shielding and crack bridging (see Section 1.3.2), which cause the reduction of stress in
the FPZ. Also, the interlocking of the particles between the crack surfaces consumes energy and thus
enhances the fracture resistance [135]. For smaller da especially in the mortar, the fracture surface is
smooth. For higher da, surface becomes rough and complex, and also some coarse aggregates are
found snapped [2, 135]. As crack meets an aggregate particle, it is forced either to propagate through
the tougher aggregate or to deflect and travel around the aggregate-mortar interface. Since the interface toughness is usually lower than the matrix, the advancing crack tip is prone to deflect the aggregate, resulting in a tortuous cracking path and needs more energy. Thus, larger the size of aggregates is, the more tortuous cracking path would be and higher energy will be required to overcome the interfacial bond.
The potential of the fractal geometry as means of describing the scaling of surface roughness has been
explored by many researchers [8, 78]. Mandelbrot and co-workers [78] were the first to suggest a link
between fractal dimension of fracture surface and fracture toughness. Since the roughness of the cracked surface may play the important role of the intrinsic parameter at the microstructure level, the roughness of the fractured surface and the fractal theory have been used to quantitatively characterize
the coarseness of internal structure of concrete. It has been proven experimentally [119, 94, 27] that
the size of the FPZ in concrete increases with increasing average aggregate size. From this point of view, the coarseness of grain structure of concrete should be considered as one of the dominant parameters affecting the size of the FPZ.
1.4.2 Effect on brittleness and fracture energy
When FPZ is small, the failure pattern is more brittle and towards the region of LEFM, which is manifested as the shift to the right side on the size effect plot (see Figure 1.11). Such shift was
obtained in the study of Chang and co-workers [26] and Amparano and co-workers [2]. In their studies
the size of the aggregates and their volume fraction are the experimental parameters respectively. In
the study of Chang and co-workers [26] the test data for concrete with large aggregate (and thus coarse
internal structure) falls in the transition zone between LEFM and the strength criterion; while the test data of cement pastes with small aggregates (and thus fine internal structure) shifts to the right. From a LEFM point of view, this means that a cement paste is more brittle than concrete, and can be characterized by LEFM.
The fracture parameters also depend on the aggregate size. It was shown that both fracture toughness and fracture energyincrease with an increase of the maximum aggregate size, with a fixed value of aggregate content [27]. Kleinschrodt and Winkler [67] reported that the influence of da is probably
insensitive to fracture energy while Mihashi and co-workers [88] showed that the influence is
significant. As the aggregate size became larger, the values of fracture energy and AE hits significantly increased.
The volume content of aggregates (Vagg)is also an important parameter. Higher volume fraction of
aggregates leads to a finer grain structure, and thus to a small size FPZ [2]. The article concludes that
the fracture properties of concrete depend strongly on the total aggregate content. The fracture energy exhibits variations in the range of 25%: fracture energy decreases with an increasing aggregate content
and reaches a minimum value by Vagg = 65%, then starts to increase (but there is no such critical
volume fraction which gives maximum Gf). The size of the FPZ decreases with increasing content of
aggregates, something that can be explained by the change of coarseness of grain structure defined in
terms of mosaic patterns [2]. The nominal strength of concrete beams shifts from the left to the right in
the size effect curve with an increasing volume fraction of aggregates. In other words, the failure mechanisms of the concrete used in the study shift toward the region of linear elastic fracture mechanics.
1.5
Size effect on strength of concrete structures
Size effect is the change of response of a material due to geometrical changes in the dimensions of the structure. In solid mechanics, the scaling problem of main interest is the effect of size of the structure
complex. These are materials incapable of plastic yielding, failing due to fracture characterized by a large FPZ that undergo distributed strain-softening in the form of micro-cracking and fractional slip. The mechanism of size effect is mainly deterministic, involving stress redistribution and the release of stored energy engendered by a large fracture or a large FPZ.
Experimental results have indicated that the strength of concrete usually decreases with increasing size of structures. The size effect on concrete may be primarily explained by the FPZ. When a concrete structure is loaded, the strain energy produced by the applied load is converted to the energy consumed to create a new fracture surface and the energy absorbed in the FPZ (due to toughening mechanisms). For large-size structures that have long ligament lengths on crack sections, the latter is negligible compared to the former, whereas for small size structures the latter can be of the same magnitude as the former. Therefore, the larger the structure’s size, the lower the nominal strength. However, the concrete strength approaches a constant when the size of the structure becomes very large [10].
1.5.1Size effect theories
In concrete structures, size effect theories are mainly divided into three categories:
• Statistical theory of random strength [131].
• Theory of crack fractality [24].
• Deterministic or energetic size effect [7].
Statistical theory of random strength
The statistical theory of size effect began to emerge after Peirce [96] formulated the weakest-link
model for a chain and introduced the extreme value statistics originated by Tippett [120], Fréchet [44]
and Fisher and Tippett [43]. The capstone of the statistical theory of strength was laid by Weibull
[131]. A three dimensional continuous generalization of the weakest link model for the failure of a
chain of links of random strength leads to the distribution [131]:
[
]
− − =∫
V N N f c x dV x P (σ
) 1 expσ
( ),σ
( ) (1.1)which represents the probability Pf that a structure fails as soon as a macroscopic fracture initiates
from a microcrack (or flaw) somewhere in the structure; σ = stress tensor field induced by the load
that corresponds to the nominal strength σN, x = coordinate vector, V = volume of structure and c(σ) =
Applications of Weibull’s theory to fatigue embrittled metals and to ceramics have been researched thoroughly. Applications to concrete, where the size effect has been of the greatest concern, have been studied by Mihashi and Izumi [87], Mihashi [85], Wittmann and Zaitsev [134], Carpinteri [23] and others. Based on some serious limitations e.g. absence of material characteristic length, no information on structural geometry, negligence of spatial correlations of material failure probabilities of neighbouring elements caused by non local properties of the damage evolution, the theory appears
applicable to some extremely thick plain (unreinforced) structures [14].
Theory of crack fractality
Observations have shown that the fracture surfaces in concrete exhibit partly fractal characteristics. Recent advances in the study of the fractal aspects of crack morphology and energy dissipation by fractal cracks have shown a correlation between the fractal dimension of the crack surface and the fracture energy of concrete materials. In [24] a size effect theory is proposed called multi fractal scaling law (MFSL) showing that a fractal nature can be the physical origin of the size effects observed on the concrete structures. For failures occurring at fracture initiation from a smooth surface, the scaling law reads:
D
A
A
N 2 1+
=
σ
(1.2)Where A1, A2 = constants depending upon the fractal nature of the crack.
There are, however, few objects to the fractal theory [9]:
• A mechanical analysis of fractal nature of cracks predicts a different size effect than Equation 1.2.
• The fractality of the final fracture surface should not matter, because typically a major amount of
energy is dissipated by microcracks and fractional slips on the sides of this surface.
• The fractal theory does not predict how A1and A2 should depend on the geometry of the structure.
Deterministic or energetic size effect
Application of LEFM to concrete was first considered by Kaplan [63] but subsequent test results
showed significant disagreements [66, 72, 130]. Leicester [72] conducted tests of geometrically
similar notched beams of different sizes, fitted the results by a power-type size effect, and observed
propagate, and because the singular stress field of notches of a finite angle gives a zero energy flux into the notch tip. Besides, Leicester's power law for size effect implied nonexistence of a characteristic length. Based on more extensive tests of geometrically similar notched beams of different sizes, Walsh [130] was the first to make the doubly logarithmic plot of nominal strength versus size and note that it appears to be transitional between plasticity and LEFM, although he did not attempt to make a mathematical analysis and obtain a formula.
A different type of quasi-brittle size effect was brought to light by Hillerborg and co-workers [51] who
extended the models of Barenblatt [4] and Dugdale [39] to formulate the cohesive (or fictitious) crack
model for concrete characterized by a softening stress-crack opening law. Using finite element analysis, they showed that the failures of plain concrete beams exhibit a deterministic size effect, which agrees with the test data on the maximum peak load obtained from Brazilian tests.
Bazant’s size effect law
In 1976 it was analytically demonstrated that localization of strains engenders a size effect on post-peak deflections and energy dissipation of structures [6]. Inspired from the work of Hillerborg [51]
and using the energy release rate concept, Bazant [7] derived a size effect law which describes the size
effect on nominal strength of quasi-brittle structures containing notches or traction-free (fatigued) large cracks that have formed in a stable manner. Measurement of the size effect on the maximum load of notched specimens are shown to provide simple means for determining the fracture energy and
effective length of the FPZ and are embodied in a standard RILEM Recommendations [107].
According to Bazant’s size effect law, introduction of a crack with a FPZ of fixed width h at peak load causes the release of strain energy from the shaded triangles on the flanks of the crack band shown in
Figure 1.10. The slope k of the effective boundary of the stress-relief zone is considered independent of the size D of the specimen. The length of the crack at maximum load, called hereafter a, is assumed proportional to D, while the width h of the FPZ is essentially a constant, related to the in-homogeneity size in the material. Subsequently, using an approximate energy release analysis, the following approximate size effect law is derived [7] for the quasi-brittle size effect in structures failing after large stable crack growth:
2 1 0 ' 1 − + = D D Bft N
σ
(1.3)Where σN = nominal strength; D = characteristic size of the structure; B and D0 = parameters
Figure 1.10 Zones of stress relief according Bazant’s size effect law (from [7]).
It is important to note that according to Bazant’s size effect law, stress reduction in the triangular
zones of area ka2/2 (Figure. 1.10) causes an energy release Ua = 2(ka
2
/2)σN 2
/2E (E being the Young’s
modulus). The stress drop within the crack band of width h causes further energy release Ub =
haσN 2
/2E. The total energy dissipated by fracture is W = aGf , where Gf is the fracture energy, a
material property representing the energy dissipated per unit fracture length. Energy balance during
static failure requires that ∂(Ua+Ub)/∂a = dW / da. Setting a = D(a/D), where a/D assumed constant for
structures with geometrically similar sizes, the solution of the last equation for σN yields Bazant’s
approximate size effect law (Equation 1.3).
Figure 1.11 Transitional scaling of quasi brittle structures (from [14]).
More rigorous derivations of this law, applicable to arbitrary structure geometries, have been given in
terms of asymptotic analysis based on equivalent LEFM [14]. The application of Bazant’s size effect
Bazant’s size effect law
D0 Log (size)
among which the earliest is found in the famous Walsh's tests of notched concrete beams [130]. For very large sizes (D >> D0), the size effect law (Equation 1.3) reduces to the power law
2 / 1 − D N
α
σ
,which represents the size effect of LEFM (for geometrically similar large cracks) and corresponds to the inclined asymptote of slope -1/2 in Figure 1.11. For very small sizes (D << D0), this law reduces to
σN = constant, which corresponds to the horizontal asymptote and means that there is no size effect, as
in plastic limit analysis.
1.5.2 Brittleness number
Brittleness number is defined as the non-dimensional characteristic that indicates whether the behaviour of a given specimen or structure is closer to a strength limit analysis or to LEFM. The
relative structure size λ = D/da cannot serve as an objective indicator of this behaviour. Bazant and
co-workers [12] proposed that an objective indicator can be the brittleness number defined as:
a d D 0
λ
β
= (1.4)The value of β = 1 indicates that the specimen is at the centre of the transition between the two elementary failure criteria i.e. the point where the horizontal asymptote for the strength criterion intersects the inclined straight line asymptote of the LEFM criterion. For β ≤ 0.1, the plastic limit analysis can be used as an approximation and for β ≥ 10, linear elastic fracture mechanics may be used as an approximation.
λ0 represents the value D / da for β = 1 and can be calculated by finding the structural strength σN
simultaneously using a plastic limit analysis and LEFM analysis. By equating both equations for σN,
Bazant obtained the following expression for the transition value D0 of the characteristic dimension D
of the structure at the transitional point (see Figure 1.11).
a f t f d D g B f E G D 0 0 0 2 2 ' 0 , ) ( = =
α
λ
(1.5) Therefore, E G D f g B f t f 2 ' 0 2 ) (α
β
= (1.6)Where
α
0= relative crack length at the transition point = a0 / D0; gf (α
0) = non-dimensional energyrelease rate calculated according to LEFM; Gf is the fracture energy corresponding to of an infinitely
large specimen (under the condition that failure of an infinitely large specimen must follow linear elastic fracture mechanics).
1.5.3 Size effect on fracture energy and softening curve
Many numerical models can be found in literature to calculate fracture energy as a material property. Three of these models have been adopted by RILEM to determine experimentally the fracture energy: the Fictitious crack model [51], the Two parameter model [61] and the Size effect Model [7]. The
details of the RILEM methods are presented in Section 2.2.
In the Fictitious crack model, the fracture energy for a specimen of height D and an initial notch (or crack) length a is calculated as the area under the tensile softening or cohesive stress-crack opening (σ~w) diagram. This definition of fracture energy would lead to different values if the ligament
length/size ((D-a)/D) ratio is varied. This variation has been reported widely in the literature [38, 37,
36]. Van Mier [127] argued that a gradual post-peak load drop (or softening curve) is generally
observed when testing specimens of finite dimensions, but is highly unlikely to happen for cracks in infinite plates (where material behaviour is brittle and follows LEFM law). Therefore, the softening or cohesive stress-crack opening (σ~w) diagram should be considered as an outcome of loading of a specific structure under specific boundary conditions.
The size effect law proposed by Bazant [7] is based on the assumption that the FPZ size and fracture
energy are independent of the structural size and geometry. Bazant assumed that the FPZ size is not negligible and for laboratory-size fracture specimens, the fracture process zone is of the same order of magnitude as the specimen size. Furthermore, he assumed that due to the limited plasticity of concrete under tensile loadings, the hardening nonlinear zone surrounding the fracture process zone is rather small and the boundary of this nonlinear zone lies very close to the boundary of the fracture process zone. Therefore, and in order to isolate the boundary effects, an extrapolation to an infinite specimen size is made and thus the fracture process zone becomes infinitely small compared to the specimen. Under this condition the failure of an infinitely large specimen can be modelled with a linear elastic fracture mechanics law. Based on this hypothesis and using a dimensional analysis of energy release rate for linear elastic materials, Bazant calculated the fracture energy of concrete as:
![Figure 1.9 Comparison of fracture process zone obtained with AE technique (from [94]) (a) Influence of aggregate size (mm), (b) Influence of specimen size](https://thumb-eu.123doks.com/thumbv2/123doknet/7793248.260186/29.892.164.695.133.359/comparison-fracture-obtained-technique-influence-aggregate-influence-specimen.webp)