Ouahiba Meziane*, Melia Guessoum, Abderrahim Bensedira and Nacerddine Haddaoui
Thermal characterization of reactive blending of
70PC/30PET mixtures prepared in the presence/
absence of samarium acetylacetonate as a
transesterification catalyst
DOI 10.1515/polyeng-2016-0190Received May 23, 2016; accepted September 16, 2016; previously published online November 1, 2016
Abstract: Poly(ethylene terephthalate) (PET)/polycarbon-ate (PC) blends were prepared in the presence and absence of samarium (III) acetylacetonate hydrate [Sm(acac)3] used as an ester-ester exchange reaction catalyst. Differ-ential scanning calorimetry (DSC) and thermogravimetric analysis/differential thermogravimetry (TGA/DTG) were used to study the variations in the thermal properties of blends before and after reactive blending. Solubility measurements in methylene chloride (CH2Cl2) and infra-red spectroscopy were also employed to highlight the structural changes that occurred during mixing in the presence of Sm(acac)3. The DSC results showed two dis-tinct transition temperatures (Tg) for all the compositions. Also, the Tg values of components were shifted compared to the parent polymers in both the blends prepared with and without catalyst. Further, the Tg of the PET-rich phase was displaced to higher temperatures and that of the PC-rich phase showed a tendency to diminish as the catalyst’s concentration increased. At the same time, the melting temperature (Tm) of the PET-rich phase was shifted to lower temperatures. The evaluation of the compositions of the PC- and PET-rich phases using Wood’s equation showed a strong dependence on the catalyst concentration. Fur-thermore, the thermogravimetric thermograms showed
that the thermal stability of the blends was between those of the homopolymers, and evidenced a net improvement relatively to the neat PET. The obtained results confirmed the aptitude of Sm(acac)3 to promote exchange reactions between PC and PET, and to achieve their compatibiliza-tion through an interfacial copolymer synthesis process. Keywords: PC/PET blends; reactive blending; transesteri-fication; thermal properties.
1 Introduction
Polymer blending is a technique of interest that has cap-tured the attention of numerous research groups since the 20th century to the present day. A polymer blend is a mixture of two or more polymers that have been blended together to create a new material with different physical properties [1, 2].
The important advantages of polymer blending can be summarized as the development of new properties or improvement of existing properties to meet specific needs, material cost reduction with little or no loss of properties, material processability improvement, and meeting the needs of emerging industries by surpassing the polymeri-zation step. Polymer blends can broadly be classified into three categories: miscible, compatible, and immiscible polymer blends [2].
Polyesters/polycarbonate blends (PEST/PC) are of both scientific and commercial interests and were intro-duced in 1980. PC has been frequently used in blends with PEST, such as polyethylene terephthalate (PET), polybu-tylene terephthalate (PBT), and polyethylene naphthalate [3–5]. Typical applications of these blends are used in the automotive industry on exterior parts, such as bumper covers, for which good chemical resistance and impact resistance are required [5–7].
PC/PET blends have been extensively studied over the past two decades. Both PET and PC are important engi-neering plastics. Particularly, PC has exceptional impact and thermal and mechanical properties but presents poor resistance to solvents and chemical attacks. The blends Correction note: Correction added after online publication
November 1, 2016: Mistakenly this article was already published ahead of print under the title “Thermal characterization of reactive blending of 70PC/30PET mixtures prepared in the presence/absence of samariuma cetylacetonate as a transesterification catalyst”.
*Corresponding author: Ouahiba Meziane, Laboratory: Physical
Chemistry of High Polymers (LPCHP), Department of Process Engineering, Faculty of Engineering Sciences, Ferhat ABBAS Setif 1 University, SETIF 19000, Algeria,
e-mail: meziane.ouahiba@yahoo.com
Melia Guessoum, Abderrahim Bensedira and Nacerddine Haddaoui:
Laboratory: Physical Chemistry of High Polymers (LPCHP),
Department of Process Engineering, Faculty of Engineering Sciences, Ferhat ABBAS Setif 1 University, SETIF 19000, Algeria
intend to obtain the chemical resistance of PET without losing the good impact strength of PC [8–11].
In earliest studies, controversial results on the miscibil-ity of blends were reported in the literature. Especially, the miscibility of PC/PET blends has been discussed, from com-pletely miscible, partially miscible, to comcom-pletely immis-cible for all compositions [12–14]. Indeed, Nassar et al. [15] observed a single glass transition temperature (Tg) for positions containing > 60–70 wt.% of PET, while the com-positions below this range showed two glass transitions. From this, it was concluded that PC and PET are completely miscible in the amorphous phase for PET-rich composi-tions, whereas PC-rich blends separate into two amorphous phases that apparently contain both components. Moreover, it was suggested that very little if any interchange reactions occur between the ester and carbonate groups during melt mixing. In addition, Murff et al. [16] reported that PC-rich blends exhibited two glass transitions, while only one Tg could be found for PET-rich compositions. These results sug-gested miscibility over parts of the composition range, while others found that PC/PET blends were completely immisci-ble over all composition ranges [8, 14, 17, 18].
These contradictory results were explained by Porter and Wang [19], who attributed all the discrepancies to the occurrence of transesterification reactions between PC and PET due to the presence of residual synthesis cata-lysts. As well, Pilati et al. [20] reported that when PET and PC are melt mixed, they undergo chemical reactions that lead to changes in the chemical structure of the polymers. Moreover, Godard et al. [21] showed that the main reaction that occurs in PBT/PC mixtures is an exchange reaction between PBT ester groups and PC carbonate ones. Some other side reactions consecutive to the principal exchange process also take place, such as degradation, pyrolysis, and gel formation, resulting probably from the instability of the ethylene carbonates produced by transesterification. The copolymer deriving from transreactions influences strongly the homogeneity of the blends by acting as an interfacial agent, which complicates the determination of the real structural phase, resulting in the melt mixing of these homopolymers. According to Guessoum et al. [22], catalyzed exchange reactions between the carbonate groups of PC and the ester ones of PET initiate at the inter-face and cause the conversion of homopolymer chains to block copolymers, when the exchange rate is still weak. The block structure of the synthesized copolymer is, after more intense transreactions, converted to a random one, because exchanges concern also the copolymer chains for which the reactions could be faster and easier, due to the proximity of the reactive functional groups. However, without the deliberate incorporation of a transesterification catalyst,
ester-carbonate interchanges do not occur at all or produce practically unnoticeable effects on the final properties of the blend. In consequence, divergent conclusions on the miscibility of PC/PET blends and the chemical structure of the transesterification product arise mainly from the blend-ing conditions, particularly, the blend composition, resid-ual catalyst nature, and concentration and melt processing conditions such as time and temperature [23–25].
The present work consists in a contribution that aims essentially to highlight the thermal properties of PC/PET blends before and after blending with a transesterifica-tion catalyst, which is samarium (III) acetylacetonate [Sm(acac)3]. The effects of exchange reactions between PC and PET have also been quantified by evaluating the frac-tions of PC and PET in both PC- and PET-rich phases as a function of samarium concentration, by using differential scanning calorimetry (DSC) results and Wood’s equation.
2 Materials and methods
2.1 Materials
A PET resin with an intrinsic viscosity of 0.8 g/dl was obtained from Tongkook (Seoul; South Korea; TexPet 874-C80). The commercial PC (Makrolon 2807) was supplied by Bayer Company (Leverkusen, Germany). The melt flow index of PC was 10 g/10 min. Sm(acac)3 was purchased from Sigma Aldrich (Taufkirchen, Germany).
2.2 Preparation of PC/PET blends with and
without catalyst
At first, the polymers PC and PET were vacuum dried in an oven for 24 h at 100°C. Then, uncatalyzed and Sm(acac)3 -catalyzed PC/PET blends were prepared according to a weight ratio of 70 : 30 in a Brabender internal mixer at a tem-perature of 270°C and a mixing speed of 30 rpm for 20 min. After the melting of homopolymers, the Sm(acac)3 catalyst was introduced at concentrations of 0.01, 0.15, and 0.020 phr. Then, the obtained catalyzed and uncatalyzed mix-tures were pelletized to obtain samples for characterization.
2.3 Measurements
2.3.1 Solubility
In order to obtain information on the solubility changes due to the structural evolution during melt blending,
PC/PET blend samples weighing 0.10 g (m0) were extracted for 24 h in a volume of 30 ml methylene chloride (CH2Cl2) (PET is soluble in CH2Cl2, contrary to PC, which is totally insoluble in this solvent) according to ASTM D 297 [25]. The suspension was filtered, and the soluble and insolu-ble fractions were recovered. A film of the soluinsolu-ble fraction was obtained after CH2Cl2 evaporation. The insoluble frac-tion was dried at 100°C, and then weighed (m) to evaluate the solubility using the following equation:
0 0 Solubility (%)=m mm− ⋅100
(1)
2.3.2 Fourier transform infrared spectroscopy (FTIR) analysis
FTIR analysis was employed to point out structural varia-tions after exchange reacvaria-tions between PC and PET. FTIR spectra were obtained between 400 and 4000 cm−1 using a Perkin Elmer infrared spectrometer.
2.3.3 DSC
Calorimetric analysis was performed using a Setarame dif-ferential scanning calorimeter (DSC131 EVO), by heating the samples from room temperature up to 300°C, at a heating rate of 10°C/min, under nitrogen. The values of
Tg and melting enthalpy (ΔHm) and temperature (Tm) were evaluated from the thermograms obtained at the second heating scans. Tm was taken at the maximum of the endo-thermic melting peak. Tg values were also estimated using the Fox equation [26] for predicting miscibility:
PC PET PET PC 1 g g g T T T ω ω = + (2)
where ωPET and ωPC are, respectively, the PET and PC weight fractions and TgPC and TgPET are the glass transition temperatures of PC and PET, respectively.
2.3.4 Thermogravimetric analysis (TGA)
The thermal stability of the blends was assessed on study-ing the thermogravimetric thermograms obtained from a Perkin Elmer TGA-4000 instrument, by heating the samples from 30°C to 700°C at a heating rate of 10°C/min under nitrogen atmosphere. The onset, maximum, and end degradation temperatures (Tonset, Tmax, Tend), and the residue contents were evaluated.
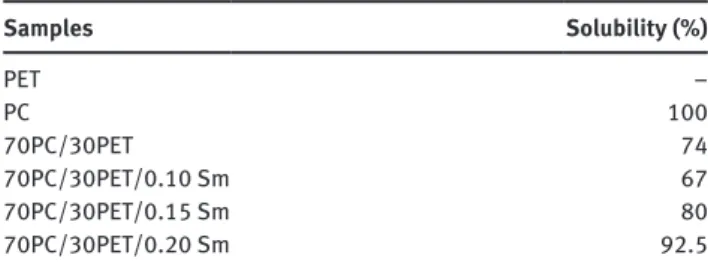
Table 1: Solubility values for PC, PET, and uncatalyzed and catalyzed
70PC/30PET blends. Samples Solubility (%) PET – PC 100 70PC/30PET 74 70PC/30PET/0.10 Sm 67 70PC/30PET/0.15 Sm 80 70PC/30PET/0.20 Sm 92.5
3 Results and discussion
3.1 Solubility measurements
The first evidence for the occurrence of exchange reactions between PC and PET during melt mixing was provided by the results of the solubility test. Table 1 reports the solu-bility values obtained from the CH2Cl2-insoluble fractions for PC and PET homopolymers and 70PC/30PET blends prepared with and without an added catalyst. It shows that PC is completely soluble, whereas PET is practically insoluble in CH2Cl2. After extraction, the 70PC/30PET blend prepared without added catalyst left about 26% of insoluble PET, indicating that PC was completely removed from the blend by this treatment. The solubility value for the uncatalyzed blend indicates, approximately, the total absence of exchange reactions between the two homopol-ymers during melt mixing.
For the 70PC/30PET-catalyzed blends, the solubility decreases for the blend with 0.1 phr of Sm(acac)3 compared to the initial value of the soluble fraction (74%). According to Pilati et al. [20], Mendes et al. [25], and Ignatov et al. [27], the variations in solubility are attributed to exchange reactions between PC and PET. Indeed, the solubility value suggests that a certain amount of PET fragments has been transferred to the PC-rich phase, resulting in the possible formation of block copolymers. After the addition of 0.15 and 0.20 phr of catalyst, the solubility increases to about 80% and 92%, respectively, indicating that an extensive exchange process has occurred between PC and PET. Indeed, the solubility enhancement could be ascribed to the fact that as the catalyst concentration increases, further PET chains move toward the PC-rich phase and that the long insoluble PET copolymer seg-ments are shortened due the occurrence of transreactions within the copolymer chains. This result confirms that the produced copolymer is formed from shorter PET blocks linked to PC segments, which promote their solubility into CH2Cl2. Correspondingly, Guessoum et al. [28] noticed
that the melt mixing of PC/PET blends with 0.25 phr of tetrabutyl orthotitanate for 30 min resulted in a totally amorphous structure as the consequence of the complete randomization of the copolymer structure. Also, Maurizio Fiorini et al. [29] suggested that the decrease in solubility is due to the formation of a block copolymer, whereas a solubility increase results from an alternating one. These findings are supported by Ignatov et al. [30], who studied the influence of the Sm(acac)3 catalyst concentration on the solubility of PC/PET blends in methylene chloride. They found that the soluble fraction decreased initially with the increase of catalyst concentration and showed that the formation of PC/PET block copolymers results in a lower solubility of the blend. Accordingly, Maurizio Fiorini et al. [29] observed that when no exchange reac-tion occurs, the weights of the soluble and insoluble frac-tions remain constant, as they contain only PC and PET, respectively. In contrast, when exchange reactions take place, a progressive shift toward larger amounts of the soluble or insoluble fractions is expected because the resulting block copolymers have a different solubility due to the dominance of PC or PET blocks. In other words, this means that PET blocks are present in the soluble fraction when the solubility of PC blocks prevails, and that PC blocks are present in the insoluble fraction when the pre-vailing effect is the insolubility of PET blocks.
3.2 Infrared spectroscopy
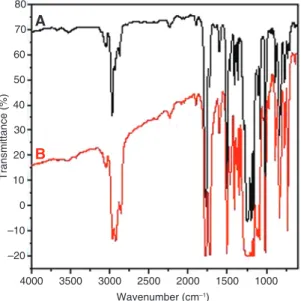
Transesterification is a chemical reaction that may change the composition of blend components. Infrared spectros-copy is used to ascertain whether transesterification had occurred in the examined blends. The infrared spectra of neat polymers and PC/PET mixtures melt blended without and with Sm(acac)3 catalyst are shown in Figures 1–3.
3500 PET PC 3000 2500 2000 Wavenumber (cm–1) 1500 1000
Figure 1: Infrared spectra of PC and PET homopolymers.
70PC/30PET
70PC/30PET/Sm(acac)3
Wavenumber (cm–1) 3500
4000 3000 2500 2000 1500 1000 500
Figure 2: Infrared spectra of 70PC/30PET melt blended with and
without Sm(acac)3 catalyst.
3500 4000 3000 2500 –20 –10 0 20 10 30 40 50 Transmittance (%) 60 70 80 A B 2000 1500 Wavenumber (cm–1) 1000
Figure 3: Infrared spectra of CH2Cl2 soluble (A) and insoluble (B)
fractions of 70PC/30PET blend catalyzed with 0.15 phr Sm(acac)3.
The carbonyl group bands of PC and PET appear at 1776 and 1721 cm−1, respectively. The changes in those two bands have been commonly used to identify the trans-esterification reactions between PET and PC [31]. For both uncatalyzed and catalyzed blends, infrared spectra combine the absorption bands of the homopolymers. The characteristic region of PC and PET carbonyl groups does not reveal the presence of carbonyl stretching bands of aromatic/aliphatic and aliphatic/aliphatic carbonate groups expected at 1763 and 1745 cm−1, respectively. This is probably due to the overlapping of several bands in this region according to Berti et al. [32]. However, it is also pos-sible that, due to their low thermal stability, some of these
carbonate groups are never present at a high concentra-tion because their rate of disappearance through side reactions is very fast. In this context, it has been reported that aliphatic-aliphatic carbonate groups are not ther-mally stable even at relatively low temperatures [32].
Thus, in our study, FTIR analysis does not give clear information about the occurrence of transreactions during the melt mixing of PET and PC with Sm(acac)3. For this reason, an FTIR study of soluble and insoluble fractions collected from solubility measurements for the blend catalyzed with 0.15 phr of Sm(acac)3 has been performed and represented in Figure 3. A PC carbonyl group band is detected in the spectra of the insoluble fraction, which should contain only PET if no transesterification reaction occurs. In addition, a PET ester carbonyl group band is observed in the infrared spectra of the soluble fraction, which is expected to contain only PC if exchanges between PC and PET are not allowed. These results support the fact that PET sequences have been transferred into the PC-rich phase and made soluble in CH2Cl2 by the reaction between PC and PET via a transesterification process. In contrast, PC units have moved toward the PET-rich phase, which is insoluble in CH2Cl2. Similar results have been reported by several authors [29, 33].
3.3 Thermal behaviors of PC/PET blends
3.3.1 Glass transition
Figure 4 shows the DSC thermograms of the PC and PET homopolymers and the 70PC/30PET mixture melt blended with and without the Sm(acac)3 interchange catalyst.
100 50 150 –13 70PC/30PET/0.20 Sm(acac)3 70PC/30PET/0.15 Sm(acac)3 70PC/30PET/0.1 Sm(acac)3 70PC/30PET PC PET –12 –11 –10 –9 –8 –7 –6 –5 –4 –3 –2 –1 0 Heat flow (mW) Temperature (°C) 200 250
Figure 4: DSC thermograms of neat polymers and 70PC/30PET
mixtures melt blended with and without Sm(acac)3.
Table 2: Analysis of DSC thermograms for PC and PET homopolymers,
and PC/PET blends melt mixed without and with Sm(acac)3 catalyst. Samples TgPET (°C) TgPC (°C) Tm (°C) Xc (%) PET 76 – 250 33.37 PC – 147 – – 70PC/30PET 79 142 244 14.92 70PC/30PET/0.10 Sm 84 138 239 14.66 70PC/30PET/0.15 Sm 83 139 231 13.82 70PC/30PET/0.20 Sm 85 139 224 12.85
The PET thermogram reveals essentially the glass transition temperature at approximately 76°C, and a melting endotherm between 200°C and 270°C and present-ing a maximum around 250°C. However, the PC thermo-gram shows only the glass transition at about 147°C. The thermograms of the PC/PET blends combine the thermal characteristics of PC and PET, and reveal variations that depend on the catalyst concentration. The thermal char-acteristics of the homopolymers and blends are summa-rized in Table 2.
For the blends melt mixed without the Sm(acac)3 catalyst, Figure 4 reveals that the Tg of the PET-rich phase is slightly higher than that of neat PET. It increases from 76°C to 79°C for the 70PC/30PET mixture. In opposite, the PC-rich phase Tg is lower than that of the neat PC and is situated around 142°C. Fraısse et al. [34] reported a similar result that they assigned to the occurrence of transesteri-fication reactions in the absence of a catalyst. The occur-rence of interchange reactions between PC and PET melt mixed without a catalyst was also reported by several authors [12, 23, 35]. Also, Frounchi et al. [36] suggested that, due to their higher mobility, the PET molecules diffuse into the PC-rich regions and cause a plasticizing effect, which reduces the Tg of the PC-rich phase.
On the other hand, the thermal behavior of the 70PC/30PET blend was investigated in the presence of the Sm(acac)3 catalyst when the concentration has been varied from 0.10 to 0.15 and 0.20 wt.%. Figure 4 shows clearly that after blending with the Sm(acac)3 interchange catalyst, the two transition temperatures related to the PC- and PET-rich phases are still observed for all the compositions. This implies that two amor-phous phases are still present in the catalyzed blends. However, it has been noticed that the Tg of the PET-rich phase was higher than that for pure PET, while the Tg of the PC-rich phase was lower than that observed for the neat PC. It seems that the addition of the Sm(acac)3 cata-lyst promotes transesterification reactions by favoring the mutual diffusion of both homopolymer molecules, which encourages compatibility [13].
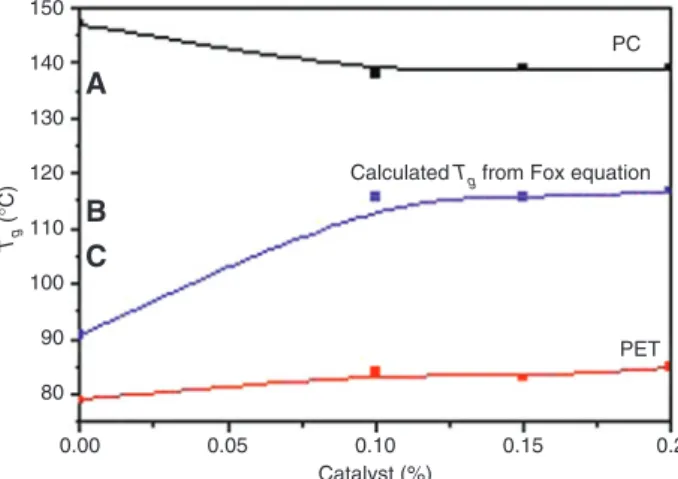
Moreover, on comparing the Tg measured values for catalyzed blends with those characteristics of the uncat-alyzed one, we noticed that on increasing the Sm(acac)3 concentration, the Tg of the PET-rich phase shifts to a higher temperature and attains 85°C for the catalyst con-centration of 0.20%. At the same time, the increase in the Sm(acac)3 catalyst concentration does not seem to affect the PC-rich-phase Tg, which is significantly lower than that of the PC homopolymer but invariable relatively to the uncatalyzed blend, as it is reported in Figure 5. According to Reinsch and Rebenfeld [23], the shifts in the component Tgs could be attributed to the fact that the glass transition of PET takes place in the presence of the glassy PC phase. Thus, the rigid PC “matrix” could contribute in increasing the Tg of the PET-rich phase. The presence of the rigid glassy PC matrix domains may act to raise Tg through a friction process at the interface between the two phases. On the other hand, the glass transition of PC in the blend takes place in the presence of rubbery PET, which may effectively plasticize the PC at the interface and cause the depression of its Tg in the blends [23].
In summary, the variations detected on the glass transition behavior of PC- and PET-rich phases into PC/ PET blends are probably the consequence of an induced compatibilization, promoted by the occurrence of transes-terification reactions. In this context, it has been reported that glass transition shifts in polymer blends are most generally observed due to physical interactions at the interface between the components [37]. Thus, the occur-rence of interchange reactions into the PC/PET mixtures provides the opportunity for PC units to pass into the PET phase and for PET ones to enter the PC domains. These exchanges contribute to the creation of copolymers that
act as interfacial agents and improve the compatibility between the two phases [22].
3.3.2 Melting behavior
Figure 6, depicting the melting behavior of the PET-rich phase in uncatalyzed and catalyzed blends, provides addi-tional pieces of evidence on the occurrence of exchanges between PC and PET, and points out the effects of PC trans-ferred units on the melting process of the PET-rich phase. Indeed, this figure reveals that when PET and PC are melt mixed without a catalyst, the melting endotherm is slightly displaced toward lower temperatures and the tem-perature at the maximum of the melting peak decreases from 250°C to 244°C. This suggests that only small or no exchanges were possible during melt blending. Also, the shift in the melting endotherm indicates that the fusion of PET crystallites occurs for lower temperatures because they are not as perfect as those formed in the neat PET.
For catalyzed 70PC/30PET systems, Figure 6 shows a more pronounced shifting of the melting endotherm toward lower temperatures. A significant decrease in the
Tm of the PET-rich phase is noticed as the Sm(acac)3 cata-lyst concentration is increased. Tm passes from 250°C for neat PET to 224°C for the PET-rich phase into the blend melt mixed with 0.20% of Sm(acac)3. The depression of the PET melting temperature results from defects in PET crystallites assigned to the formation of PC/PET copoly-mer chains and other by-products of the interchange reactions [13]. Hanrahan et al. [38] also reported that tran-sreactions affect the melting behavior of a crystallizable polymer through their effect on nucleation or spherulitic growth rates. These results agree with those reported by
0.00
Calculated Tg from Fox equation
PC PET 80 A B C 90 100 110 120 Tg (° C) 130 140 150 0.05 0.10 Catalyst (%) 0.15 0.2
Figure 5: Variations of PC- and PET-rich phases Tg as a function of
Sm(acac)3 concentration. 0.00 Tm (° C) 220 225 230 235 240 245 0.05 0.10 Sm(acac)3 (phr) 0.15 0.2
Figure 6: Effects of Sm(acac)3 concentration the melting
Mendes and Pereira [39], who associated the changes of
Tg and Tm of the parent polymers to the esterification and transesterification reactions inside the phases and at the interfacial region. Thus, it seems that during blending, bulky PC units are transferred into PET chains, which disturb the PET crystallization and produce less perfect crystals that melt for lower temperatures.
3.3.3 Crystallinity
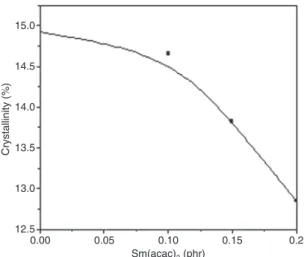
Figure 7 shows the crystallinity (X2) variations for 70PC/30PET blends prepared without and with the Sm(acac)3 catalyst. The crystallinity for neat PET was approximately 33.37%. After blending with PC, the PET crystallinity decreased in both uncatalyzed and catalyzed blends, irrespective of the added catalyst concentration. The effects of blending and transesterification on the crys-tallization behavior of PET within PC/PET blends have been subjected to extensive studies [12, 40–43], where authors pointed out hindering effects induced particularly for high PC and catalyzed interchange reactions. The alter-ation in PET crystallizalter-ation is associated to an increase in the cold crystallization temperature and a reduction of the melting temperature.
Indeed, the crystallization of PET seems to be physi-cally restricted in the presence of PC domains. Mendes et al. [40] found that in the presence of PC, the crystallin-ity of PET decreases by about 50%. Also, it recognized that in polymer blends composed of an amorphous polymer and a crystallizable one, the crystallinity of the crystalliz-able polymer is greatly hindered by the amorphous com-ponent [28]. Accordingly, Nassar et al. [15] showed that the
0.00 Crystallinity (% ) 12.5 13.0 13.5 14.0 14.5 15.0 0.05 0.10 Sm(acac)3 (phr) 0.15 0.2
Figure 7: Effect of Sm(acac)3 concentration on the crystallinity of
PET in 70PC/30PET blends.
presence of PC greatly alters the crystallization behavior of PET but does not completely prevent its development.
In the case of catalyzed blends, the crystallization hindrance is due to the insertion of bulky PC units into PET chains [12, 41]. Indeed, Marchese et al. [42] reported that if the crystallization process is hindered, this could be due either to the formation of a more homogeneous blend or to the decrease in the lengths of PET blocks in the formed copolymer. Similarly, Aravind et al. [43] found that the crystallinity of poly(trimethylene terephthalate) (PTT) in PTT/PC blends decreases while the PC content in the mixtures increases. The authors suggested that the loss of crystallinity is due to the formation of random copolyes-ters resulting from transreactions between PTT and PC. 3.3.4 Weight fractions of PC and PET into PET- and
PC-rich phases
From the Tg values of PC and PET phases into the PC/PET blends, the apparent weight fractions of PC and PET dis-solved into the PC- and PET-rich phases, respectively, can be evaluated. The apparent weight fractions of PC are determined in the PC-rich phase and the PET-rich phase by using Wood’s equation, which is often used to describe the dependence of Tg on the composition in random copol-ymers. Wood’s equation is given as follows [44]:
1 1 2 2
g g g
T =ωT +ωT (3)
where Tg is the observed Tg for the copolymer, ω1 is the weight fraction of homopolymer 1 having Tg1, and ω2 is the weight fraction of homopolymer 2 having Tg2. Kim and Burns [45] rearranged Eq. (3) to the following form:
1, 2 1 1 2 b g g g Tg T T T ω′= − − (4)
where ω′1 is the apparent weight fraction of polymer 1 in the polymer 1-rich phase and Tg1,b is the observed Tg of polymer 1 in the blends. Table 3 reports the apparent weight fractions of PC and PET into PC- and PET-rich phases for the uncatalyzed and catalyzed blends, and as a function of the Sm(acac)3 catalyst concentration. As it appears, the weight fractions of PET dissolved into the PC-rich phase ( )ω′2 are higher than those of the PC compo-nent units into the PET-rich phase ( ).ω′′1 This implies that the PET units are more transferable to the PC-rich phase than the PC ones due to their lower viscosity.
Also, the blend fractions vary trivially with the cata-lyst concentration. Similar results have been reported by several other authors [22, 46], who explained that during
the first period of mixing, transreactions are limited to the interfacial regions where only the PET and PC chains involved in this area are concerned by interchanges. There-after, transesterification reactions continue probably between the blocks contained into these same copolymer chains without further or a little transfer of additional PET and/or PC units. Thus, it appears that due to the vicinity of reactive functional groups, transreactions seem to be particularly faster between the copolymer segments than at the interface between homopolymer chains, where the mixing conditions (shear and mixing time) are required to permit the reactive groups to come into contact and interact.
3.4 Thermal stability of PC/PET blends
before and after transreactions
The thermogravimetric and differential thermogravim-etry (DTG) curves of PC, PET, and PC/PET blends are represented in Figures 8 and 9, respectively. The thermal characteristics, namely, Tonset, Tmax, and Tend, and residue content are reported in Table 4. The PC/PET blend melt mixed with 0.1 phr Sm(acac)3 catalyst is chosen as rep-resentative for all studied blends. The homopolymers degrade according to a single-step process. According to the DTG traces, the onset of the thermal degradation Table 3: PC and PET apparent weight fractions into PC- and
PET-rich phases for 70PC/30PET blends melt mixed with and without Sm(acac)3, evaluated by using Wood’s equation.
Samples PC-rich PET-rich 1 (PC) ω′ ω′2 (PET) ω′′2 (PET) ω′′1 (PC) PC 1.00 – – 1.00 70PC/30PET 0.9295 0.0705 0.9577 0.0423 70PC/30PET/0.10 Sm 0.8732 0.1268 0.8873 0.1127 70PC/30PET/0.15 Sm 0.8873 0.1127 0.9014 0.0986 70PC/30PET/0.20 Sm 0.8873 0.1127 0.8732 0.1268 PET – 1.00 1.00 – 100 Weight loss (%) 10 A C D A: PC B C: 70PC/30PET D: 70PC/30PET/0.1 Sm(acac)3 B: PET 20 30 40 50 60 70 80 90 100 110 200 300 400 Temperature (°C) 500 600 700
Figure 8: TG thermograms of neat polymers and their blends.
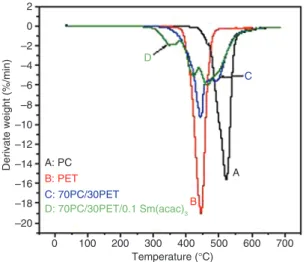
Derivate weight (%/min) A
C D B A: PC C: 70PC/30PET D: 70PC/30PET/0.1 Sm(acac)3 B: PET Temperature (°C) 100 0 200 300 400 500 600 700 –20 –18 –16 –14 –12 –10 –8 –6 –4 –2 0 2
Figure 9: DTG thermograms of neat polymers and their blend.
Table 4: TGA parameters for PC, PET, and 70PC/30PET blends.
Samples
Degradation temperatures (°C)T content (%)Residue Tmax
onset Tend PC-rich phase PET-rich phase
PC 445 593 24.18 523 –
PET 375 498 16.74 – 444
70PC/30PET 348 582 19.34 494 448
70PC/30PET/0.1 Sm 279 600 18.41s 420 465
of PET and PC appears at 444°C and 523°C, respectively. PET exhibits a lower thermal resistance than PC as evi-denced by the lower values of the starting and final deg-radation temperatures. At the end of decomposition, PET and PC left around 16% and 24% of carbonaceous ash, respectively.
For the (70 : 30) PC/PET blend melt mixed without catalyst, the thermogravimetric and DTG thermograms (Figures 8 and 9) show that decomposition occurs in two steps: the first step represents the PET-rich phase deg-radation while the second step is related to the PC-rich phase. The uncatalyzed blend exhibits an intermediate thermal resistance. The decomposition of the PC-rich phase occurs at relatively lower temperatures relatively to the homopolymer. A similar result has been reported in a study on PC/PLA blends by Phuong et al. [47], who pro-posed that the thermal decomposition of PLA accelerates the degradation of the PC phase. The DTG thermograms (Figure 9) show two peaks of degradation that confirm that the blend decomposes in two steps: the first one is correlated with the PET-rich phase and the second one with the PC-rich one. After melt blending with 0.1 phr of the Sm(acac)3 catalyst, the thermal decomposition of the PC/PET blend is carried out in three steps, which empha-sizes that a third phase is present in the catalyzed mixture. This additional stage appears before the two initial degra-dation steps related to the homopolymers, which suggests that the phase responsible for this degradation step pos-sesses an intermediate chemical structure between those of PC and PET because it resulted from catalyzed inter-changes at the interface. Swoboda et al. [48] also observed an additional weight loss peak located before the two initial degradation steps and concluded that in blends, an additional thermal degradation mechanism leading to the formation of volatile species occurs, and a possible assumption is that it is due to the transesterification reac-tion at the interface between PET and PC, which leads to chain breaking as a side effect. The copolymer phase pre-sents a lower stability relatively to the uncatalyzed system and the PC- and PET-rich phases. This is an indication that the occurrence of transesterification reactions in the PC/ PET system blended in the presence of the Sm(acac)3 cata-lyst produces a less stable material than the uncatalyzed blend and the forming components. Similar results were observed by Swoboda et al. [49], when they assumed that transesterification reactions lead to the blend compatibi-lization by copolymer formation at the interface; however, it decreases the thermal stability.
4 Conclusion
In this work, the influence of the Sm(acac)3 catalyst on thermal properties has been investigated. The variations detected on the glass transition behavior of PC- and PET-rich phases into PC/PET blends were the consequence of
an induced compatibilization, promoted by the occur-rence of transesterification reactions. Also, the decrease in the PET melting temperature resulted from the formation of PC/PET copolymer chains after the insertion of bulky PC units into PET chains, which also caused its crystal-linity reduction. The occurrence of transreactions during melt blending in the presence of the Sm(acac)3 catalyst has been evidenced by the solubility measurements of the catalyzed blend in dichloromethane (CH2Cl2). The infra-red analysis of soluble and insoluble fractions proved the presence of PC into the insoluble fraction, which should contain only PET if no transesterification reaction occurs. Additionally, PET carbonyl groups were observed in the infrared spectra of the soluble fraction, which is expected to contain only PC. Wood’s equation was employed to eval-uate PC and PET apparent weight fractions in 70PC/30PET blends prepared with and without added Sm(acac)3.
Despite the effectiveness of Sm(acac)3 in the promo-tion of interchanges between PC and PET, it contributes to the conception of less stable PC/PET blends than the uncatalyzed blend and the forming homopolymers, as it was concluded from the TGA.
References
[1] Thomas S, Grohens Y, Jyotishkumar P, Eds., Characterization
of Polymer Blends Miscibility, Morphology and Interfaces. Polymer Blends, Ed. Wiley: Germany, 2015, p. 1.
[2] Thomas S, Shanks R, Sarathchandran C, Eds., Nanostructured
Polymer Blends, Elsevier: UK, 2014, p. 1.
[3] Kulshreshtha AK, Vasile C. Handbook of Polymer Blends and
Composites, vol. 1. Rapra Technology Limited: UK, 2002.
[4] Nadkarni VM, Rath AK. In: Handbook of Thermoplastic
Poly-mers: Homopolymers, Copolymers, Blends, and Composites,
Chapter 19. Wiley: Germany, 2002, pp. 835–869. [5] Takeuchi K. In: Polymer Science. Elsevier: Japan, 2012,
pp. 363–376.
[6] Forounchi M, Mehrabzadeh M, Mohseni S. Iran. Polym. J. 2002, 11, 151–157.
[7] Utracki LA. Commercial Polymer Blends. Springer, India, 1998, pp. 390.
[8] Zahedi P, Arefazar A. J. Appl. Polym. Sci. 2008, 107, 2917–2922. [9] Kong Y, Hay JN. Polymer 2002, 43, 1805–1811.
[10] Mendes LC, Giornes AM, Dias L, Cordeiro AF, Benzi MR. Int. J.
Polym. Mater. Polym. Biomater. 2007, 56, 257–272.
[11] Na SK, Kong BG, Choi C, Jang MK, Nah JW, Kim JG, Jo BW. Macromol. Res. 2005, 13, 88–95.
[12] Carrot C, Mbarek S, Jaziri M, Chalamet Y, Raveyre C, Prochazka F. Macromol. Mater. Eng. 2007, 292, 693–706.
[13] Mbarek S, Carrot C, Jaziri M. Polym. Eng. Sci. 2006, 46, 1378–1386.
[14] Zhang Z, Xie Y, Ma D. Eur. Polym. J. 2001, 37, 1961–1966. [15] Nassar TR, Paul DR, Barlow JWJ. Appl. Polym. Sci. 1979, 23,
[16] Murff SR, Barlow JW, Paul DRJ. Appl. Polym. Sci. 1984, 29, 3231–3240.
[17] Gowd EB, Ramesh C. Polymer 2005, 46, 7443–7449. [18] Suzuki T, Tanaka H, Nishi T. Polymer 1989, 30, 1287–1297. [19] Porter RS, Wang LH. Polymer 1992, 33, 2019–2030. [20] Pilati F, Marianucci E, Berti C. J. Appl. Polym. Sci. 1985, 30,
1267–1275.
[21] Godard P, Dekoninck JM, Devlesaver V, Louoain B. J. Polym. Sci. 1986, 24, 3301–3313.
[22] Guessoum M, Haddaoui N, Fenouillot-Rimlinger F. Int. J. Polym.
Mater. Polym. Biomater. 2008, 57, 657–674.
[23] Reinsch E, Rebenfeld L. J. Appl. Polym. Sci. 1996, 59, 1913–1927.
[24] Al-Jabareen A, Illescas S, Maspoch ML, Santana OO. J. Mater.
Sci. 2010, 45, 6623–6633.
[25] Mendes LC, Giornes AM, Dias ML, Cordeiro AF, Benzi MR. Int. J.
Polym. Mater. Polym. Biomater. 2007, 56, 257–272.
[26] Nadkarni VM, Shingankuli VL, Jog JP. Polym. Eng. Sci. 1988, 28, 1326–1333.
[27] Ignatov VN, Carraro C, Tartari V, Pippa R, Pilati F, Berti C, Fiorini M. Polymer 1996, 37, 5883–5887.
[28] Guessoum M, Nekkaa S, Haddaoui N. Int. J. Polym. Mater.
Polym. Biomater. 2008, 57, 759–770.
[29] Maurizio Fiorini FP, Corrado Berti MT, Ignatov V. Polymer 1997, 38, 413–419.
[30] Ignatov VN, Carraro C, Tartari V, Pippa R, Scapin M, Ricerche EC, Piazza B. Polymer 1997, 38, 195–200.
[31] Zhang GY, Ma JW, Cui BX, Luo XL, Ma DZ. Macromol. Chem.
Phys. 2001, 202, 604–613.
[32] Berti C, Bonora V, Pilati F, Fiorini M. Macromol. Chem. 1992, 193, 1665–1677.
[33] Guessoum M, Haddaoui N. Int. J. Polym. Mater. Polym.
Bio-mater. 2006, 55, 715–732.
[34] Fraısse F, Verney V, Commereuc S, Obadal M. Polym. Degrad.
Stabil. 2005, 90, 250–255.
[35] Mendes LC, Pereira PSC, Ramos VD. Macromol. Symp. 2011, 299/300, 183–189.
[36] Frounchi M, Mehrabzadeh M, Mohseni S. Iran. Polym. J. 2002, 11, 151–157.
[37] Thirtha V, Lehman R, Nosker T. Polymer 2006, 47, 5392–5401. [38] Hanrahan BD, Angeli SR, Runt J. Polym. Bull. 1986, 15,
455–463.
[39] Mendes LC, Pereira PSDC. Mater. Sci. Appl. 2011, 2, 1033– 1040.
[40] Mendes LC, Abrigo RER, Ramos VD, Pereira PSC. J. Therm. Anal.
Calorim. 2010, 99, 545–549.
[41] Marchese P, Celli A, Fiorini M, Gabaldi M. Eur. Polym. J. 2003, 39, 1081–1089.
[42] Marchese P, Celli A, Fiorini M, Applicata C, Bologna U, Risorgimento V. Macromol. Chem. Phys. 2002, 203, 695–704. [43] Aravind I, Pionteck J, Thomas S. Polym. Test. 2012, 31, 16–24. [44] Wood LA. J. Polym. Sci. 1958, 28, 319–329.
[45] Kim WN, Burns CM. J. Polym. Sci. Pt. B Polym. Phys. 1990, 28, 1409–1429.
[46] Al-Jabareen A, Illescas S, Maspoch ML, Santana OO. J. Mater.
Sci. 2010, 45, 6623–6633.
[47] Phuong VT, Coltelli MB, Cinelli P, Cifelli M, Verstichel S, Lazzeri A. Polymer 2014, 55, 4498–4513.
[48] Swoboda B, Buonomo S, Leroy E, Lopez Cuesta JM. Polym.
Degrad. Stabil. 2008, 93, 910–917.
[49] Swoboda B, Buonomo S, Leroy E, Cuesta JML. Polym. Degrad.