O
pen
A
rchive
T
OULOUSE
A
rchive
O
uverte (
OATAO
)
OATAO is an open access repository that collects the work of Toulouse researchers and
makes it freely available over the web where possible.
This is an author-deposited version published in :
http://oatao.univ-toulouse.fr/
Eprints ID : 14047
To link to this article : DOI:10.1016/j.tsf.2013.03.098
URL :
http://dx.doi.org/10.1016/j.tsf.2013.03.098
To cite this version :
Kokkoris, George and Brault, Pascal and Thomann, Anne-Lise and
Caillard, Amael and Samélor, Diane and Boudouvis, Andreas G.
and Vahlas, Constantin Ballistic and molecular dynamics
simulations of aluminum deposition in micro-trenches. (2013) Thin
Solid Films, vol. 536. pp. 115-123. ISSN 0040-6090
Any correspondence concerning this service should be sent to the repository
administrator:
[email protected]
Ballistic and molecular dynamics simulations of aluminum deposition in
micro-trenches
George Kokkoris
a,⁎
, Pascal Brault
b,⁎
, Anne-Lise Thomann
b, Amaël Caillard
b, Diane Samelor
c,
Andreas G. Boudouvis
d, Constantin Vahlas
ca
Sector of Microelectronics, IAMPPNM, NCSR Demokritos, Athens 15310, Greece
b
GREMI UMR7344 CNRS-Université d'Orléans BP6744 Université d'Orléans, 45067 Orléans cedex 2, France
cUniversité de Toulouse, CIRIMAT/INPT, 4 allée Emile Monso BP44362, 31030 Toulouse cedex 4, France
dSchool of Chemical Engineering, National Technical University of Athens, Zografou Campus, Athens 15780, Greece
a b s t r a c t
Two different feature scale modeling frameworks are utilized for the study of aluminum (Al) deposition pro-files inside micro-trenches. The first framework, which is applied in metal-organic chemical vapor deposition (MOCVD) of Al, couples a ballistic model for the local flux calculation, a surface chemistry model, and a profile evolution algorithm. The calculated conformity of the deposited film is compared with experimental results corresponding to Al MOCVD from dimethylethylamine alane (DMEAA). The outcome of the comparison is that the effective sticking coefficient of DMEAA is in the range of 0.1–1. There is also a strong indication Keywords:
that surface reaction kinetics follows Langmuir Hinshelwood or Eley Rideal mechanism. The second
frame-Metal-organic chemical vapor deposition – –
Magnetron sputtering deposition work, which is applied in physical vapor deposition of Al, implements 2D molecular dynamics (MD) simulations. Molecular dynamics simulation The simulations are performed in a “miniaturized” domain of some hundreds of Angstroms and are used to Ballistic model explore micro-trench filling during magnetron sputtering deposition of Al on a rotated substrate. Most of the Aluminum experimental results are qualitatively reproduced by the MD simulations; the rotation, aspect ratio, and kinetic Feature scale model energy effects are correctly described despite the completely different length scales of simulation and
experi-ment. The sticking probability of Al is calculated 0.6 for the conditions of the experiments.
1. Introduction
Deposition of thin films through dry, physical or chemical processes is widely used in several fields such as coatings technology, micro- or nano-electronics, micro- or nano-electromechanical systems, photovol-taics, etc. In most of the cases, the film has to be deposited not on flat surfaces but on surfaces including features (structures) such as trench-es, holtrench-es, pillars or more complex shapes[1](e.g. disordered, irregular, patterned, or porous surfaces). A generic specification is the uniformity of the deposition rate, i.e. the thickness conformity of the film, on the whole surface of the surface features. For example, the deposited film should be conformal either during the filling of a hole or during the covering of an array of pillars.
The striving for the fulfillment of the conformity specification includes both experimental and theoretical (computational) efforts. In this frame, a comparative experimental study has been reported recently[2], involv-ing magnetron sputterinvolv-ing (MS) deposition, metal-organic chemical vapor deposition (MOCVD), and pulsed laser deposition (PLD). The work was focused on the processing of aluminum (Al) films; the objectives were to reveal differences in their micro-structure and conformity on patterned substrates.
The subject of this work is the computational investigation of film deposition on a surface with trenches. Generally, the investigation of deposition mechanisms occurring on complex in shape surfaces is more complicated than on flat surfaces. For the transport of species in the surface features, e.g. in the trenches, shadowing and reemission should be taken into account. The continuum approach is no longer valid (due to small size of features and the low pressure conditions) and an additional model, which can handle transport at conditions of high Knudsen number, is required. Nevertheless, the investigation of deposition mechanisms on complex in shape surfaces is beneficial for the extraction of surface kinetics. For example, from an experiment including film deposition on a flat surface, one can extract the deposi-tion rate, i.e. one value, while from an experiment including film depo-sition in a trench, a range of depodepo-sition rates can be extracted, at the bottom, at the top or along the sidewalls; deposition rate varies locally on the elementary surfaces of the trench. A set of experimental data, instead of a single value, is beneficial for the extraction of valid surface kinetics.
The present contribution considers a previously reported experi-mental work[2]on the processing of Al films by MS and MOCVD as a case study. Even if there are experimental[3–7]and computational works[8,9]in the literature regarding CVD and physical vapor sition (PVD) of Al, there is a lack of computational studies of Al depo-sition into features (e.g. trenches). An exception is the work of Gilmer et al.[10]where a Monte Carlo framework is used to simulate the
⁎ Corresponding authors. Tel.: +30 210 650 3238; fax: +30 210 651 1723. E-mail addresses:[email protected](G. Kokkoris),
[email protected](P. Brault).
morphology evolution inside micro-trenches during Al deposition by MS.
In this work, two different feature scale modeling frameworks are utilized to investigate the mechanisms involved in MOCVD and MS of Al into micro-trenches. The first framework[11]is applied in MOCVD of Al and couples a ballistic model for the local flux calculation[12], a surface chemistry model, and a profile evolution algorithm, namely the level set method[13,14]. The aim is to investigate the surface re-action kinetics of Al MOCVD by comparing the calculated conformity of the deposited film with experimental results corresponding to Al MOCVD from dimethylethylamine alane ([(CH3)2C2H5]NAlH3, DMEAA).
Useful conclusions for the effective sticking coefficient of DMEAA and for the type of surface kinetics are extracted by the latter comparison. The second framework is applied in micro-trench filling during MS of Al and implements 2D molecular dynamics (MD) simulations. An impor-tant point in this case, is that while the micro-scale of the trench is not reachable by MD simulations, the study of micro-trench filling with MD can be feasible by using the correct aspect ratios of the trenches (ratio of the depth to the width). Additionally, by comparing the simula-tion with the experimental results, the value of the sticking probability of Al can be extracted.
The manuscript is structured as follows:Section 2includes a sum-mary of the experimental results for MOCVD and MS of Al. The model-ing frameworks are described inSection 3.Section 4contains the results of the computations and the comparison with the experimental results, and finallySection 5includes the conclusions of this work.
2. Experimental results
The experimental results which motivated the modeling efforts of this work come from a recent work[2]by Thomann et al. Deposition was performed on a micro-patterned silicon (Si) wafer with different surface features (trenches, holes, pillars) with different width. The initial depth (for holes and trenches) or height (for pillars) was 1 μm. The Si wafer is a model substrate which was developed in the frame of the French research laboratory group (CNRS “Groupement de Recherche” 2008), entitled “Mécanismes de dépôts par voie gazeuse sur des Surfaces à Géométrie Complexe” (SurGeCo). The deposition conformity is defined by two values (see the schematic ofFig. 1A): Bottom conformity, Cb, and
sidewall conformity, Cs,
Cx¼ Tx Tt ! "
100%; ð1Þ
where x = b, s. Txand Ttare defined inFig. 1A.
The conformity values Cband Csare calculated for several trenches
with different aspect ratios (AR, ratios of trench depth to width) by measuring Txand Tton cross sections obtained by scanning electron
microscopy (SEM)[2].
MOCVD of Al was performed from DMEAA in a stagnant flow, cy-lindrical, vertical reactor[9]. Details for the experimental set up and the deposition protocol can be found elsewhere[2].
Fig. 1B presents a cross sectional SEM image of a film processed under the conditions corresponding to patSi-04 (Table 1). It is a rep-resentative image for the samples studied in this work which reveals a rather smooth film surface with a film continuity compared with the remaining set of the processing conditions in[2].
Deposition conditions for the MS of Al are summarized in
Table 2.Fig. 2A displays a typical cross-sectional SEM image of a trench with a small AR (0.5) filled by sputtered Al, while inFig. 2B the AR is equal to 2.
The growth is columnar. On top and bottom surfaces, the columns are perpendicular to the surface. This is due to the rotating substrate leading to homogeneous atom flux as drawn in the center ofFig. 2A. Columns are tilted on the sidewalls with an angle depending on the height. It varies between 30° and 25° with respect to the surface
normal. The shadowing effect has thus canceled the rotation effects contrary to top and bottom surfaces. SEM images inFig. 2A and B re-veal that the film conformity widely depends on the AR. When AR is high (Fig. 2B), the growth at the trench top induces a shadowing ef-fect which prevents the atom flux from penetrating inside the pat-tern. The thickness at the bottom is thus smaller than on the top, but close to that on the side walls (Fig. 2B). For lower AR (Fig. 2A), the arriving atoms are allowed to penetrate into the pattern and the thickness at the bottom increases. Moreover, because of the tar-get rotation, overlapping of the flux of opposite direction occurs, which enhances the deposition rate at the center of the bottom sur-face resulting in a curved profile of the film thickness. This behavior is evidenced in the SEM image ofFig. 2A.
3. Modeling frameworks
3.1. The modeling framework for MOCVD of Al into micro-trenches The framework used for modeling MOCVD of Al into micro-trenches consists of three models: A ballistic model for the calculation of the local fluxes inside the features, a surface model, and a profile evolution algo-rithm. By combining the ballistic model with the surface model, the local deposition rate (velocity) inside the features is calculated and is then fed to the profile evolution algorithm. The modeling framework essentially links the species fluxes just above the features on the wafer with the film profile evolution inside the features (e.g. long trenches or holes). It has been used in both etching[11]and deposition
[15]cases.
3.1.1. Ballistic model for the local flux calculation
For the calculation of the local surface reaction rate, i.e. the local de-position rate, inside a feature, the local fluxes of each species are need-ed. These fluxes are calculated by a ballistic model[16]which is usually used at conditions where Knudsen number (ratio of the mean free path to the characteristic dimension of the feature) is greater than 1. The
A
B
Fig. 1. A) Parameters used for the formulation of conformity values [Eq.(1)]. Tbis
mea-sured at the center of the base and Tsat the middle of the sidewall. B) SEM image from
an Al film profile in a trench with width equal to 3 μm[2]; the conditions of deposition are those corresponding to patSi-04 (seeTable 1).
ballistic model is formulated by a system of nonlinear integral equations which reads[12] Γið Þ ¼ Γx direct;ið Þx þ∬Af 1−SE;i½Γ1ð Þ; Γx′ 2ð Þ; …; Γx′ Nð Þx′& n o Qiðx; x′Þ Γið ÞdA′; i ¼ 1; …; N;x′ ð2Þ where Γi(x) is the local flux and Γdirect,i(x) is the direct flux, i.e. the flux
coming directly from the bulk, of species i at an elementary surface of the feature at position x. Note that both Γi(x) and Γdirect,i(x) are scalar
(and not vectors) as they are the result of the inner product of the flux vector with the normal vector of the surface the flux arrives at. The integral in the right hand side of Eq.(2)stands for the flux arriving at x from all other elementary surfaces of the feature. Afis the surface
area of the feature. SE,iis the effective sticking coefficient of species i
and represents the effective net loss (if SE,i> 0) or creation (if SE,ib 0) of species i on the surface. SE,imay vary locally from surface to surface
inside the feature and the surface reaction kinetics is used for its cal-culation. Qi(x, x′) is the differential transmission probability [16]
from x′ to x which incorporates geometric characteristics (orientation, visibility and distance of the elementary surfaces at x and x′) as well as the reemission mechanism of species i[12,17].
The direct flux at a surface at x depends on a) the solid angle through which the surface is visible to the bulk phase of the reactor, b) the orientation of the surface, and c) the flux distribution of the spe-cies in the bulk phase and above the patterned wafer. The calculation of the solid angle can be simplified[12,18,19]in cases of features with spe-cific geometric characteristics (infinite length trenches or axisymmetric holes). For this type of features the surface integral of Eq.(1)can be reduced[12,16,20]to a line integral. In this work, we use the reduced expressions for infinite length trenches[12].
3.1.2. Surface chemistry model
The surface model describes the surface processes and essentially quantifies the effect of local fluxes (or partial pressures or concentra-tions) on the local deposition rate. Regarding the system of interest, the deposition of Al is expected to follow a series of reactions[6,21]. Following a previous work[8], we consider first order kinetics, i.e. the effective sticking coefficient of the precursor depends only on the sur-face temperature, T. The deposition rate (velocity) of Al (m/s) is
DRAl¼
AWAl 1000NAρAl
! "
SE;DMEAAð ÞΓT DMEAA; ð3Þ
where SE,DMEAA(T) and ΓDMEAAare the effective sticking coefficient and
the molecular flux [molecules/(m2s)] of DMEAA arriving on the surface.
AWAland ρAlare the atomic weight (kg/kmole) and the density (kg/m3)
of solid Al. NAis the Avogadro number (molecules/mol).
3.1.3. Profile evolution algorithm
The local deposition rates (velocities) as calculated by Eq.(3)are fed to the profile evolution algorithm, namely the level set method
[13,14]. The central mathematical idea of the level set method lies in the consideration that the moving boundary is embedded in the level set function, φ, and represents a specific contour of φ. The basic equation of the method describing the evolution of the level set func-tion is the initial value problem
φtþ Fj∇φj ¼ 0; φ x; t ¼ 0ð Þ ¼ q xð Þ; ð4Þ
where q(x) is the initial condition which is defined by the initial profile and F at x is the component of the velocity in the normal direction of the contour of φ passing through x; F comes from the deposition rate (velocity). The implementation of the level set method entails, in addi-tion to the soluaddi-tion of Eq.(4), several computational tasks[11]. 3.2. Molecular dynamics simulations of Al PVD into micro-trenches
MD simulations is a powerful tool for examining the atomic scale structure of deposited[22]atomic layers. Indeed, it concerns the calcu-lation of the trajectory of the atoms from the time they are launched to
Table 2
Operating conditions for the MS deposition of Al in the work of Thomann et al.[2]. Sample code Cathode voltage
(V) Argon pressure (Pa) Incidence angle Substrate bias PCref standard 375 1 (38°) Floating PC2 standard 375 5 (38°) Floating
PC2 standard 375 1 (60°) Floating Fig. 2. SEM images of micro-trenches filled by sputtered Al. The micro-trenches lie on arotating wafer. A) AR = 0.5 B) AR = 2. Table 1
Operating conditions in MOCVD of Al in the work of Thomann et al.[2]. QN2,DMEAAand QN2,dilutioncorrespond to nitrogen flow rate in standard cubic centimeters per minute (sccm)
through DMEAA and as dilution gas, respectively. Sample code Pressure
(kPa) QN2,DMEAA (sccm) TDMEAA (°C) QN2, dilution (sccm) Substrate temperature (°C)
Total deposition time (min)
patSi-04 1.33 (the first 4 min), 5.82 (10 min) 25 7 325 160 14 patSi-05 1.33 (the first 4 min), 9.33 (11 min) 25 8 325 160 15
the end of the simulation. Thus, all phenomena can be, in principle, cap-tured in MD simulations. Only long time processes cannot be followed. MD simulations are based upon the resolution of Newton equations of motion. So for an ensemble of N atoms or molecules, the positions, ve-locities and acceleration are always known[22,23]. If dissipation occurs, through friction terms for example, Langevin-like equations have to be solved. For simplicity, we consider the cases for which Newton's equa-tions of motion are valid. They can be written:
∂2→r ið Þt ∂t2 ¼ 1 mif →
i; with the force f → i¼− ∂ ∂r→V r → 1ð Þ; rt →2ð Þ;t ⋯; r→Nð Þt % & : ð5Þ
The only information necessary to solve this set of N equations of motion is the potential energy. Resolution of these equations is carried out using stable algorithms as Verlet velocity scheme[22]. Statistical in-formation and materials properties can be deduced by averaging over all trajectories and compared directly to experiments.
2D MD simulations are carried out for exploring the behavior of Si trench filling during MS deposition of Al. The 2D simulation box is 240 Å wide. The width of the trench, w, is 160 Å. The trench depth, d, varies from 40 to 360 Å, leading to AR being equal to 0.25, 0.5, 1.0, and 2.0. The incident angle, α, is 45°; the value is chosen for describ-ing the effect of oblique incidence (seeFig. 3). Given that there is no ve-locity dispersion (a Maxwell–Boltzmann distribution is used), the effect will be reinforced. The substrate rotation is simulated by alternately changing the direction of the initial velocity after a number of atoms [0 (no rotation), 2, 100, and 200 atoms], has been released towards the surface; the number of atoms defines the rotation period, τrot. This
is repeated as long as all atoms have been released.
For carrying out these simulations, we consider the following Lennard–Jones interaction potentials
Vij%rij&¼ 4ε σ rij !12 − rσ ij !6 " # ; ð6Þ
for which rijis the interatomic distance. The potential parameters for
Al–Al, Si–Si and Al–Si are summarized inTable 3. Note that Al–Si parameters are obtained from the Lorenz–Berthelot mixing rule: εAB= (εAεB)1/2and σAB= (σA+ σB) / 2[24].
3200 Al atoms are released each 2 ps towards the 2D patterned sub-strate. This corresponds to about 180,000 atoms for a MD simulation in a 3D patterned substrate. Energy dissipation is simply temperature
accommodation when the scalar product of the force with the velocity is negative (F→⋅ v→
b0): The deposited atoms are reset to a velocity ran-domly sampled in a Maxwell–Boltzmann distribution at the surface temperature, Ts. This is valid when the thermal dissipation time, tR, is
short. This relaxation time is calculated 1.69 ps following the procedure described by Hou et al.[28]. The energy dissipation is expected to occur through a friction-like mechanism between the impinging atom and the substrate electron bath.
The initial positions of the atoms are randomly selected at the height 80 Å above the trench top. Two largely different values of ini-tial kinetic energy, Ek, are considered (0.026 eV and 1 eV), for clearly
identifying its role in the growing film. The first value corresponds to a thermalized sputtered flux (high pressure or large target to sub-strate distance, 4 Pa at 11 cm for example, while the second one corresponds to lower pressure or lower distance, 1 Pa at 11 cm for example). Monokinetic velocity distribution is considered, which is a suitable assumption for deposition on small, compared to target size, area substrates or for large enough target to substrate distances. Two surface temperatures are considered, 300 K and 473 K. The last one is a typical surface temperature during sputter deposition when the substrate temperature is not controlled.
4. Results and discussion
4.1. Investigation of surface kinetics during MOCVD of Al into micro-trenches
The aim of the modeling effort in the case of Al MOCVD in micro-trenches is to estimate SE,DMEAA[see Eq.(3)] by comparing
the measured (experimental) film conformity with the conformity predicted by the modeling framework [see Eq.(1)].
The value of SE,DMEAAis between 0 and 1. To estimate the order of
magnitude of SE,DMEAA, a simple calculation is performed based on the
values of the deposition rate and the maximum flux of DMEAA arriving on the surface. By substituting the values of AWAl, ρAl, and NAin Eq.(3),
SE,DMEAAis
SE;DMEAA¼ 6:027 ( 1028 DRAl ΓDMEAA
ð7Þ
ΓDMEAAcan be approximated by the following equation
ΓDMEAA¼
QDMEAA kBT0
1
πD2=4; ð8Þ
where QDMEAAis the flow rate of DMEAA in the reactor (Pa m3/s), kBis
the Boltzmann constant and T0(298 K) is the reference temperature for
QDMEAA. D is the diameter of the inlet (m). The values of QDMEAAand D
are 0.00327 Pa m3/s (2 sccm) and 0.06 m respectively. From Eq. (8),
ΓDMEAAis calculated equal to 2.8 × 10²⁰molecules/(m2s). This value
cor-responds to the flux of DMEAA entering the reactor; it is the maximum value as we consider no loss of DMEAA, either by gas phase reactions (it is known that there is some consumption of DMEAA in the gas phase[5,8]) or to the reactor walls. The average value of all the available measurements of Al deposition rate is about 5 × 10⁻¹⁰m/s. Thus, from
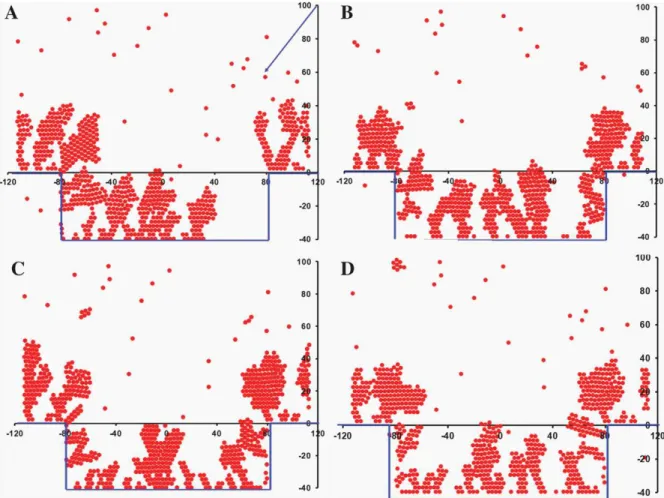
Eq.(7)the minimum value of SE,DMEAAis approximately 0.1. InFig. 4A and
B simulation results are shown for two values of SE,DMEAA(0.5 and 1). The
lower value of SE,DMEAAresults into greater number of reemissions and
Fig. 3. Geometry of the MD simulation deposition.
Table 3
Parameters of the Lennard–Jones interaction of Al and Si.
σ (Å) ε (eV)
Al–Al interaction[25] 2.62 0.39 Al–Si interaction[24,26,27] 3.223 0.083
better redistribution of flux inside the features. As a consequence, lower SE,DMEAAresults into greater values of Cband Cs.
For each condition ofTable 1, the film conformity in micro-trenches with varying initial AR was measured from SEM images and calculated by the modeling framework. Given that Cband Csare changing as
de-position proceeds, the comparison of the results is performed when Tt(seeFig. 1A) for the measurement and the simulation are equal.
Before proceeding to the results a note should be made on the use of the ballistic model (seeSection 3.1.1). The ballistic model has been used in cases where Knudsen number (Kn) is greater than 1; the greater the Kn the better the results of the ballistic model are. The pressure conditions of the experiments and the dimensions of the trenches set the flow in trenches either in the molecular or in the intermediate (be-tween molecular and viscous where 0.01≤ Kn ≤ 1)[29]regime. Even if the best solution would be to solve the Boltzmann equation[30,31], we choose to use the ballistic model as the regime of the experiments is closer to molecular than viscous flow: The minimum Kn, which corre-sponds to the low AR trenches, is greater than 0.1 and increases as depo-sition proceeds. Additionally, the solution of the Boltzmann equation entails a higher computational cost than the ballistic model.
InFig. 5A and B, the conformity values for the sample patSi-04 (Table 1) versus the initial AR of the trenches are shown. While the experimental data for Cbare rather scattered and follow none of the
simulation curves (Fig. 5A), Csis well described for SE,DMEAAbeing
equal to 0.5 (Fig. 5B). For the comparison of the simulation with the experimental results one should take into account the experimental error in the measurement of conformity due to the roughness (see the rough Al profile inFig. 1B), and the slight slope of the sidewalls; both the roughness and the sidewall slope are not taken into account in the model.
In Fig. 6, the same results with Fig. 5 are shown for sample patSi-05. Cb can be predicted well when SE,DMEAA is equal to 0.1,
while Cs can be predicted when SE,DMEAAis between 0.25 and 0.5.
From both the results for Cband Cs, SE,DMEAAis estimated lower compared
to patSi-04. It seems, as the wafer temperature is the same for both patSi-04 and patSi-05, that the change of the pressure (from 5.82 to 9.33 kPa, seeTable 1) affects SE,DMEAA. The effect of pressure on SE, DMEAAcan be attributed to a change on the surface condition, i.e. change
of the surface coverage, caused by the change of the species fluxes arriv-ing on the surface. This effect implies surface kinetics that depends on the condition of the surface, i.e. a Langmuir–Hinshelwood or Eley–Rideal surface reaction kinetics. The latter implication is reinforced by the dif-ference of SE,DMEAAat the bottom compared to the sidewall.
A
B
Fig. 4. Simulated 2D cross section of the deposited film when A) SE,DMEAA= 0.5 and
B) SE,DMEAA= 1.
A
B
Fig. 5. A) Cband B) Csvs. the initial AR of the trench for the film deposited under the
conditions defined by patSi-04 (seeTable 1). Experimental measurements[2]and simulation results (for SE,DMEAA= 0.5, 1.0) are shown.
A
B
Fig. 6. A) Cband B) Csvs. the initial AR of the trench for the film deposited under the
conditions defined by patSi-05 (seeTable 1). Experimental measurements[2]and simulation results (for SE,DMEAA= 0.1, 0.25, 0.5, 1.0) are shown.
The sensitivity of Cband Cson uncertainties of the source terms of
the ballistic model is tested through a series of runs and is presented inAppendix A.
4.2. The effect of AR and surface temperature on Al PVD into micro-trenches InFig. 7, the effect of rotating the substrate is presented. 800 atoms are launched with energy 0.026 eV while the surface tempera-ture is 300 K. In all conditions, the Al growth is columnar and grains are meandering. In all simulations described below the sticking coef-ficient is calculated to be close to 0.6.
Without rotation (Fig. 7A), the shadowing at the sidewall is clearly visible and the columns are tilted along the velocity direction but with a smaller angle than 45° as predicted by D. J. Srolovitz et al.[32]
The tilt angle, β, of the growing columns versus the incidence angle, α, is given by the equation[32]
β¼ α− sin−1 1− cosα 2
+ ,
: ð9Þ
According to Eq.(9), β is equal to 36.5° for an angle of incidence equal to 45°. At the highest possible rotation frequency (where τrotis 2),
the growing columns are almost always vertical, while for lower rotation frequency, the column tilt becomes more pronounced. At the center, vertical columns are remaining. The sidewalls are always coated with tilted columns. Moreover, increasing rotation period leads to a growing bump in the trench center (Fig. 7C and D).
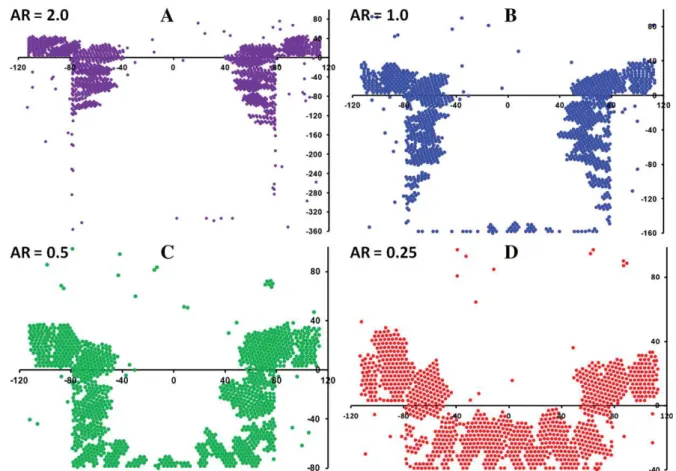
Fig. 8presents the snapshots for deposition of 3200 Al atoms onto trenches with different AR (2.0, 1.0, 0.5, and 0.25). For the largest AR (2.0) bad trench filling is observed (Fig. 8A). Due to the incidence
angle (α = 45°), the bottom of the trench is accessible by atoms only due to their diffusion. A remarkable behavior is the nearly hori-zontal growth of the columns (only slightly tilted) close to the trench top corners. These columns are progressively shadowed as we move from the top to the bottom corner on the sidewall. The experiments always display tilted columns on sidewalls. This quasi-horizontal growth, which does not occur in our experiments, originates from the pronounced shadowing occurring on such narrow trench: This is a fortuitous effect of competition between vertical growth on the top surface and the tilted growth on the sidewall. Indeed, the inner columns are a little bit more tilted. When reducing to lower AR (1.0), a low angle tilted structure is developed at the sidewall top edges (Fig. 8B). Shadowing effect is observed as we move from the top to the bottom corner on the sidewall. In the bottom center, small clusters are growing. They originate from sidewall reflections or surface diffu-sion: Only sidewall bottoms are directly accessible for α equal to 45° and AR equal to 1.0 (square trench cross-section).
For AR equal to 0.5 (Fig. 8C), trench sidewalls display tilted col-umns with a growing angle equal to about 40°, which is close to the values calculated by Eq.(9). Conformal coverage is almost accom-plished. Nevertheless, a smaller deposition rate is observed at the bottom center. The best conformal coverage is obtained for AR equal to 0.25 (Fig. 8D); large grains are formed. These grains are tilted on the sidewall and are vertical at the center. The tilt angle β varies between 30° and 40° in agreement with Eq.(9)and the experimental results of MS deposition inSection 2.
Fig. 9is reporting the evolution of deposited film morphologies versus substrate temperatures (300 K and 473 K) and impinging kinet-ic energies (0.026 eV and 1.00 eV). The rotation period is 200, AR is 0.5 and the number of launched atoms is 3200.
Fig. 7. Snapshots of the Al deposition on Si trenches at different rotation period. A) τrot= 0, B) τrot= 2, C) τrot= 100, and D) τrot= 200. 800 atoms are launched, AR = 0.25, Ts=
Fig. 8. 2D MD simulations of Al deposition on Si trenches with AR equal to A) 2.0, B) 1.0, C) 0.5, and D) 0.25. 3200 atoms are launched. Ts= 300 K, Ek= 0.026 eV, τrot= 200.
Fig. 9. 2D MD simulations of Al deposition on Si trenches with AR equal to 0.5. 3200 atoms are launched and τrot= 200. A) Ts= 300 K and Ek= 0.026 eV. B) Ts= 473 K and Ek=
Increasing Tsincreases diffusion and grain size is enlarged (Fig. 9A
and B). Accordingly, the center of trenches is missing atoms due to diffusion when increasing Ts or Ek(Fig. 9B and C). When only Ts
increases, grain morphologies remain rough. The increase of Ek
im-proves compactness leading to more rounded structures. Increasing Tsis less efficient for densifying the films than kinetic energy. When
both Tsand Ekincrease, the diffusion length is increased from 1 nm to
3 nm. The same behavior is verified for trenches with different AR (not shown in this work).
Most of the results obtained from the experiments are qualitatively reproduced by simply carrying 2D MD simulations. The rotation, aspect ratio, and kinetic energy effects are correctly described despite the dif-ference of the length scales between simulation and experiment. Includ-ing a time delay between injection of Al atoms (2 ps), which is larger than the calculated thermalization time (1.7 ps), is a good preliminary way for describing energy transfer on a reasonable time scale. But, in any case, this is not a true account of diffusion, while long time diffusion events cannot be taken at all into account in these MD simulations but also in any MD simulations.
5. Conclusions
Two different modeling approaches are implemented in the study of Al deposition in micro-trenches. The first approach is a feature scale framework; it consists of a ballistic model, a surface chemistry model, and a profile evolution algorithm, and is applied in MOCVD of Al. First order surface kinetics is considered where all surface reactions/processes are incorporated into one variable, the effective sticking coefficient of the precursor (DMEAA), SE,DMEAA. By comparison with experimental
mea-surements of conformity, SE,DMEAAis calculated in the range of 0.1 to 1.
SE,DMEAAdepends on the pressure and is not the same for the bottom
and the sidewall, which implies that it depends on the condition of the surface defined by the fluxes arriving on the surface; this dependence suggests Langmuir–Hinshelwood or Eley–Rideal kinetics[33] and not first order kinetics[8].
This case demonstrates the benefit of studying film deposition mechanisms in trenches and generally on surface features. None of the conclusions above could have been extracted if the experimental results had been referred to flat surface deposition.
In the second approach, MD simulations are carried out for describ-ing evolution at the atomic scale of magnetron sputtered Al films into Si trenches. While dynamics at the micrometer scale is not reachable by MD, the simulations at the atomic (nanometer) scale well reproduce the experimental features. This is possible because using the correct AR is sufficient for capturing the essential physics of shadowing and dif-fusion effect. Moreover difdif-fusion length is smaller than feature sizes and thus there are no size effects. The sticking coefficient of Al is calculated 0.6 by MD simulations. The periodic change of the incident velocity orientation can reproduce the effects of the experimental rotation: tilted growth, bump at the trench center. The tilt angle of the Al columns on the sidewall of the trench evolves accordingly to the theoretical pre-dictions[32]. The temperature effects and the kinetic energy effects are compared; the kinetic energy is found to shown to better influence the compactness of the films.
The two frameworks which are used for the study of Al deposition mechanisms are based on different methodologies. The first is deter-ministic (consists of a set of partial differential and integral equations) and uses a continuum representation of the deposited film profile. The second is based on MD simulation methods, i.e. it is a particle method and uses a discrete representation of the surface (i.e. ordered atom stacking as inFig. 3). The two frameworks can be complementary in the study of CVD and PVD deposition mechanisms. The first framework is suitable for studying surface kinetics in CVD, but it cannot capture the roughness of the deposited film. With the second framework the sur-face roughness on the deposited film can be described and it is more
suitable for PVD than CVD cases. The incorporation of chemical reaction kinetics is easier in the first framework.
The outcome of the study shows that the sticking coefficient under the conditions of the experiments is high (greater than 0.1 for MOCVD and about 0.6 for MS). A lower sticking coefficient should be achieved by both MOCVD and MS processes for conformal coverage. The sticking coefficient which is required for conformal coverage depends on the AR of the features: The greater the AR, the lower the sticking coefficient required.
Acknowledgments
Part of this work was performed in the frame of the CNRS research group “SurGeCo” #3184.
Appendix A. Sensitivity analysis for the ballistic model
The sensitivity of Cband Cs(ballistic model outputs) on
uncer-tainties of the source terms of the ballistic model is tested through a series of runs at specific conditions. The source terms of the ballistic model are the surface kinetics, and in particular the effective sticking coefficient, SE, as well as the shape of the initial trench. The values of
SEare changed by ±20% and the uncertainty on the shape of the initial
trench is expressed by a 4ochange in the sidewall slope and a ±20%
change in the AR of the initial trench.
InFig. A.1A, Cband Csare shown versus AR for different values of
SE[0.5, 0.4 (−20%), 0.6 (+20%)]. The % absolute change of Cband Cs,
A
B
Fig. A.1. A) Cband Csvs. AR for different values of SE[0.5, 0.4 (−20%), 0.6 (+20%)].
Additional curves for Cband Csvs. AR are shown for a case where the sidewall slope
of the initial trench is 86° instead of 90° (see inset); SEin this case is 0.5. B) Cb(left
part) and Cs (right part) for three different values of AR [0.5, 0.4 (−20%), 0.6
(+20%)] at three different values of SE(0.4, 0.5, and 0.6). In all cases, Cband Csare
calculated at the instant where the film thickness at the top (TtinFig. 1A) is 25% of
the trench width. The sidewall slope of the initial trench is 90° except in cases where it is otherwise mentioned.
due to the uncertainty of SE, increases as AR increases. The absolute
change of Cb(Cs) is less than 7.5% (13.5%) for AR ranging from 0.3
to 0.9. InFig. A.1A the effect of the sidewall slope of the initial trench on Cb and Cs is also demonstrated. The uncertainty on the slope
affects only Cs: The maximum absolute change of Csis less than 4.5%.
InFig. A.1B, Cband Csare shown for three different values of AR
[0.5, 0.4 (−20%), 0.6 (+20%)] at three different values of SE (0.4,
0.5, and 0.6). The effect of the uncertainty on AR is enhanced slightly at greater values of SE. The maximum absolute change is less than 8.5%
for Cband less than 5.7% for Cs.
References
[1] A.-L. Thomann, C. Vahlas, Chem. Vap. Depos. 17 (2011) 274.
[2] A.L. Thomann, C. Vahlas, L. Aloui, D. Samelor, A. Caillard, N. Shaharil, R. Blanc, E. Millon, Chem. Vap. Depos. 17 (2011) 366.
[3] Y. Liu, L. Overzet, M. Goeckner, Thin Solid Films 515 (2007) 6730. [4] Y. Liu, L. Overzet, M. Goeckner, Thin Solid Films 510 (2006) 48. [5] T.W. Jang, W. Moon, J.T. Baek, B.T. Ahn, Thin Solid Films 333 (1998) 137. [6] B.Y. Kim, X.D. Li, S.W. Rhee, Appl. Phys. Lett. 68 (1996) 3567.
[7] J.H. Yun, B.Y. Kim, S.W. Rhee, Thin Solid Films 312 (1998) 259.
[8] T.C. Xenidou, N. Prud'homme, C. Vahlas, N.C. Markatos, A.G. Boudouvis, J. Electrochem. Soc. 157 (2010) D633.
[9] T.C. Xenidou, A.G. Boudouvis, N.C. Markatos, D. Samelor, F. Senocq, N. PrudHomme, C. Vahlas, Surf. Coat. Technol. 201 (2007) 8868.
[10] G.H. Gilmer, H. Huang, T.D. De La Rubia, J.D. Torre, F. Baumann, Thin Solid Films 365 (2000) 189.
[11] G. Kokkoris, A. Tserepi, A.G. Boudouvis, E. Gogolides, J. Vac. Sci. Technol. A 22 (2004) 1896.
[12] G. Kokkoris, A.G. Boudouvis, E. Gogolides, J. Vac. Sci. Technol. A 24 (2006) 2008. [13] S. Osher, R.P. Fedkiw, Level Set Methods and Dynamic Implicit Surfaces, Applied
Mathematical Sciences, vol. 153, Springer, New York, 2003.
[14] J.A. Sethian, Level Set Methods and Fast Marching Methods, 2nd ed., Evolving Interfaces in Computational Geometry, Fluid Mechanics, Computer Vision, and Materials ScienceCambridge University Press, Cambridge, 1999.
[15] N. Cheimarios, G. Kokkoris, A.G. Boudouvis, Chem. Eng. Sci. 65 (2010) 5018. [16] T.S. Cale, T.H. Gandy, G.B. Raupp, J. Vac. Sci. Technol. A 9 (1991) 524.
[17] T.S. Cale, V. Mahadev, in: S. Rossnagel, A. Ulman (Eds.), Modeling of Film Deposition for Microelectronic Applications, Thin Films, vol. 22, Academic Press, 1996, p. 203. [18] B. Abraham-Shrauner, J. Vac. Sci. Technol. B 19 (2001) 711.
[19] B. Abraham-Shrauner, W.J. Chen, J. Vac. Sci. Technol. B 14 (1996) 3492. [20] V.K. Singh, E.S.G. Shaqfeh, J.P. McVittie, J. Vac. Sci. Technol. B 10 (1992) 1091. [21] J.S. Han, K.F. Jensen, Y. Senzaki, W.L. Gladfelter, Appl. Phys. Lett. 64 (1994) 425. [22] D.B. Graves, P. Brault, J. Phys. D: Appl. Phys. 42 (2009) 194011.
[23] D. Frenkel, B. Smit, Understanding Molecular Simulation: From Algorithms to Applications, Academic Press, San Diego, 1996.
[24] P. Brault, A.L. Thomann, C. Andreazza-Vignolle, P. Andreazza, Eur. Phys. J. Appl. Phys. 19 (2002) 83.
[25] T. Halicioglu, G.M. Pound, Phys. Status Solidi (a) 30 (1975) 619. [26] L.Z. Zhang, S.Y. Jiang, J. Chem. Phys. 117 (2002) 1804. [27] H. Zhang, Z.N. Xia, Nucl. Instr. Meth. B 160 (2000) 372.
[28] Q. Hou, M. Hou, L. Bardotti, B. Prevel, P. Melinon, A. Perez, Phys. Rev. B 62 (2000) 2825.
[29] A. Roth, Vacuum Technology, North-Holland, 1990. [30] M.K. Gobbert, T.S. Cale, J. Comput. Phys. 213 (2006) 591. [31] M.K. Gobbert, T.S. Cale, Surf. Coat. Technol. 201 (2007) 8830. [32] L. Dong, R.W. Smith, D.J. Srolovitz, J. Appl. Phys. 80 (1996) 5682. [33] E.M. Mc Cash, Surface Chemistry, Oxford University Press, New York, 2001.


![Fig. A.1. A) C b and C s vs. AR for different values of S E [0.5, 0.4 ( −20%), 0.6 (+20%)].](https://thumb-eu.123doks.com/thumbv2/123doknet/3523831.103104/9.892.515.762.564.1032/fig-a-a-c-and-ar-different-values.webp)
