DÉVELOPPEMENT DE SUBSTRATS MACROMOLÉCULAIRES UTILISÉS POUR DES ÉTUDES DE MICROSCOPIE ÉLECTROCHIMIQUE À BALAYAGE
MÉMOIRE PRÉSENTÉ
COMME EXIGENCE PARTIELLE
DE LA MAÎTRISE EN CHIMIE (OPTION BIOCHIMIE)
PAR
ISABELLE BEAULIEU
Avertissement
La diffusion de ce mémoire se fait dans le respect des droits de son auteur, qui a signé le formulaire Autorisation de reproduire et de diffuser un travail de recherche de cycles supérieurs (SDU-522 - Rév.01-2006). Cette autorisation stipule que «conformément à l'article 11 du Règlement no 8 des études de cycles supérieurs, [l'auteur] concède
à
l'Université du Québec à Montréal une licence non exclusive d'utilisation et de publication de la totalité ou d'une partie importante de [son] travail de recherche pour des fins pédagogiques et non commerciales. Plus précisément, [l'auteur] autorise l'Université du Québec à Montréal à reproduire, diffuser, prêter, distribuer ou vendre des copies de [son] travail de recherche à des fins non commerciales sur quelque support que ce soit, y compris l'Internet. Cette licence et cette autorisation n'entraînent pas une renonciation de [la] part [de l'auteur]à
[ses] droits moraux nià
[ses] droits de propriété intellectuelle. Sauf entente contraire, [l'auteur] conserve la liberté de diffuser et de commercialiser ou non ce travail dont [il] possède un exemplaire.))leur supervision lors de ce projet. Prof. Borhane Annabi pour l'accessibilité à son matériel de recherche. Dr Dimitre Karpuzov pour les analyses XPS. Marie-Josée Crevier et Michel Marion pour leur aide en culture cellulaire ainsi qu'à toute l'équipe technique du département de chimie de l'UQÀM.
Je tiens à remercier toutes les personnes ayant contribué à l'élaboration de ce mémoire. D'abord, à mes collègues du laboratoire Mauzeroll, pour votre aide, spécialement à Danielle Dansereau pour tes précieux conseils. Janine, merci de m'avoir donné la chance de travailler avec toi, même si je ne connaissais absolument rien de l'électrochimie. À mes amis, de m'avoir changé les idées dans les moments difficiles. Il ne faut surtout pas sous-estimer les pouvoirs du divertissement (vive le Comité Organisationnel d'Événements Mondains du 3e).
Finalement, à ma famille, papa, maman et Frédéric, merci de votre soutien constant, sans vous, rien de tout cela n'aurait été possible.
LISTE DES ABRÉVIATIONS, SIGLES ET ACRONyMES ix
LISTE DES SyMBOLES x
RÉSUMÉ xii
INTRODUCTION 1
CHAPITRE I
CHAPITRE DE LIVRE: ELECTROCHEMICAL SENSORS AND THEIR USE IN CELL
STUDIES 6
1.1 Introduction 7
1.2 Basic Princip les ofUltramicroelectrodes 9
1.3 Ultramicroelectrodes in Ce]] Studies 13
1.3.1 Disc and Fiber UMEs 13
1.3.2 Electrochemical Micropipets 16
lA Biological Scanning Electrochemical Microscopy 18
104.1 Basic Priciples of SECM 18
1.4.2 Biological Scanning Electrochemical Microscopy (Bio-SECM) 19
104.3 Constant-Distance Feedback ControJJers 20
1.5 Biomaterial Design: Cell Patterns Used in Bio-SECM 21
1.5.1 Microfluidic Systems for Cell Patterning 21
1.5.2 HeLa Cell Patterns 25
1.5.3 Fluorescence-Based Cell Status Assay 26
1.6 Conclusions 28
1. 7 References 047
CHAPITRE JI
AND ZEONOR SUBSTRATES FOR ADHESION OF PATTERNED CELLS 55
2. J Introduction 58
2.2 Experimental Section 60
2.2. J Preparation of Plastic Substrates 60
2.2.2 Surface Characterization 60
2.2.3 Fabrication of Microcapillary Systems 61
2.2.4 Patterning of Cells 61
2.2.5 Biocompatibility Tests 62
2.2.6 Optical and Fluorescence Imaging 62
2.2.7 Flow Measurements 63
2.3 Results and Discussion 63
2.3.1 Surface Analysis 63
2.3.2 Biocompatibility 65
2.3.3 Adhesion and Cel! Growth on Plasma-Treated Surfaces 66
2.3.4 Cell Pattern Formation 67
2.4 Conclusion 68
2.5 References 81
CONCLUSION 84
APPENDICE A
INVITATION À CONTRIBUER À L'ÉCRITURE D'UN CHAPITRE DE LIVRE 86 APPENDICE B
PERMISSIONS D'UTILISATION ET DE MODIFICATION DE MATÉRIEL AVEC
DROIT D'AUTEUR 88
APPENDICE C
I.1 Microscopie électrochimique à balayage pour laquelle l'électrode se déplace (A) en mode hauteur constante (SECM) et (8) en mode distance constante
(Bio-SECM) 2
1.2 Cellule électrochimique contenant une lame de plastique sur laquelle des cellules sont immobilisées selon un tracé déterminé. (1) vue latérale (2) vue de haut. 3 1.1 Diffusion occurring at an electrode. A) Linear diffusion to a large planaI' disk
electrode. B) Hemispherical diffusion to a planaI' disk UME 31 1.2 A) Local amperometric detection of single-vesicle adrenaline released from an
individual bovine chromaffin cel!. A carbon-fiber disk ultramicroelectrode (Cf UME, 5 mm in diameter, polarized to +800 mV vs. Ag/AgCI) was directly placed above the center of a single bovine chromaffin cell at a distance of < 1 /lm. B) When the selected cell was stimulated with 100 mM KCl solution, exocytosis was initiated and detected by the appearance of spikes in the amperometric UME
current. .32
1.3 SEM images of the ends of A) bare and B) insulated carbon fibers that are 10 /lm
in diameter. 33
1.4 Voltammograms of fcCH10H oxidation at a 112-nm platinum tip obtained in
bulk solution (curve 1) and inside a human breast epithelial (MCf-IOA) cell
(curves 2-5) .34
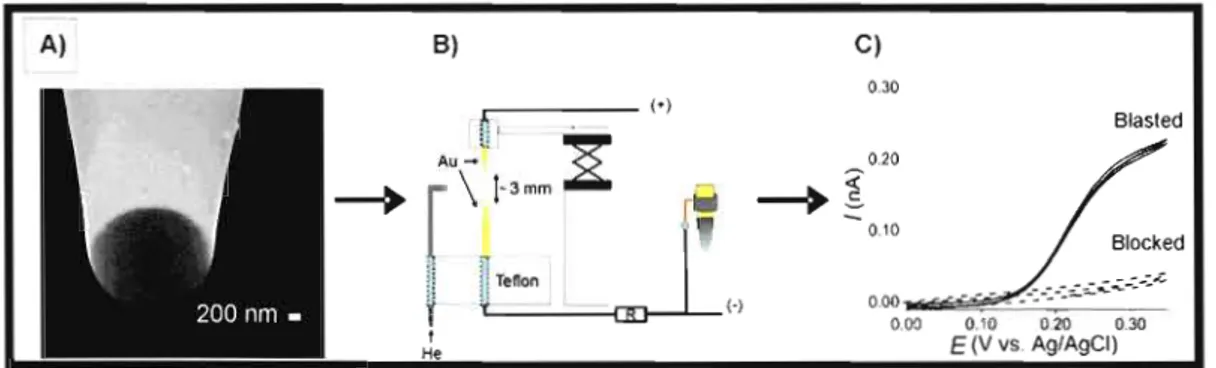
1.5 SEM images of the ends of A) a gold-coated pulled borosilicate micropipet and B) an insulated 70-nm-thick gold ring micropipet. .35 1.6 Removal ofblocking polymer layers from a microelectrode. A) SEM image of
the end of a blocked gold ring micropipet. The insulating material, a thin layer of cathodic electrophoretic paint (Cathodip™ ft83-0250, BASf) covers both sidc walls and ring face of the micropipet. B) Schematic representation of the experimental setup used for blasting the polymer layer off the ring-shaped
electrode surface 36
1.7 A,B) Optical micrographs (survey and close-up view) of a pu lied micropipet attached to a Giant Unilamellar Vesicle (GUV) which is composed of 1,2-dioleoyl sn-glycero-3-phosphocholine (DOPC), ubiquinone-IO and l-acyl-2-[(2-nitrobenz-2 oxa-I ,3-diazol-4-yl)aminostearoyl]-sn-glycero-3-phosphocholine (NBD-PC). C) Input square-wave applied to the micropipet used to patch on the GUV. D) A
patch of the micropipet onto the GUV typically results in an increase of the
micropipet resistance (G.Q) 37
1.8 The electrochemical reaction of dissolved reversible redox species (0 and R, respectively) at the UME/solution interface is mass transfer Iimited, at least for potentials far exceeding the redox potential of O. The localized hemispherical diffusion zone in front of the UME is used to detect topography and/or reactivity
of a nearby surface 38
1.9 A) Schematic presentation of an SECM line scan over immobilized cells in constant height and constant distance mode. B) 1nstlUmentai design of a
Bio-SECM. C) Detection principles of selected constant distance controllers 39
1.10 SECM imaging of irnmobilizcd cells AO
l.11 Fabrication and use ofPDMS-based microfluidic devices. A) Printing a CAD file onto a transparency foil constitutes a convenient and generally accessible way to generate a photomask. B) A master is fabricated by contact mode optical lithography. The mask is placed onto a thin film of photoresist (e.g., SU-8) formed by spin-coating on a silicon substrate. When illuminated with UV light, crosslinking of the photoresist is induced within the transparent windows of the mask, making exposed regions of the resist become insoluble in an organic medium that is used for development. C) The photoresist pattern is transferred into a layer of PDMS by replica molding. In this process, Iiquid pre-polymers of PDMS are poured onto the master, cured thermally, and peeled away AI 1.12 Patteming of cells in microfluidic environments. A) Design of a simple ~LCS
for linear arrangement of cells. B) Optical micrograph of a 400-~m-wide
microchannel in contact with a Zeonorr~ substrate during filling with a HeLa cell cell suspension. C) Pattern of HeLa cells on a plastic support obtained by incubating the suspension with a Zeonor(~ substrate at 37 oC in a 5% CO2
atmosphere saturated in water for 5 h A2
1.13 Scheme of a cell undergoing apoptotic or necrotic processes .43 1.14 Schematic illustration of lipid asymmetry loss in an apoptotic cell. A4
1.15 Simplified scheme of a double stranded DNA structure .45
1.16 Fluorescence-based cell status assay A6
2.1 Surface topography of Zeonor 1060R substrates as revealed by AFM
measurements , 70
2.2 XPS survey spectra of PS and Zeonor 1060R substrates treated with O2
2.3 High resolution spectrum ofthe C ls signal ofZeonor 1060R treated with O2
plasma at 100 W/sccm taken after 20 days upon exposure 72 2.4 Necrotic and apoptotic cell death induced by Triton X-IOO (0.075%) or tribultyltin
(2.0 J1.M), respectively as revealed by fluorescence microscopy 73 2.5 Biocompatibility of Zeonor and PS substrates as determined by fluorescence
microscopy 74
2.1 Wetting Properties of PS Surfaces as a Function of Plasma Power. 76 2.2 Wetting Properties of Zeonor Surfaces as a Function of Plasma Power. 77 2.3 Atomic Concentration of Plasma-Treated Zeol1or and PS Surfaces as determined
by XPS Measurements 78
2.4 Percentage of Cell Confluency on Zeonor Surfaces as a Function of Plasma
Power. 79
CV AFM ATP Bio-SECM CCD CAD CF DNA DC FcCH20H NSOM PDMS PS SEM SECM SCCM SCLM STM UME UV XPS
Atomic force microscopy, Microscope à force atomique Adénosine triphosphate
Biological scanning electrochemical microscopy, Microscopie électrochimique à balayage biologique
Charge coupled device, Dispositif à transfert de charges Computer-aided design, Conception assistée par ordinateur Carbon fiber, Fibre de carbone
Cycle vo]tammetry, Voltampérométrie cyclique
Deoxyribonucleic acid, Acide désoxyribonucléique (ADN) Direct current, Courant continu
l-(ferrocenyl)methanol ou Ferrocène méthanol
Near-field scanning optical microscopy, Microscopie optique en champ proche
Polydiméthylsiloxane Phosphatidylsérine
Scanning electron microscopy, Microscopie électronique à balayage Scanning electrochemical microscopy, Microscopie électrochimique à balayage
Standard Cubic Centimeters per Minute, Débit en centimètre cube par minute d'un gaz ramené à la pression atmosphérique
Scanning chemiluminescence microscopy, Microscopie de chimioluminescence à balayage
Scanning tunnclling microscopy, Microscopie à balayage à effet tunnel Ultramicroêlectrode
Ultraviolet
X-Ray photoelectron spectroscopy, Spectroscopie des photoélectrons en rayons X
c Concentration de l'espèce électroactive (mol/m )
Iles
Microcapillary system, Système microcapillairedc
o Variation de concentration de l'espèce 0D Coefficient de diffusion de l'espèce électroactive en solution (m2/s) Do Coefficient de diffusion de l'espèce 0 (m2/s)
D Depth, Profondeur (m)
M 1/2 Variation du potentiel à demi-vague (V)
F Constante de Faraday (96,48534 x 10³ C/mol) où C
=
Coulombs1 Intensité du courant (A) -'
l,s Intensité du courant de l'état stationnaire (A) Jo Densité de flux de l'espèce 0 (mol/(s-m2)
n Nombre d'électron
M Difference de pression (Pa) où Pa = Pascals
Q Débit de liquide (mJ/s)
r Rayon de la sonde électroactive (m)
R Résistance (Q) ou Résistance à l'écoulement (Pa s/mJ)
Ri Potentiel de chute ohmique (V)
Position de l'espèce 0 dans le temps (s) x Position de l'espèce 0 dans l'espace (m)
w Largeur (m)
v
2Épaisseur de la couche de diffusion (m) Pi, Constante d'Archimède (3,141592) Longueur d'onde d'excitation (nm) Longueur d'onde d'émission (nm)
nouvelle méthode analytique est en émergence et elle est intéressante puisqu'elle permet des études électrochimiques appliquées aux systèmes biologiques, comme des cellules cancéreuses. Pour se faire, les cellules biologiques doivent être immobilisées sur des plastiques biocompatibles fonctionnalisés de façon à ce que les cellules soient disposées en ligne droite. En effet, si les cellules ont toujours la même disposition, la localisation par l'électrode est plus facile et rapide. Il s'agit donc d'un projet multidisciplinaire réunissant la biologie (culture cellulaire), la toxicologie et la chimie de surface. Afin de s'assurer de l'adhésion cellulaire, les surfaces de 2 plastiques, le Zeonor® 1ü6üR et le polystyrène, sont modifiées par un traitement au plasma d'oxygène. Ceci permet l'ajout de groupements fonctionnels polaires contenant au moins un atome d'oxygène ce qui charge la surface et la rend hydrophile. Afin de vérifier si le traitement est efficace, des mesures d'AFM, de XPS et d'angles de contact sont effectuées. Ensuite, pour s'assurer de la biocompatibilité des surfaces, la vérification de l'état cellulaire est faite par microscopie à fluorescence en uti 1isant 3 fluorophores: l'Alexa fluor 488 couplé à l'Annexin V (début d'apoptose), le Hoechst 33258 (apoptose avancée) et l'iodure de propidium (nécrose). Enfin, l'adhésion de cellules alignées est faite grâce à des méthodes de lithographie, soit la photolithographie et la lithographie molle. Ces procédés permettent d'obtenir un moule de PDMS contenant des canaux microfluidiques dans lesquels les cellules sont injectées. Les principaux résultats montrent que les deux plastiques peuvent devenir hydrophiles suite au traitement au plasma puisqu'ils présentent des groupements carboxyliques et hydroxyliques à leur surface. Aussi, ils sont biocompatibles et même si la division cellulaire semble plus efficace sur le polystyrène, le Zeonor permet de former des lignes de cellules pouvant servir aux analyses électrochimiques.
biologiques difficilement exécutables auparavant. D'abord, l' AFM a permis, entre autre, d'observer la force inductrice du déploiement d'une protéine. I -3 Aussi, la STM peut être
utilisée pour imager des molécules comme l'ADN pour observer leur structure et leur conformation. 1.4 La technique d'intérêt dans le présent mémoire, est la SECM. Elle consiste à
approcher une électrode nano ou micrométrique à quelques microns de la surface pour mesurer les variations de courant qui dépendent de la réactivité surfacique. Cette technique a été employée pour étudier les systèmes biologiques pour les premières fois vers la fin des années 90.5-7 Elle offre différentes possibilités d'analyses, telle que le suivi de l'activité
respiratoire cellulaire8.9, la détection de neurotransmetteurs sécrétés par des vésicules 10,
l'étude de la diffusion transdermique de médicaments Il et l'évaluation de la cytotoxicité par
des mesures de viabilité ou par un suivi de l'expulsion de conjugués de détoxification I2.1l .
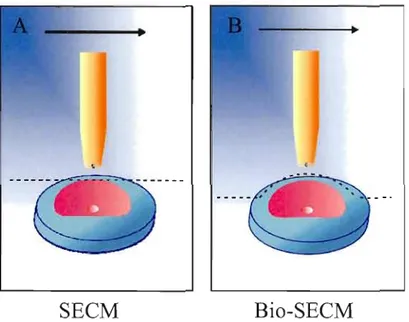
La SECM peut être utilisée en deux modes distincts, soit en hauteur constante ou en distance constante. Le premier mode est employé en SECM conventionnelle alors que l'électrode se déplace parallèlement au substrat sans tenir compte de sa topographie (Figure UA). Le désavantage de ce mode SECM est la difficulté de mesurer les variations de courant au-dessus des zones plus éloignées de l'électrode. En effet, puisque les espèces électrochimiques doivent diffuser sur une plus longue distance, elles sont diluées dans la masse de la solution avant d'être détectées par l'électrode. 11 est possible de contrevenir à ce problème en distance constante (Figure UB) puisque le mouvement de l'électrode dépend de la topographie du substrat permettant ainsi de 1imiter la perte de signal.
SECM
Bio-SECM
Figure 1.1. Microscopie électrochimique à balayage pour laquelle l'électrode se déplace (A) en mode hauteur constante (SECM) et (B) en mode distance constante (Bio-SECM).
Le déplacement de l'électrode est contrôlé d'un moteur à pas qui permet la correction de la pente du substrat dans les axes x et y et un autre qui assure le mouvement dans l'axe des z. La distance constante est maintenue grâce à un mécanisme de rétroaction basé sur des forces de cisaillements (shear forces). Cette composante donne la possibilité de s'approcher d'une cellule biologique sans l'endommager. Ce nouveau mode d'analyse donne naissance à la Bio SECM qui combine la SECM avec un microscope inversé à fluorescence donnant la possibilité d'observer les changements morphologiques de la cellule tout en faisant les analyses électrochimiques. Ce type de système a fait son apparition dans les années 2000 10 et
celui du laboratoire Mauzeroll est unique puisque la distance est modulée par la phase et non par l'amplitude, ce qui donne une meilleure limite de détection à l'appareiI 14•
Le caractère exclusif de l'appareil demande le développement de dispositifs pour pouvoir procéder aux analyses sur les systèmes biologiques. En effet les dimensions de la cellule électrochimique, dans laquelle les analyses doivent être effectuées, ne permettent pas l'insertion d'un pétri de culture cellulaire conventionnel. Les plus petits pétris actuellement disponibles commercialement ont un diamètre de 30 mm, hors la cellule électrochimique a un
diamètre de 25 nun. C'est pourquoi, le projet demande la fabrication de disque de plastiques moulés sur mesure (Figure 1.2).
Cellules immobilisées sur un plastique biocompatible 1 2 Vue de haut Cellule électrochimique
Figure 1.2. Cellule électrochimique contenant une lame de plastique sur
laquelle des cellules sont inunobilisées selon un tracé déterminé. (1) vue latérale (2) vue de haut
De plus, la taille de l'électrode la rend sujette à la désactivation due à l'adhésion des molécules en solution causant ainsi la passivation de la surface de détection. Cette limitation demande l'utilisation de solutions les moins complexes que possible. Cependant, pour recréer l'environnement physiologique nécessaire à la viabilité des cellules en culture, du sérum
bovin est habituellement ajouté au milieu. Seulement, les protéines qu'il contient sont fortement adhésives et c'est pourquoi elles ne doivent pas être présentes lors des analyses électrochimiques. Puisque le temps de survie des cellules est grandement diminué dans de telles conditions, il est nécessaire d'optimiser les analyses pour réduire la durée expérimentale. Pour ce faire, les cellules doivent être immobilisées sur les disques de plastiques de sorte que leur localisation soit facilitée. Ainsi, il est nécessaire que les cellules s'adhèrent de façon linéaire sur la surface toujours au même endroit afin de pouvoir positionner rapidement l'électrode. Ceci demande l'utilisation de techniques lithographiques telles que la photolithographie et la lithographie molle 15-17. Ces méthodes permettent la production de moules de PDMS contenant des canaux microfluidiques dans lesquelles les cellules peuvent être introduites. 18-21
Aussi, il est essentiel de s'assurer que les surfaces utilisées sont adéquates pour l'adhésion cellulaire. Les plastiques utilisés, le Zeonor@ 1ü6üR et le polystyrène, sont alors fonctionnalisés à l'aide de l'application d'un plasma d'oxygène. Ce traitement permet d'introduire des fonctions polaires telles que des carbonyles, des carboxyles et des hydroxyles. La nouvelle hydrophilicité des plastiques aide à l'introduction de la suspension cellulaire à l'intérieur des canaux microfluidiques en ayant recours aux forces de capillarité sans l'utilisation de pompe. Les cellules entrent dans le canal suite à leur injection et une fois adhérées à la surface, le moule peut être retiré et les cellules forment alors une ligne de la largeur du canal. Ainsi, les cellules peuvent être localisées visuellement, à l'aide du microscope et électrochimiquement grâce à l'électrode. La ligne de cellules peut être mise ~u
centre sous l'électrode en déplaçant le microscope en x et en y, puis les variations de courant sont détectés par l'électrode en la bougeant avec les moteurs du Bio-SECM dans les axes x, y et z.
Lorsque l'on fait de la culture cellulaire, il est important de s'assurer de la biocompatibilité de la sUlface sur laquelle les cellules sont déposées. Il s'agit d'un autre volet important du projet impliquant la microscopie à fluorescence. En effet, des fluorophores marquant les cellules en début d'apoptose, en apoptose avancée et en nécrose sont employés pour vérifier si les cellules sont toujours dans leur état normal ou si elles sont en train de
mourir. Il s'agit de l'Alexa fluor 488 couplé à l'Annexin V (début d'apoptose)22, le Hoechst 33258 (apoptose avancée)23 et l'iodure de propidium (nécrose)24.
Le présent mémoire inclut deux publications dont je suis la première auteure, le chapitre 1 intitulé « Chapitre de livre: Electrochemical Sensors and their Use in Cell
Studies » et le chapitre II : « Article scientifique: Oxygen Plasma Treatment of Po lystyrene
and Zeonor Substrates for Adhesion of Patterned CeUs ». Étant donné que le chapitre 1 comporte une grande partie théorique et une revue de littérature incluant un historique des travaux dans le domaine, le mémoire arbore une forme particulière. En effet, la théorie n'est pas répétée dans l'introduction pour éviter la redondance. Tel que stipulé dans l'Annexe 1 du Règlement nO 8, le chapitre comporte une partie contribuant à l'avancement de la science puisque plusieurs résultats expérimentaux y' sont présentés. De plus, le chapitre II accepté dans Langmuir est une continuité de la première publication. 11 s'agit d'un article traditionnel comprenant: résumé, introduction, section expérimentale, résultats et discussion, conclusion et références. Étant donné que les références du chapitre de livre et de l'article sont déjà présentes dans les publications, elles ne sont pas répétées dans la section référence du mémoire. Cette section incluse dans l'appendice C fait seulement état des références utilisées dans l'introduction.
STUDIES
Le chapitre de livre qui suit porte sur les sondes électrochimiques et leur utilisation dans les études cellulaires. Dans un premier temps, un survol de la littérature est présenté. Celui-ci inclut les principaux travaux de recherche qui sont à l'origine du développement du SECM ainsi que les études faites sur divers systèmes biologiques. Les avancements possibles dans le futur sont aussi énoncés. Par exemple, une meilleure compréhension du transport de molécules électroactives vers l'intérieur ou l'extérieur des cellules pourrait aider au développement de médicaments plus ciblés. Ensuite sont présentés: la théorie concernant l'électrochimie et l'étude de cellules, la fabrication des substrats biologiques et les tests de biocompatibilité par fluorescence. Finalement notre contribution technique et certains des résultats expérimentaux y sont décrits. En effet, le Bio-SECM étant unique au laboratoire Mauzeroll, les caractéristiques de l'appareil sont présentées. Ce système permet d'observer la morphologie des cellules grâce à un microscope à fluorescence au moment de faire les analyses électrochimiques à distance constante. Également, des résultats préliminaires de formation de lignes de cellules obtenues par lithographie molle y sont montrés. De plus, J'injection des cellules dans les canaux est faite sans ajout substantiel de molécules d'adhésion, contrairement à la pratique courante, seule leur présence naturelle dans le sérum étant mise à contribution. Ce chapitre sera présenté dans le livre intitulé « The Chemistry, Physics and Engineering of Responsive Mateials ».
Electrochemical Sensors and their Use in Cell Studies
Chapitre 10 dans The Chemistry, Physics and Engineering of Responsive Materials, Bratcher, M.S., Gaddy, G.A., Kiserow, D. et Maher, M.W. (éds); John Wiley and Sons Publishing; sous presse.
Isabelle Beaulieu, 1 Matthias Geissler,2 Danielle Dansereau l & Janine Mauzeroll l : 1 Chemistry Oepartment, Université du Québec à Montréal
, Institut des matériaux industriels, Conseil national de recherches du Canada • To whom corrcspondencc should bc addrcsscd: mauzcroll.janinc@u()al11.ca
1.1 Introduction
Electrochemical sensors have found widespread use in a broad range of scientific and technological areas where they are employed to monitor electrochemical processes (e.g., electron an'd ion transfer reactions) at interfaces, in solution, or in air. The central part of most electrochemical sensors is an ultramicroelectrode (UME) - an electrode having dimensions in the micro- or nanometer range. UMEs were first developed by Engstrom and co-workers l and subsequently integrated into scanning electrochemical microscopy (SECM) by Bard and co workers. 2 ln SECM, the UME serves as a mobile probe that enables electrochemical activity of a surface to be recorded with remarkable sensitivity, short response times, and high spatial resolution 3 Although the origins of SECM are in electroanalytical surface science, this technique has attracted increasing attention for biological application and the study of living organisms because it can i) quantify the flux of molecules entering or leaving a cell, ii) probe locally electrochemical reactions occurring at or inside a cell, and iii) perform the sa me measurements on single ceUs, cell features, confluent cells and tissues. Moreover, SECM measurements can be combined with other biosensing techniques, making it possible to perform multiple experiments on a living object simultaneously.
The abilities of SECM have been demonstrated in a number of ways. For example, bacterial redox activit/ and respirationS have both been probed. The first in vivo measurements on intact plants revealed topography and photosynthetic electron transport of a single guard cel1. 6 The metabolism of menadione was studied by measuring the glutathione
conjugated metabolite (thiodione) efflux in hepatocytes. 7 The influence of calcium ions on osteoclast activity was recorded to evaluate the reliability of in vitro models compared to in vivo activity.x White and co-workers accessed molecular transport in mouse skin using SECM, which allowed for quantification of the absolute flux rate through an individual pore.9 Following in vitro fertilization, the oxygen consumption of bovine embryos has been measured in a non-invasive manner, which was used to evaluate the quality of the embryos and their potential for further development. 1o Moreover, Ding and co-workers studied two kidney fibroblast-like cell lines with atomic force microscopy (AFM), confocal microscopy (CM) and SECM, thereby detecting reactive oxygen species (ROS) produced by living cellS. 11 Mirkin and co-workers were the first to measure the redox activity on a single mammalian cell. 12 Single-cell electrochemical behavior had previously been difficult to extract from measurements performed on confluent cells. By comparing fluorescence and SECM images of the same cells, selective detection of metastatic breast cells was possible.1 3 Matsue and co-workers pioneered the use of SECM in conjunction with fluorescence imaging by evaJuating the influence of chemicals on cell viability.14 Bard and co-workers have placed the SECM directly above the stage of an inverted microscope; positioning the electrode over yeast cells allowed for measuring cell viability and the efflux of a menadione-glutathione conjugate. J5 A similar set up was used by Schulte and co-workers to study release of adrenalin and noradrenalin from chromaffin ceUs and to obtain topographical measurements of a single fibroblast. 16 These authors are also credited for coining the term biological SECM (Bio-SECM).
Further advances in SECM study of biological samples will be strongly tied to improvements in instrumental design and the availability of nanoprobes allowing for high sensitivity measurements in combination with other analytical methods. 17-20 lt is also linked to the employment of compatible cell substrates,21 access to simple microlithographic techniques to produce cell patterns, and routine use of cytotoxicity measurements. This chapter is intended to provide a short sUl\ley of our efforts in each of these areas with respect to CUiTent trends in the field. We subdivided this chapter into a set of dedicated sections that are organized in the fol1owing manner. Section 1.2 describes the basic principles underlying electrochemical measurements with UMEs. This is followed by a brief review of electrochemical sensors for cell studies (Section 1.3). Specifically, we discuss disk and fiber
LIMEs (Section 1.3.1) as weil as micropipets (Section 1.3.2) which ail can be employed for various types of cell transport studics. Section 1.4 deals with tcchnical aspects of SECM, focusing on three main topics. First, we brietly outline instrumental and operationaJ principles of this technique (Section 1.4.1). We then describe the use of SECM as an analytical tool, with paliicular emphasis on systems that were designed for probing living cells (Section 1.4.2). We review advances in SECM instrumentation essentially from a conceptual rather than conclusive point of view. In Section 1.4.3 we discuss the different modes of feedback control that are suitable for probing living ceUs. Section 1.5 is dedicated to the substrate and the biological probe itself. In Section 1.5.1 we dcscribe the design,
fabrication and functioning of relatively simple elastomeric microcapilJary systems (IlCSs) that can be used for confining cells on surfaces with spatial control. This is followcd by a short summary of our recent effOiis on patterning HeLa cell cultures on plastic substrates (Section 1.5.2). Section 1.5.3 is finally devoted to tluorescence-based essays revealing the status of a cell during or after electrochemical probing. Section 1.6 concludes this chapter with personal remarks on present as weil as future aspects of biosensing using SECM.
1.2 Basic Principles of Ultramicroelectrodes
Historically, the term UME was first applied to micrometer-sized electrochemical sensors since the proper term microelectrode has already been used for electrodes in the
millimeter size regime. Today, several groups prefer consistency in terminology and the term microelectrode solely be referred to micrometer-sized sensors. 22 Herein, wc use the term UME to define electrochemical sensors that have dimensions ranging from tens of micrometers to the nanometer scale. UMEs can be prepared from different electroactive materials (e.g., carbon, platinum, or gold) using a number of fabrication schemes. MOl"eOVer, geometry of an electrode can vary depending on the intended application, including microdisks, microrings, microbands, microcylinders (e.g., a single fiber), microspheres, and microhemispheres as the most cornmon forms. A more detailed description of selected UMEs is provided in Section 3. A comprehensive survey of UME preparation methods is available elsewhere. 23
UMEs have unique properties that make them ideal sensors for biological SECM. Their small size allows an unhampered approach to cells and provides lateral resolution for imaging single ceUs. In addition, they present improved faradaic-to-charging CUITent ratios
leading to increased signal-to-noise ratios.24 For example, current signais as low as 30 fA can be measured depending on the electronics of a particular instrument and the size of the UME used. Also, the potential applied to a UME can be altered rapidly (up to 106 Vis) as a result of reduced charging currents. The ohmic drop of the potential, Ri, is relatively small for UMEs since the measured currents are low. Finally, they rapidly reach steady-state conditions, which is a prerequisite for the use of UMEs in SECM imaging. In the case of a disk UME the
expression for this steady-state current,
,'s,
(A) is defined aslss = 4nFDcr (1 )
where n is the number of electrons involved in the electrochemical process, F is the Faraday constant (96.48534 x 10³ C/mol), D is the diffusion coefficient of the electroactive species in solution (m2/s), c is the concentration of the electroactive species (mol/m3) and ris the radius
(m) of the electroactive sensor. At steady-state, the sensing zone of a UME is precisely defined and localized within a restricted solution volume at the electrode/solution interface. This implies that the response of the sensor in a homogenized electroactive solution is independent of the actual position until the UME is brought in close proximity to a surface that can interact with its sensing zone. Since the behavior of the UME is affected by mass transport of dissolved electroactive material in the vicinity of the electrode, the presence of a nearby surface can hinder or add to the flux of material detected by the sensor.
The presence of a steady-state current during a faradaic process separates UME electrochemical behavior from that of classical electrodes used in electroanalytical chemistry. There iS,however, no c1ear dependency of dimensions, such as the radius of the electroactive disk, and UME properties. It rather is a relationship between size and shape of the electrode and the thickness of the diffusion layer that dictates what the observed electrochemical behavior shall be. In the case of a reversible charge-transfer reaction involving a dissolved electroactive substance, 0, the current measured at the UME is proportional to the flux, Jo,
(moV(s m])) of 0 at the solution/sensor electrode interface, which is described by Fick's first lawas
(2)
where x and t denote positions in space and time, respectively. Fick's first law states that the flux of 0 is propoliional to the concentration gradient, dco/dx, at a particular moment and location. The change in concentration of 0, dco, with time is described by Fick's second law generalized for any geometry by
(3)
where \71 is a Laplacian operator characteristic of different diffusion geometries. The operator used in the case of linear diffusion to a planaI' electrode would be different from that of spherical diffusion observed, for example, at a gold sphere electrode.
Equations 2 and 3 reveal that the concentration profile of the reacting electroactive substance is dependent on both distance from the electrode/solution interface where the electrochemical process is occurring and timc. Practically, this relationship implies that by switching the UME potential from a value where no electrochemical reaction occurs to that where 0 is reduced, 0 will be consumed, hence Co will approach zero at the
electrode/solution interface (x = 0) and dco/dx will develop within a defined region of the bulk solution. The volume of solution in which diffusion of 0 to the electrode solution intelface occurs is called the diffusion layer and is also dependent on the electrolysis time. The thickness of the diffusion layer,
0,
for planaI' semi-infinite diffusion is defined as0= -v(nDt) (4)
where n is the circular constant (3.141592). To observe UME behavior, the following two conditions must be fulfilled. 24
1) The electrolysis time must be sufficient, given the dimensions of the sensor, to reach steady-state conditions.
2) The ratio of 81' must be much larger than 1.
At short electrolysis time, small pl anar UME sensors behave like large planar electrodes. This can be experimentally observed by progressively increasing the sèan rate during cyclic voltammetry (CV) at a 25 )..lm disk UME. For scan rates below 10-20 mV/s, a sigmoidal CV response that reaches a steady-state current is observed. At higher scan rates, a characteristic "duck-like" shape voltammogram is obtained. With increasing time, the diffusion layer develops to its full potential in bulk solution and UME behavior is developed if condition 2) is met. The time that is necessary to reach steady-state is dependent on the surface area of the sensor. A sensor having characteristic dimensions of l' = 1 mm would
require more than 4 x 10⁴ s for its current signal to be dominated by the steady-state component at 90%, while a UME with r = 1 )..lm would achieve steady-state conditions in only 0.04 S.24
There are two important contributions to the current measured at an electrochemical sensor: the flux of substance normal to the electrode plane called linear diffusion (Figure !.lA) and the flux of substance at the edges of the sensor which is referred to as hemispherical diffusion (Figure 1.1 B). The latter is responsible for the lack of unifonnity in CUITent density commonly measured across an electrode surface. For a large planar sensor, linear diffusion dominates and the contribution of the hemispherical diffusion to the overail CUITent is minimal. This leads to 81' much smaller than 1 and the advent of c1assical electrode behavior. As the size of the sensor decreases, the contribution of the hemispherical diffusion to the overall CUITent increases and the diffusion-Iimited flux to the electrode becomes constant with time. Since the current is proportional to Jo as described in eq 2, a steady-state current is observed. This current is further related to Co (eq 1) because the time derivative of
1.3 Ultramieroeleerodes in Cell Studies
1.3.1 Dise and Fiber UMEs
Electrochemical sensors used to study single cells and cell patterns must have appropriate dimensions, be stable over the time scale of the experimenl, be sensitive and selective to the analyte and have a high signal-to-noise ratio. The matcrials commonly used for the preparation of these sensors include carbon, platinum and gold. For thc purpose of quantitative studies or cell imaging, the preferable sensor geometry is often a disk-shaped electrode surface because its behavior is theoretically weil understood and widely documented in the literature. Ideally, the electrode area should be on the order of or smaller than the surface area of the cells to be studied. The surrounding insulating material (e.g., glass, paint, or wax) should be minimized not to hinder close approach to the cells. Initially, carbon was the preferred material for ceU studies because it was thought to be less susceptible to electrode fouling than platinum and gold. Recent studies using platinum UMEs in extracellular7 and intraceUular25 experiments observed no significant fouling of the metal surface by ceU constituents. Arguably, gold sensors wou Id best be used in extracellular studies given the high affinity of sulfur-containing proteins to gold. Gold remains nevertheless an interesting material for the preparation of UMEs mainly due to ease of sensor preparation and its sensitivity to quinone-containing compounds. 15 The sensitivity and selectivity of the UME electrode material to an analyte interacting with or originating from a ceU is hard to predict. Carbon has been used to detect the release of catecholamine neurotransmitters on individual adrenal gland cells (PC-12) and chromaffin cells.26•27 These
cells undergo exocytosis thereby releasing hormones and neurotransmitters from membrane bound storage vesicles into the extracellular space. In this case, a carbon UME with a
diameter of 1-2 flm was placed directly above the center of an immobilized ceU al a separation distance of <1 ~lm (Figure 1.2A). The UME response related to the detection of vesicular chemical release coming from secretory vesicles is shown in Figures 1.28 to 1.2D. Prior to recording, the formed secretory vesicles were loaded with a desired chemical transmitter. During ceU signaling, the loaded vesicles dock at the plasma membrane,
rearrange and upon the presence of an externat stimulus are released into the extracellular space following activation of the Ca 2 + ion channels.
The carbon UME sensor is obtained by sealing a carbon fiber (CF) into an insulating sheat followed by careful polishing (in the case of glass) or sectioning with a scalpel (in the case of polymers such as polyethylene, propylene, or electrophoretic paint). There are several methods that can be used to produce disk-shaped CF-UMEs with diameters of 5-10 flill (Figure 1.3).28.29 Further reduction in diameter of CF-UMEs can be achieved through electrochemical,24.3o.31 electrical,32 flame,24.33.35 or ion beam36 etching procedures. Modification of the carbon electrode surface with complexes or enzymes is often needed to improve the selectivity of sensors to other important cell analytes such as nitrogen oxide or glucose.34.37.39 Alteration of electrode properties however requires a significant sensor response analysis prior to the electrochemical cell studies.
Bare, disk-shaped platinum UMEs are used for extra- and intracellular local measurements of oxygen gas,25 cell metabolites (e.g., thiodione),7.15 and reactive oxygen species.40 Typically, they are produced by sealing platinum nano- or microwires with thin tapers of pu lied glass capillaries and then polishing the excess glass. 41 .46 This can be achieved by pulling an annealed platinum wire (25 flm diameter) into glass (e.g., made of borosilicate or quartz) under vacuum using a laser pipet puller. Shape and size of the sensor are controlled through optimization of the pulling parameters. This fabrication technique is highly depcndent on the delicate exposure of the Pt electrode surface by polishing. The characteristic voltammograms recorded at these sensors are fully retraceable and attain a steady-state cun-ent at sweep rates as high as 10 V/S. 25 Ultrasharp platinum disk UMEs of nanomet~r dimensions are produced in the sa me way (Figure lA, inset). With a tip radius being 1,000 times smaller than that of a cell, these UMEs can penetrate a cell without apparent damage to the membrane and measure membrane potentials.
When human breast epithelial cells (MCF-lOA) are exposed to a solution of a hydrophobic redox substance, such as I-(ferrocenyl)methanol (FcCH20H), paltition of the substance occurs between the extra- and intracellular domains. The potential of the cell membrane can be estimated by measuring the voltammograms at a platinum UME sensor outside and inside the cell (Figure lAA). In the case of FcCH20H oxidation, the difference of
drop across the cell membrane of the MCF-IOA cells (Figure IAA). Reproduced with different UMEs, a mean Mw of 46
±
4 mV (for n = 18 at the 95% confidence interval) was obtained. The addition of depolarizing agents (e.g., valinomycin at a concentration of 600 nM) to the solution was expected to diminish the membrane potential. In each of the seven experiments performed on MCF-IOA cells in presence of valimoycin, M I /2 decreasedmarkedly, and an average value of M I/2 = 16.7 mV was observed for FcCH 20H mediator.
Although there is sorne variability in the membrane potential values reported in the literature, measured average values for M I/2 are somewhat higher than most numbers obtained for
mammalian cells by different techniques (e.g., 58.6 mV vs. 2.7 mV reported for MCF-7 human mammary tumor cells).47 In this experiment, the platinum UME potential was
measured with respect to an AgiAgCl reference electrode positioned in the extracellular solution. Since membrane polarization can be induced by the current fiow between the intracellular platinum UME and the external reference electrode, the dependence of M II2 on
the concentration of FcCH 20H was studied. The ohmic potential drop across the membrane, Ri, (V) with R, (Q) being the membrane resistance, is proportional to /, (A) flowing at the tip of the electrode inserted in the cell. The voltammograms in Figure lAA represent the platinum UMEs response in a bulk solution of FcCH 20H outside the cell (curve 1) and inside
the same cell (curves 2-5) for different concentrations of FcCH20H. By varying the
concentration of FcCH20H in solution, a linear dependence of the tip current corresponding
to the half-wave potential, / (Ed, is obtained (Figure 1AB). The Min value decreased upon dilution, and the plot of M I/2 vs. / (EI /2) was also lincar (Figure lAC). The membrane
resistance extracted from the slope of the graph is on the order of 4 GQ. Interpolation of the plot reveals a membrane potential corrected for the polarization effect of about -10 mV, which is in good agreement with values repol1ed in the literature 47 Although more in-depth work needs to be done, the use of intracellular voltammetry to measure membrane potential is a re!ative!y straightforward technique that could easily be applied to severa! cell cultures. It may also complement other methods for evaluating membrane potentials, including patch
48 h f . l ' b 49 dfi d 50
1 t e use 0 lon-se ectlve pro es, an uorescent yeso
1.3.2 Electrochemical Micropipets
Electrochemical micropipets are a relatively new type of electrochemical sensor that is being developed for biological SECM. They consist of glass micropipets coated with a thin film of gold or platinum. With subsequent insulation of the sides of the micropipets with electrophoretic paint and heat curing, it is possible to obtain an electroactive ring in the nanometer regime at the aperture of the pipet. The nanometer dimensions of the sensor combined with their ability to dispense volumes of solution in the pL range near or inside a cell make them attractive candidates for cell transport studies. The dispensing capabilities of the micropipet outweights the geometrical preferences for a disk electrode surface presented in Section 1.3.1. In the past, micropipets have been reported in ion-selective electrode studies that monitor ion-transfer reactions. 51 -54 Micropipets can also be filled with enzymes to probe the catalytic activity of a surface55 or be used for microdispensing experiments in conjunction with scanning chemiluminescence microcopy (SCLM).56.57 The deposition of a defined electroactive layer on the outside of the micropipets allows for simultaneous dispensing of solution and electrochemical detection. This feature is critical in biological SECM in order to precisely determine the initial time, '0, of the injection process, which is important during quantitative kinetic studies of cell transport.
The preparation of electrochemical micropipets requires several steps. Borosilicate glass capillaries are first pulled using a filament or laser puller. The shape of the resulting pipet is dependent on the pulling parameters and can be optimized to yield aperhlres that are 1-2 /lm in diameter having a well-defined taper that is ~0.5 cm long. The pulled end of the micropipet is then coated with a tbin film of gold by thermal evaporation. Micropipets are rotated at a rate of ~30 rpm at an angle of 20-50 degrees with respect to the surface plane to obtain a uniform gold coating and prevent accumulation of gold at the aperture. Rotation of the micropipets is maintained throughout the entire evaporation process and during cooling of the evaporation chamber to obtain a smooth and uniform deposit. Electrical connection to the gold film is made using a fine copper coil and conductive, silver-containing epoxy resin. The gold ring electrodes are produced by insulating the side walls of the coated micropipet with an anodic or cathodic electrophoretic paint.58.59 This method of insulation is effective for the preparation of submicron size sensors. 30.42,60-62 To prevent ciogging of the capillary during the
electrophoretic deposition step, the unmodified end of the micropipet is connected to a source of nitrogen gas at a pressure of ~50 psi. The gold-coated end of the micropipet is then inserted in the middle of a platinum coil immersed in the electrophoretic solution. Depending on the choice of paint, chronopotentiostatic deposition or CV may be used to achieve the desired coating.5~.59 Following deposition, the pipet is rinsed and cured by thermal trcatment.
Characterization of the micropipet-based electrochemical sensor is typically done by scanning electron microscopy (SEM), CV and SECM approach curves. Figure 10-5 shows different views of gold ring micropipets with and without insulation layer. The gold film is uniform and ex tends down to the very edge of the micropipet aperture without blocking its opening, as demonstrated by the images in Figure 1.5A. Here, the diameter of aperture is on the order of2 J..lm while the gold film is 50-80 nm thick. The thickness of the insulation layer at the pipet aperture is only a few tens of nanometers (Figure 1.5B). Depending on the electrochemical behavior of the pipets, a second coating of paint is sometimes needed to minimize the presence of pinholes in the polymer layer. A disadvantage of using several coatings is the possibility of blocking the end of the pipet with the insulating layer (Figure 1.6A). When such a situation arises, the blocking pol ymer layer can be expelled using a high voltage source (e.g., 6 kV) that generates a spark under a helium flow at the anode (-) between the two sacrificial gold wires (Figure 1.6B). It is the field effect generated at the end of the micropipet that removes the blocking pol ymer layer. Successful removal of the insulation layer can be visualized electrochemically through the return of the signal (Figure 1.6C).59 The electrochemical behavior of the micropipets is well-defined and fol1ows the steady-state CUITent that would be expected from the Iiterature for a ring electrode.6J The SECM approach curves in the positive and feedback modes are also consistent with theory.58 Electrochemical micropipets are desirable sensors for cell transport studies. They can mediate injections of electroactive substances into a cell or generate constant flow of a solution nearby a cell, allowing drugs or other agents to stimulate a response from the cell. Their dispensing capabilities have been reported in a proof-of-concept dispensing/feedback SECM imaging experiment.5~ They can also be used patch ante a giant unilamellar vesicle to perfonn membrane studies as illustrated in Figure 1.7.
1.4 Biological Scanning Electrochemical Microscopy
1.4.1 Basic Principles of SECM
In SECM, the UME is scanned over a surface using a high-resolution 3D micropositionning system. During movement of the electrode, the steady-state current is monitored continuously. Steady-state current is observed when the electrochemical reaction of a dissolved reversible redox species at the UME/solution interface is mass transfer-limited, at least for potentials far exceeding the redox potential of the species. Given the UME' s unique properties,n the localized hemispherical diffusion zone of the species in front of the UME is used to detect topography and/or reactivity of a nearby surface (Figure L.8). Surface topography is revealed by monitoring the extent by which the diffusion of specics from surface features is hindered. Large features disrupt significantly diffusion to the UME and alter the 'Iocalized hemispherical diffusion zone such that a decrease in UME current is observed. Surface reactivity is evaluated from localized increases in UME current that are related to the kinetics of species regenerated at the sample surface. There are other important parameters that affect SECM responses, su ch as UME geometry, the UME-to-surface distance and the so-called RG factor, which is the ratio of the radii of insulating material and metal wire. A detailed explanation of their contribution is available elsewhere.2
Observed UME currents in SECM experiments are affected by both topography and/or reactivity of the sample surface; hence an un-ambiguous interpretation of SECM imaging studies requires deconvolution of each contribution. In the case of an SECM approach curve, where the UME is approached normal to the sample surface, there is no need to deconvolute the SECM response, as long as the UME is much smal1er than the sample surface features. In the case of SECM imaging where the UME is positioned within a few tip radii of the sample surface and scanned parai lei to the surface plane, two experimental strategies - constant-height and constaht-distance - are commonly employed (Figure L.9A). In constant-height imaging, the UME is scanned over a surface in both x-and y-directions at a fixed vertical distance (z-direction). Constant-height imaging can be readily applied to smooth and planar samples where features do not exceed preset values in height, as is the case for self-assembled monolayers of alkanethiols on gold. 64 Although instrumental1y easier
to implement, constant-height imaging is prone to tip-sample crashes wh en the preset height is reduced to achieve better resolution. It is therefore unlikely that constant-height mode imaging will be used significantly in SECM studies of biological samples, especially when large aspect-ratio features, such as cells, are the subject of investigation. Constant-distance SECM imaging, on the other hand, uses an additional feedback control mechanism to maintain a constant UME-to-sample distance, making it possible to deconvolute surface topography from its electrochemical activity. Sorne ofthese feedback control mechanisms are discussed in Section lA.3. At present, constant-distance imaging mode is widely accepted as the norm for the application of SECM to studies with immobilized cells.
1.4.2 Biological Scanning Electrochemical Microscopy (Bio-SECM)
The concept of Bio-SECM emerged after several groups combined convention al SECMs with inverted microscopes in order to build an instrument suitable to study local
· 1 . . b'l' d Il (F' 19B)7151615('566 -rh' d
e ectroc 1 hemlca reactlons at Immo 1 Ize ce s 19ure . . . . . - . , e lllverte microscope confers several advantages to cell studies including quick identification of healthy cells based on morphological changes and prepositioning of the UME close to ceUs, which reduces overall experimental time. Cell activity in the context of an SECM experiment is difficult to' define and can imply both direct and indirect modes of electrochemical detection. Direct detection is generaUy applied to cell constituents (e.g. a neurotransmittor), cell metabolites (e.g. thiodione), or cell functions (e.g. respiration). Indirect detection methods may be employed when direct measurements are difficult to perform, as is the case for sorne œil properties (e.g. the intracellular redox potential of a ce Il) and reactions occurring at its surface.
The instrumental setup of our Bio-SECM manufactured by HEKA (Germany) is schematically presented in Figure 1.9B. The instrument employs an inverted microscope comprising adapted optics for cell imaging such as Hoffman Modulation Contrast to visualize cel! morphology and quickly identify healthy cclls prior to performing electrochemical measurements. The microscope is also equipped with a fluorescence module and a CCD camera to perform toxicology and viability measurements simultaneously during or following SECM imaging. The entire microscope system is mounted on an x-y translation stage to align
the optical axis of the microscope with the UME. The UME is placed above the immobilized ceil substrate residing in a specially designed electrochemical cell that also accommodates reference and auxiliary electrodes. The UME is connected to a constant-distance control 1er that regulates the UME-to-cell distance during imaging. The setup is placed on a vibration damping table enclosed in a Faraday cage to shield the instmment against acoustic and electrical interference during measurements and improve fluorescencc-imaging conditions.
1.4.3 Constant-Distance Feedback Controllers
Maintaining a constant UME-to-sample distance during SECM imaging is achieved by using the feedback signal from a distance controiler that continuously monitors the position of the UME, compares it with a preset value, and adjusts the UME positions when deviations occur. Figure 1.9C presents selected examples of constant distance controller schemes that proved suitable in conjunction with SECM instmmentation. They include shear force (e.g., optical, tuning-fork, and piezoelectric plates), UME cunent modulation, UME impedance, and AFM-based feedback mechanisms. 26 Shear-force based distance controllers rely on the detection of short-range (100-200 nm) hydrodynamic forces between the sample and a vibrating UME that approaches the surface at a predefined rcsonance frequency. Damping of the resonance frequency by the viscous drag of liquid in between the UME and the surface provides feedback for the SECM positioning system and is used to maintain a constant UME-to-sample distance. Resonance frequency damping of the vibrating UME can be monitored optically by projecting the Fresnel diffraction pattern that is generated from the interaction of a focused laser beam and the UME body onto a split photodiode.67 Another concept of feedback control, which has originally been developed for near-field scanning optical microscopy (NSOM), involves a UME that is fixed to one leg of a tuning fork and vibrated using a piezoelectric buzzer. The resulting resonance frequency of the tuning fork produces an AC voltage output that is sensitive to the presence of shear-forces between the UME and the surface that is to be investigated.65.6S-71 Moreover, a combination of piezoelectric plates exciting the UME at a resonance frequency and detecting the amplitude of the UME vibration can also be used. 72 This scheme is employed in the HEKA instmment presented in Figure 1.9B.
An alternative approach uses the electrolysis CUITent of a dissolved spccies to regulate the UME position;70.73 it relies on superposition of a sinusoidaJ wavefunction onto a constant DC potential su ch that a resulting AC current f10w is recorded providing feedback for constant distance imaging. 66 .74 The use of UME impedance has also been explored as a means of retaining constant distance for SECM measurements.40.75-79 In this scheme, the UME
impedance is modulated to high frequencies (~50 kHz) so that it can be detected
independently from Faraday processes that occur at lower frequencies. Simpler to implement than shear-force methods, UME impedance can monitor cell morphology and substrate topography in a medium that is free of redox species. Impedance-based methods are however susceptible to local impedance variations during certain biological processes such as vesicular release.68 Also, the resolution of impedance-based imaging is typically lower than that obtained with competing concepts, such as constant-current imaging (Figure 1.10). The use of specialized cantilevers in conjunction with AFM instrumentation proved suitable for
S2
achieving high-resolution SECM imaging. 80- Drawbacks of combined SECM-AFM strategies Include relatively long acquisition times, the need to modify the surface of cantilevers, and limited robustness. The controllers described in this section ail strive to master constant-distance SECM measurements performed on soft substrates, such as ceUs. Soft substrates are technically more challenging to probe than rigid ones (e.g., the surface of a metal film) since their interfaces are less confined. Cells are also likely to deform upon contact with the UME. CelllUME contact may occur in the case of shear-force positioning systems that require UME-sample separation of a few hundred nanometers. The impact of this contact on frequency damping is unclear, yet il should vary significantly with the type of UME used. 16
1.5 Biomaterial Design: Cell Patterns Used in Bio-SECM
1.5.1 Microtluidic Systems for Cell Patterning
Microf1uidics generally refers to the science and technology of handling, manipulating, and processing minute amounts of liquid. 83-s5 The central part in a microf1uidic
system is a microchannel (or a set of microchannels) able to confine liquid at dimensions of between 1 and 1000 !lm. The use of microfluidic systems makes it possible to control volume, position, and transport of fluids with precision that is unprecedented by conventional operations performed at the bench-top in standard laboratory settings. These systems are particularly appealing to applications in chemistry and biology, where they can serve, for ex ample, as miniaturized reaction vessels that enable reduction of reagents and processing times,86 synthesis of palticles with new shapes and forms,87 or attachment of proteins and
88
cel1s at selected sites on a surface. 85. The design of fluidic systems can vary depending on the intended use, and may range from simple, two-dimensional (2D) capillaries to integrated chips comprising complex circuits of fluidic structures along with functional elements such as miniaturized mixers, valves, and pumps.89 In principie, such structures can be fabricated from a number of materials including both soft and rigid ones, with the former being particularly useful for research and prototyping purposes. Poly(dimethylsiloxane) (PDMS) is an elastomeric polymer that is commonly employed for soft lithography in both academic and
n
industrial environments.9o. PDMS is weil suited for biological studies due to its unique characteristics: it is flexible, chemical1y inert, opticany transparent, durable, permeable to gases, and compatible with cel1s.
Microfluidic (or microcapillary) systems 111 PDMS are commonly prepared uS1l1g rapid prototyping - a process that allows multiple copies of a desired pattern to be produced in a relatively short period of time and at low cost. 92 The first step in the fabrication process concerns the layout of the !lCS. This is typically accomplished by defining the desired components (e.g., channels, inlets, out lets etc.) as transparent regions in an otherwise dark (opaque) background using a computer-aided design (CAD) program (Figure 1.1 lA). Features having lateral dimensions of>8 !lm can directly be printed on a transparent polymer foil using a high-resolution photoplotter. In this way, a set of photomasks can be obtained rapidly (e.g., in less th an 24 h for celtain suppliers) and at a relatively low cost. For features <8 !lm it is necessary to transfer the design into a thin layer of chromium supported on a quartz plate. The fabrication of these high-end photomasks typically involves a scanning beam of electrons to write the desired pattern into a responsive medium (e.g., a thin polymer film), which then protects selected regions of the under1ying chromium layer in a subsequent etch process. Depending on the overall area to be patterned, time and cost associated with this
fabrication scheme can be considerable. The use of printed transparency foils therefore appears to be preferable for rapid prototyping, especia11y when test structures may be subjeeted to several iterations in design.
The next step is related to the formation of an original pattern ID the form of
topographie structures (ca11ed master) using optical lithography (Figure 1.11 B). Optical lithography (also ca11ed photolithography)93 uses a thin film of radiation-sensitive material (photoresist), which is applied to a silicon wafer by spin coating, and exposed to UV light of appropriate wavelength. The photomask is thereby posted between the light source and the resist film inducing illumination of the resist in a spatially controlled manner. When performed in contact mode, the mask comes in physical contact with the resist film, reproducing a11 features in al: 1 ratio, as illustrated in Figure 1.11 B. More sophisticated exposure tools operate with the mask being furthcr away from the surface of the wafer, while a system of lenses projects a demagnified image of the mask onto the resist. Photoresists are organic polymers that undergo changes in structure and composition when illuminated. This renders the material either soluble (positive-tom:) or insoluble (negative-tone) in a liquid medium used for development. SU-8 (an epoxy-based bis-phenol A novolac resin) is commonly employed for master fabrication due to its inherent thermal and mechanical stability,94 which allows a single master to be reused many times without notable degradation. The third step constitutes the fabrication of the ~lCS itself, which is done by replica molding of the master pattern in PDMS (Figure 1.11 C). In contrast to master fabrication, this process can be performed in standard laboratory settings. Il is generally preferable to coat the master with a thin film of Teflon® or a fluorinated silane before use to decrease interfacial adhesion forces so that the PDMS can be released properly after the replication process is completed. PDMS is commonly formed from an elastomer base (a vinyl-terminated siloxane) and a cross-linking reagent (a hydrogen-terminated siloxane) that are reacted in the presence of a Pt catalyst. These precursor components - being liquid at room temperature - are mixed before use, poured onto the master, and cured at elevated temperature (e.g., 40-80 oC). During the curing process, the material solidifies into a cross-linked polymer network that allows the shape of the photoresist features to be preserved with high fidelity. The ratio of the precursor components, their structure and molecular weight are all-important with respect to the elastomeric properties of the forming polymer network. Most common applications rely