Performance-based financing for better quality of services in
Rwandan health centres: 3-year experience
Louis Rusa1, Jean de Dieu Ngirabega1, Willy Janssen2, Stefaan Van Bastelaere2, Denis Porignon3 and Werner Vandenbulcke2
1 Ministry of Health, Kigali,Rwanda
2 Belgian Technical Cooperation, Kigali, Rwanda
3 School of Public Health, Universite´ libre de Bruxelles, Brussels, Belgium
Summary In 2005, the Ministry of Health in Rwanda, with the support of the Belgian Technical Cooperation, launched a strategy of performance-based financing (PBF) in a group of 74 health centres (HCs), covering 2-m inhabitants. In 2006, PBF was extended to an additional group of 85 HCs, thus reaching 3.8-m inhabitants. This study evaluates the effect of PBF on HC performance from 2005 to 2007. Composite indicators for measuring quantity and quality of services were developed and evaluated through monthly formative supervisions by qualified and well-trained district supervisors. The strategy was based on a fixed fee per quality-approved service. The entire budget spent on the implementation of PBF amounted to $0.25 ⁄ cap ⁄ year, of which $0.20 ⁄ cap ⁄ year for subsidies and an estimated
$0.05 ⁄ cap ⁄ year for administration, supervision and training. A positive effect on utilization rates was only seen for activities that were previously less well organized; in this case, growth monitoring services and institutional deliveries. The quality of services, defined as the compliance rate with national and international norms, rose considerably for all services in both groups. A sustained level of quality between 80% and 95% was reached within 18 months in the first group. A similar result was reached in the second group in 8 months.
keywords internal contracting, performance-based financing, supervision
Introduction
Like many other developing countries, Rwanda is commit-ted to achieving the Millenium Development Goals by 2015. This reflects on the country’s provision of basic health services emphasizing the availability and quality of services offered. Human resources are a critical component of any health system and the driving force of its performance. However, it turns out that in many low-income countries, particularly in Sub-Saharan Africa, inadequate health workers’ performance is a serious problem. The 56th World Health Assembly of 2003 incited member countries ‘to frame contractual policies that maximize impact on the performance of health systems’ (WHO 2003). Performance-based financing (PBF) was therefore introduced in Rwanda in 2002 by international NGOs through pilot projects in the provinces of Cyangugu (Soeters et al. 2006), and Butare (Meessen et al. 2006) as an alternative to classical salary top-ups that were being implemented at the time. These pilot projects, and literature, identified PBF as successful in improving productivity or volume of healthcare services and maintaining or improving quality.
Building on those experiences, in 2005 the Ministry of Health in Rwanda decided, with the support of the Belgian Technical Cooperation (BTC), to implement a strategy of PBF in 74 health centres (HCs) in five rural districts (Ruli, Rutongo, Kabgayi, Kabuga and Bugesera) and one semi-rural district (Muhima), covering 2.072.282 inhabitants. In 2006, when the Rwandan Government rolled-out PBF to the entire country’s HCs, this strategy was extended to an additional group of 85 HCs in other rural districts and so covering a total of 3.784.632 inhabitants. Those districts had been selected because they were not covered by other PBF initiatives.
Geographical access to the HC in our districts is comparable to other districts of the country, with 60% of the population living within a radius of 5 km from the HC, and 85% of the population living within a radius of 10 km. Current health indicators provide evidence of progress attained over the last 10 years, with a high level of immunization coverage in 2005 of over 90% of DPT (diphtheria, pertussis and tetanus) third dose vaccine by the first year of age. The infant mortality rate declined from 152 deaths per 1000 live births in 2005 to 103 in 2007
(MoH 2007). Although maternal mortality has dropped, it remained high with 750 deaths per 100 000 live births in 2005. Unmet need for contraceptive methods remains high and access to family planning services is limited. Only 9.5% of adult women used a contraceptive method in 2005. This shows that there was space for large improve-ments in family planning services at health facilities.
Health centres in Rwanda deploy 50% of all health workers in Rwanda and A2 nurses make up 80% of the workforce with a total average of 10 persons per HC. Salaries of health workers are financed by various sources (65% of salaries by the government, 22% by faith-based institutions and 12% by non-governmental organizations). Important differences exist between salaries paid to health workers according to ownership of their facilities. The monthly average salary of an auxiliary nurse A2 in 2005 was 45 000 FRW and 92 315 FRW in 2007 (US$1 = 555 FRW).
The majority of the population is covered by a mutuelles community health insurance scheme and coverage in Rwanda is rather high, with 74% of the population estimated to have been covered in 2007, compared with only 7% in 2003. Health insurance became compulsory in Rwanda in early 2008.
Methods
The PBF strategy was based on a reimbursement mecha-nism with ‘indicator purchasing’ linked to an integrated formative supervision system. This was achieved through a contracting-in approach, which defined clearly the roles and the responsibilities of the various parties, the moni-toring system used, the outputs to be purchased, financial incentives provided and the conditions for payment to the health facility.
In this study, the design was set as a time series with a two-staged implementation that allowed to a certain extent for a control group. A phased implementation of the PBF strategy, with a first group (group 1) of HCs starting in the first quarter of 2005 and a second group (group 2) starting in the second quarter of 2006 allowed for a control in the first quarter of 2006.
After the decision was taken to link payments to activities, a set of indicators was established. Those indicators were classically related to delivered services (outputs) and to quality of services. The indicators were covering the minimal package of activities of a HC and were regularly reviewed in order to avoid long-term carelessness of activities that are not remunerated (Table 1).
Pricing was carefully balanced and adapted in order to avoid distortions in service delivery; payments for
quanti-tative outputs were balanced through a measure of the percentage of qualitative improvement achieved. Unit fees for basic activities varied between 100 and 2500 FRW ($0.18–4.5).
The verification of quantity and quality during the monthly supervision of the HCs by a team of two qualified district’s supervisors, coached by a team of trainer-supervisors from central level, prevented abuses such as unnecessary service delivery. Prior to supervision, HC auto-evaluated those indicators, and their results were compared with those obtained during the supervision. Once the indicators were collected by the supervisors, a monthly invoice (SY · fee, Table 1) was established and signed by the holder, who preserved the copy at the HC waiting for payment.
The payment made to the HC on a monthly basis was to be considered as an ‘incentive’ or a ‘bonus’ to top-up salary. In addition, financial support for administration, supervision and training was also provided. The staff at the HC had the opportunity to improve their performance, and hence their earnings, by increasing necessarily both the quantity of outputs and the quality of services delivered. A close monitoring and supervision structure was put in place at the district level to avoid over-reporting.
At the central level, the Coordinating Unit for PBF at the Ministry of Health and BTC were particularly conscien-tious on issues of over-reporting and a systematic re-verification process was applied to suspicious reports of quantity and quality outputs.
During the PBF implementation, the population in both groups benefited in a similar way from nationally organized health initiatives (community health insurance adherence, free of charge delivery after four ANC standard visits, free baby cloths when delivering in HC a. o.) led by the Ministry of Health, as well as from various national sensitization campaigns launched by the national media and the civil authorities, which mobilized population towards the health facilities.
Data on quantity and quality of services were collected in all HCs from 2005 onwards on a monthly basis by the district supervisors. The results on quantity of care are expressed as a percentage calculated by dividing the observed number of activities at the HC by the estimated total number of activities expected for the month. The expected total number for each of the above activities was for curative services: one consultation per inhabitant per year; for antenatal consultations: all pregnant women with four consultations per pregnancy; for vaccinations: all children £1 year completely vaccinated; for deliveries: all pregnant women delivering in the HC; for growth moni-toring consultations: all children >1 year and <5 year with one consultation per month. For family planning, the
Table 1 Qua ntity indicat ors, quality cr iteria, qual ity in dicator s and fees (US$1 = 555 Rwand an fr ancs, FRW ) Servic es Qua ntity in dicator X Qua lity cr iteria Qualit y indicat or Y Fee in FRW Subsidy Y· fee Cura tive consult ations Total of new cases during the month 1. Entry (=main comp laint or symp tom) and exi t (=d iagnosi s) of cli nical algorithm re gistered in the con sultatio n re gister Total of new cases during the mon th fulfilling the qual ity criteri a 10 0 Y · 100 2. Treatm ent cohe rent with diagnos is (as indic ated in the alg orithms ) Anten atal consult ations Total of cases (old and new ) during the month 1. Antenat al rec ord correctly and comp letely filled out in twofol d: one for the mothe r and one to be correctly classifi ed in the heal th cent re Total of cases (ol d and new) during the mon th fulfilling the quality cr iteria 10 0 Y · 100 2. A writt en in vitatio n has been sent wit hin a week after noticed abse nce for a consult ation Growt h m onitoring consult ations All children of >1 ye ar and <5 ye ars present at con sultation 1. Copy of con sultation record correctly and comp letely filled ou t and correct ly class ified in the heal th centre All chi ldren of >1 year and <5 years presen t a t con sultat ion fulfilling the qual ity criteri a 10 0 Y · 100 2. Balanc e in good work ing con dition 3. Growth curv e correct ly comp leted 4. A writt en in vitatio n has been sent wit hin a week after noticed abse nce for a consult ation Fam ily planni ng consult ations Total of wome n pro tected at the end of the m onth FP record correct ly and completely fi lled out and correct ly class ified Total of women prote cted at the end of the month ful filling the quality cr iteria 10 0 Y · 100 Deliv eries Assis ted deliver ies at the health cent re or correctly trans ferred for deliver y at the Di strict Hospi tal 1. Partogr am correctly and comp letely filled out Assisted deliver ies at the healt h centre ful filling the qual ity criteria or correct ly trans ferre d for deliver y a t the district hosp ital 2000 Y · 2000 2. Mother and chi ld alive (if deliver y in heal th centre ) Vaccin ations Total of child ren £ 1 year comp letely vacc inated during the month 1. Temperatu re of re frigerator wit hin requir ed limits Total of children £ 1 year completely vacci nated during the month ful filling the qual ity criteria 1000 Y · 1000 2. If the re frigerator is runn ing on petrol, a 5-l reserve shou ld be perma nently presen t a t the healt h cent re 3. Copy of the vacc ination record correctly and comp letely filled out is correct ly class ified in the healt h cent re 4. A writt en in vitatio n has been sent wit hin a week after noticed abse nce for a consult ation 5. Vitamin A has been correctly distrib uted Total amo unt of subsi dy P Y · fee
monthly contraceptive prevalence of the target population (all women of reproductive age) was used.
Results
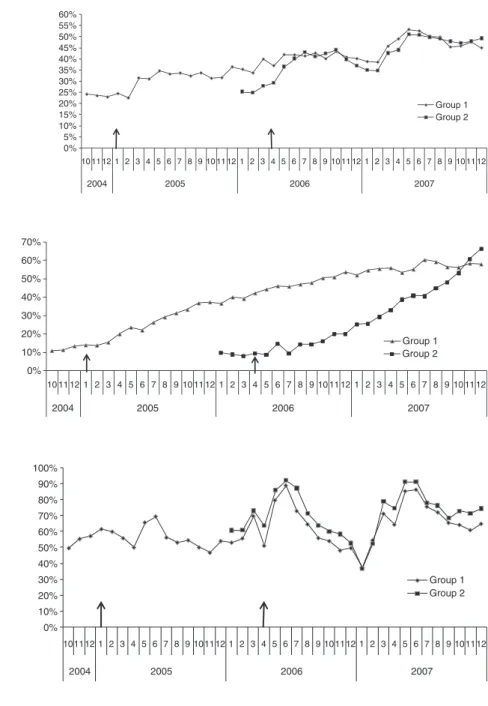
Figures 1 and 2 show that there was a positive impact of PBF on utilization for institutional deliveries and growth monitoring consultations. A sharp increase occurred after the start of PBF in both groups. Moreover, the utilization for both services in group 1 was 1 year after the
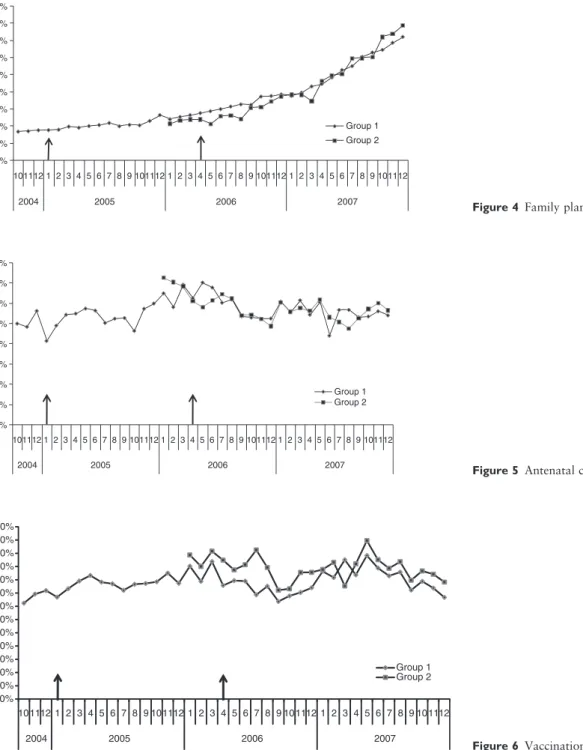
introduction of PBF at a higher level than group 2, which did not start PBF yet. If other influencing factors are the same for both groups, this increase could be explained as an effect of PBF. For the other services presented in Figures 3–6, no impact of the strategy on volume of activities could be detected.
The results on quality of care are expressed as the percentage of services validated for quality (Y ⁄ X · 100, Table 1). Figures 7 and 8 show that in both groups, the quality rose considerably for all health services after the
0% 5% 10% 15% 20% 25% 30% 35% 40% 45% 50% 55% 60% 10 11 12 1 2 3 4 5 6 7 8 9 10 11 12 1 2 3 4 5 6 7 8 9 10 11 12 1 2 3 4 5 6 7 8 9 10 11 12 2004 2005 2006 2007 Group 1 Group 2
Figure 1 Institutional deliveries.
0% 10% 20% 30% 40% 50% 60% 70% 80% 90% 100% 10 11 12 1 2 3 4 5 6 7 8 9 10 11 12 1 2 3 4 5 6 7 8 9 10 11 12 1 2 3 4 5 6 7 8 9 10 11 12 2004 2005 2006 2007 Group 1 Group 2
Figure 3 Curative consultations.
0% 10% 20% 30% 40% 50% 60% 70% 10 11 12 1 2 3 4 5 6 7 8 9 10 11 12 1 2 3 4 5 6 7 8 9 10 11 12 1 2 3 4 5 6 7 8 9 10 11 12 2004 2005 2006 2007 Group 1 Group 2
Figure 2 Growth monitoring consulta-tions.
implementation of PBF. A sustained level of quality between 80% and 95% was reached in about 18 months in group 1 and in 8 months in group 2.
The subsidies received by the HC from 2005 onwards (Table 2) were linked to the quality of services provided, as explained above. The majority of the HC subsidies were
used as a salary top-up. A small part of the subsidies was spent to the functioning of the health facility, but this share remained relatively small: around 8% in 2005, 23% in 2006 and 38% in 2007. The subsidies were distributed among the personnel according to criteria (qualifications, grade levels) that captured their relative contributions.
0% 2% 4% 6% 8% 10% 12% 14% 16% 18% 101112 1 2 3 4 5 6 7 8 9 101112 1 2 3 4 5 6 7 8 9 101112 1 2 3 4 5 6 7 8 9 101112 2004 2005 2006 2007 Group 1 Group 2
Figure 4 Family planning.
0% 10% 20% 30% 40% 50% 60% 70% 80% 101112 1 2 3 4 5 6 7 8 9 101112 1 2 3 4 5 6 7 8 9 101112 1 2 3 4 5 6 7 8 9 101112 2004 2005 2006 2007 Group 1 Group 2
Figure 5 Antenatal consultations.
0% 10% 20% 30% 40% 50% 60% 70% 80% 90% 100% 110% 120% 130% 101112 1 2 3 4 5 6 7 8 9 101112 1 2 3 4 5 6 7 8 9 10 1112 1 2 3 4 5 6 7 8 9 101112 2004 2005 2006 2007 Group 1 Group 2 Figure 6 Vaccinations.
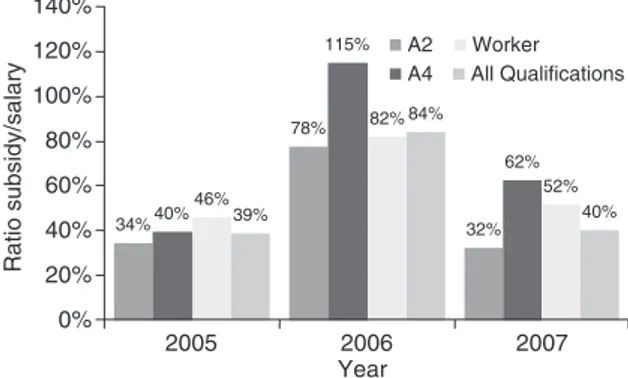
Knowing that for example, a monthly average salary of an auxiliary nurse A2 was 45 000 FRW in 2005, 46 000 FRW in 2006 and 92 315 FRW in 2007, meant that the PBF strategy added a substantial part to the income of the personnel as shown in Table 3 and Figure 9. The increase amounted to approximately 32–78% of the base salary of an auxiliary nurse A2 as shown in Figure 9. However, in 2005, a ceiling was applied to the amount paid to the HCs because of budgetary constraints. This ceiling was lifted in 2006 with more funds becoming available.
The average ratio subsidy ⁄ salary of 39% in 2005 rose to 84% in 2006 for all categories of personnel confounded. A
considerable rise of the salaries introduced by the Ministry of Health in 2007 reduced the ratio for that year to an average of 40%. More generally, the subsidies paid to the HCs by BTC in 2005 and the Rwandan Government in 2006 and 2007 amounted to $0.20 ⁄ cap ⁄ year. In addition, an estimated amount of $0.05 ⁄ cap ⁄ year was spent by BTC from 2005 to 2007 for administration, supervision and training. 0% 5% 10% 15% 20% 25% 30% 35% 40% 45% 50% 55% 60% 65% 70% 75% 80% 85% 90% 95% 100% 1 2 3 4 5 6 7 8 9 10 11 12 1 2 3 4 5 6 7 8 9 10 11 12 1 2 3 4 5 6 7 8 9 2004 2005 2006 2007 Prenatal cons. Growth monitoring cons. Family planning Deliveries in HC Completely vaccinated Curative cons.
Figure 7 Quality of services achievement in group 1.
Table 2 Monthly average and median of subsidies received by the health centre (in FRW – US$1 = 555 FRW)
2005 2006 2007 All HC 144 070 342 477 408 104 129 572 293 775 371 950 Group 1 144 070 361 022 408 257 129 572 296 425 377 400 Group 2 306 362 407 803 280 850 358 400 0% 5% 10% 15% 20% 25% 30% 35% 40% 45% 50% 55% 60% 65% 70% 75% 80% 85% 90% 95% 100% 105% 1 2 3 4 5 6 7 8 9 10 11 12 1 2 3 4 5 6 7 8 9 2006 2007 Curative cons. Prenatal cons. Growth monitoring cons. Family planning Deliveries in HC Completely vaccinated
Figure 8 Quality of services achievement in group 2.
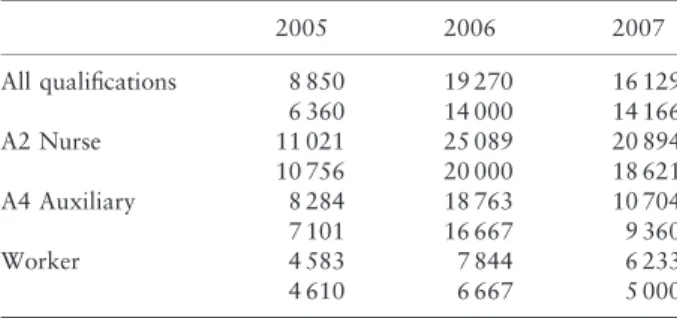
Table 3 Monthly average and median of subsidies received per health worker category (in FRW-US$1=SSS FRW)
2005 2006 2007 All qualifications 8 850 19 270 16 129 6 360 14 000 14 166 A2 Nurse 11 021 25 089 20 894 10 756 20 000 18 621 A4 Auxiliary 8 284 18 763 10 704 7 101 16 667 9 360 Worker 4 583 7 844 6 233 4 610 6 667 5 000
Discussion
According to international literature and reports, for a long time PBF was considered a strong incentive for health staff to increase the quantity or volume of their activities, especially in Rwanda where PBF replaced a former fixed bonus system it showed to increase this output. However, the factor that enabled health facilities to score better in volume increase through PBF might have been a better financial accessibility through the reduction of user-fees by health facilities and through the start-up of community health insurances. In our study, the only quantity increase through PBF was observed for activities, which were previously less well organized, child growth monitoring services and institutional deliveries (Figures 1 and 2). For both activities, the involvement of community health workers, who were subcontracted by the HC receiving a small bonus for every referred client, played on important role.
Given the multiplicity of health initiatives, in particular the community health insurance schemes implemented since 2002 in all districts with an increasing membership of the population, and other national health sensitization campaigns, it is difficult in this operational setting without a proper control group, to tear apart the effects related to PBF from those other effects. Notwithstanding the fact that PBF showed limited impact on volume of services, enor-mous improvements on quality of all healthcare services (Figures 7 and 8) were observed.
A quality healthcare service was defined as a service delivered according to (inter)national norms and stan-dards. In Rwanda, as in most other countries where first-line services are commonly assured by nurses and paramedics, internationally recommended instructions for anamnesis, clinical examination and correct treatment as well as for preventive care are indicated on standardized
tools such as consultation record forms for preventive consultations, partograms for deliveries and the use of clinical algorithms for curative consultations and others. Correct and complete record forms for every patient, verified by qualified and experienced supervisors, were considered as valuable quality criteria.
The monthly supervisions, combined with an auto-evaluation of the activities performed by the HC, induced furthermore a continuing learning process boosted by the fact that only ‘quality assured’ services were paid for. This shows, as some authors point out, that ‘simple dissemina-tion of written guidelines is often ineffective and supervi-sion and audit with feedback is generally effective’ (Rowe et al. 2005).
It was also expected that health staff would over-report their activities in the absence of adequate disin-centives such as application of clear sanctions. Indeed some over-reporting of cases was seen in the first months after implementation of PBF because of human errors in monitoring rather than real abuse. This was quickly corrected by the monitoring and supervision structures put in place at district and central level. However, the role of ‘third-party’ reviews in the verification of results should be institutionalized and reinforced, for example, by conditioning the payment to community satisfaction.
The substantial PBF financial incentives (Tables 2 and 3) provided to the HCs do probably not explain solely the results achieved. Literature identifies financial incentives as key in triggering motivation of health workers but those are neither the most important nor sufficient to achieve substantial improvements in service delivery or a change in health workers behaviour (Mathauer & Imhoff 2006). Strengthening of other components of the health system, such as data collection, monitoring and integrated supervision, contributed in our opinion far more to the results (i.e. quality improvement) achieved. Further study on cost-effectiveness of PBF (i.e. cost per additional%, case or point gain of an indicator that is attributable to PBF) as implemented in Rwanda, should be undertaken and compared with other quality improving initiatives.
If PBF is an adequate strategy to increase efficiency of existing staff by improving quality of health services, it is unclear if it will correct for the supply of health workers that is necessary to overcome the shortage and misdistri-bution of health workers. One of the reasons to implement PBF in Rwanda was to increase productivity as an alternative to more conventional strategies to do so. However, reports exist of already overwhelmed HCs, suggesting that an increase in investment and recurrent expenditure for human resources is still necessary. The introduction of the PBF strategy in Rwanda was not a mere 34% 78% 32% 40% 115% 62% 46% 82% 52% 39% 84% 40% 0% 20% 40% 60% 80% 100% 120% 140% 2005 2006 2007 Year Ratio subsidy/salary A2 A4 Worker All Qualifications
Figure 9 The annual average ratio ‘subsidy ⁄ salary’ per health worker category.
change in the remuneration of health providers. The strategy was also based on a clarification of the responsi-bilities and roles of the various parties involved in the integrated supervision, monitoring and provision of health services. This was achieved through the introduction of contracting-in mechanisms that clearly defined the roles and the responsibilities of the various parties, the moni-toring system used, the outputs to be purchased, financial incentives provided and the conditions for payment to the health facility. The PBF strategy in Rwanda built on essential quality assurance mechanisms such as integrated formative supervisions. Therefore, this PBF strategy should be maintained in order to preserve the quality of health services.
References
Mathauer I & Imhoff I (2006) Health worker motivation in Africa: the role of non-financial incentives and human resource management tools. Human Resources for Health 4, 24.
Meessen B, Musango L & Kashala JP (2006) Output-based payment to boost staff productivity in public health centers: contracting in Kabutare district, Rwanda. Bulletin of the World Health Organization 85, 108–115.
MoH (2007) Interim Demographic Health Survey. MoH, Rwanda. Rowe AK, de Savigny D, Lanata CF & Victora CG (2005) How
can we achieve and maintain high-quality performance of health workers in low-resource settings? Lancet 366, 1026–1035.
Soeters R, Habineza C & Peerenboom PP (2006) Performance-based financing and changing the district health system: expe-rience from Rwanda. Bulletin of the World Health Organization 84, 884–889.
WHO (2003) The Role of Contractual Arrangements in Improving Health Systems’ Performance. Fifty-sixth World Health Assembly 2003, WHA56.25 Agenda Item 14.13. WHO, Geneva.
WHO (2005) Application of Contracting in Health Systems: Key Messages. Technical Briefs for Policy Makers.