Université de Montréal
Deux études spectroscopiques d’objets évolués et compacts
par Caroline Pereira Département de physique Faculté des arts et des sciences
Mémoire présenté à la Faculté des études supérieures en vue de l’obtention du grade de
Maître ès sciences (M.Sc.) en physique
Août, 2005
C)
-L
dl1
de Montréal
Direction des bibliothèques
AVIS
L’auteur a autorisé l’Université de Montréal à reproduire et diffuser, en totalité ou en partie, par quelque moyen que ce soit et sur quelque support que ce soit, et exclusivement à des fins non lucratives d’enseignement et de recherche, des copies de ce mémoire ou de cette thèse.
L’auteur et les coauteurs le cas échéant conservent la propriété du droit d’auteur et des droits moraux qui protègent ce document. Ni la thèse ou le mémoire, ni des extraits substantiels de ce document, ne doivent être imprimés ou autrement reproduits sans l’autorisation de l’auteur.
Afin de se conformer à la Loi canadienne sur la protection des renseignements personnels, quelques formulaires secondaires, coordonnées ou signatures intégrées au texte ont pu être enlevés de ce document. Bien que cela ait pu affecter la pagination, il n’y a aucun contenu manquant.
NOTICE
The author of this thesis or dissertation has granted a nonexclusive Iicense allowing Université de Montréal to reproduce and publish the document, in
part
or in whole, and in any format, solely for noncommercial educational and research purposes.The author and co-authors if applicable retain copyright ownership and moral rights in this document. Neither the whole thesis or dissertation, nor substantial extracts from it, may be printed or otherwise reproduced without the author’s permission.
In compliance with the Canadian Privacy Act some supporting forms, contact information or signatures may have been removed from the document. While this may affect the document page count, it does flot represent any loss of content from the document.
Faculté des études supérieures
Ce mémoire intitulé:
Deux études spectroscopiques d’objets évolués et compacts
présenté par:
Caroline Pereira
a été évalué par un jury composé des personnes suivantes:
Gilles Fontaine, président-rapporteur
Pierre Bergeron et François Wesemael, directeur de recherche
Pierre Brassard, membre du jury
\r
Nous présentons deux études spectroscopiques d’objets évolués et compacts. D’abord, nous soulignons la découverte de variations spectroscopiques dans la naine blanche de type spec tral DAB, CD 323. L’analyse simultanée de spectres visibles de CD 323 et de PG 1234+482, une DA non-variable, nous permet de trouver des variations quasi-périodiques des raies d’hy drogène et d’hélium. De pius, les raies d’hydrogène varient hors-phase avec la raie He I À4471. Cette découverte suggère un modèle d’atmosphère avec des abondances inhomogènes plutôt que celui d’une atmosphère stratifiée. Ensuite, nous vérifions la cohérence entre les paramètres atmosphériques dérivés à partir de spectres visibles et les observations dans l’ultraviolet loin tain pour un échantillon de neuf sous-naines. Nous avons calculé une grille de modèles d’at mosphères hors-ETL d’hydrogène pur, et une incluant de l’hélium. Nous avons ensuite obtenu des valeurs de Tff et log g en utilisant les raies de Balmer. Ces données permettent de prédire le flux ultraviolet et, après les avoir normalisés à la magnitude Strômgren y, nous comparons ces spectres avec les observations. Nous trouvons un bon accord pour les objets avec Teff <
3 1,000 K lorsqu’on tient compte de la présence d’éléments lourds et du rougissement interstel laire. Pour les étoiles avec Teff > 31,000 K, nous remarquons une incohérence. Notamment, les raies prédites sont trop larges et le niveau du continu trop faible. Nous examinons les effets des éléments lourds sur les modèles d’atmosphères; pour des abondances solaires, l’effet est prononcé dans la région de l’ultraviolet lointain ce qui pourrait expliquer le désaccord observé.
Mots cÏefs:
étoiles: atmosphères, individuel (GD 323), naines blanches, paramètres fondamentaux, sous naines techniques: spectroscopique
We present two spectroscopic studies of compact and evolved objects. Firstly, we report the discovery of spectroscopic variations in the DAB white dwarf GD 323. Using simultaneous optical spectroscopic observations of our target star and of a non-variable DA white dwarf, PG 1234+482, we find quasi-periodic variations in both hydrogen and helium features on a timescale of hours. The hydrogen lines vary in opposite phase from that of He I À4471 and the amplitude variations of the equivalent width of H/ are 309. This result suggests an inhomogenous surface composition rather than a stratffled atmosphere. We also investigate the consistency between atmospheric parameters derived from optical spectra of subdwarf B stars and the far-ultraviolet continuum flux. Optical and far-ultraviolet spectra were secured for a sample of nine sdB stars and pure hydrogen and mixed hydrogen-helium NLTE model
atmosphere grids were computed. Using the Balmer line fitting technique, we derive values for Teff and log g and use these to predict the ultraviolet flux which is then normalized at
the observed Strmgren y magnitude. We find good agreement for stars with Teff < 31,000 K when some allowance is made for metal hue blanketing and for the presence of small amounts of interstellar reddening. For objects with Teff > 31,000 K we find a systematic discrepancy: the predicted line profiles are too wide and the continuum flux level too how. We examine the effects of including hue blanketing of heavy elements in solar abundances in our models and find signiflcant effects in the far-ultraviolet range that could explain these inconsistent results.
Snbject headings:
stars: atmospheres, fundamental parameters, individual (GD 323), subdwarfs, white dwarfs,
Sommaire i
Abstract ii
Table des matières iii
Liste des figures y
Liste des tableaux vii
1 Introduction 1 2 Article 5 2.1 Abstract 6 2.2 Introduction 6 2.3 Observations 8 2.3.1 Data Acquisition 8 2.3.2 Data Reduction 9
2.4 A Search for $pectroscopic Variations in GD 323 11
2.4.1 Single-Night Variations in Equivalent Widths 11
2.4.2 Error Analysis 12
2.4.3 $ingle-Night Variations in Calibrated Spectra 13 2.4.4 Single-Night Variations in IRAF-calibrated and Uncalibrated Spectra 14
2.5 Discussion 2.6 References 2.7 Figures 3 Article 3.1 3.2 3.3 Abstract Introduction Observations 3.3.1 Optical Spectra 3.3.2 Far-Ultraviolet Spectra 3.4 Model Calculations
3.5 NLTE vs LTE and the Importance of Line Blanketing from Heavy 3.6 Fits to the Balmer Lines
3.6.1 The Impact of the Helium Abundance 3.7 The Lyman Lines
3.7.1 A First Look at the Resuits
3.7.2 Interstellar Extinction and the Intermediate Temperature 3.7.3 The Hot Objects
3.8 Conclusions 3.9 References 3.10 Figures 4 Conclusion Bibliographie 62 65 69 14 18 20 29 30 30 32 32 33 34 35 36 36 37 38 39 40 42 48 50 Elements . Objects . . Remerciements
2.1 Optical spectra of GD 323 (2004 February 10) 21
2.2 Optical spectra of GD 323 (2004 February 11-14) 22
2.3 Template spectrum superimposed on a typical spectrum of GD 323 23 2.4 Equivalent widths as a function of time (hours UT) for the spectra of GD 323
taken on 2004 February 10 24
2.5 Division of fitted template spectrum of GD 323 by observed spectra 25 2.6 Equivalent widths as a function of relative time (in hours) for the spectra of
GD 323 taken over five nights 26
2.7 Comparison of template spectrum of GD 323 with data of Koester et al. (1994) 27 2.8 Sample optical spectra of models with a pure helium equatorial baud and pure
hydrogen polar caps 28
3.1 Optical spectra of our sample objects . 51
3.2 FUSE spectra of our sample objects. . 52
3.3 LTE corrections 53
3.4 Balmer une fits 54
3.5 Lyman hue fits 55
3.6 Predicted ultraviolet spectra determined from Balmer hine fits using our pure
hydrogen NLTE model grid 56
3.7 Same as 3.6 57
3.8 Reddening corrections 58
3.10 Balmer une fit of STERNE synthetic spectra 60
3.1 Sample Objects . 3.2 FUSE Data 3.3 Derived Pararneters 3.4 Hydrogen vs Helium 44 45 46 47
Introduction
Lorsqu’une étoile termine sa vie relativement paisible sur la séquence principale, elle en tame une série de phases évolutives, autant tranquilles que violentes, qui la mèneront à sa fin: celle d’un cadavre stellaire. En effet, après avoir épuisé son carburant nucléaire, l’étoile subit une succession d’expansions des couches externes et de contractions du coeur, et ce, jusqu’à ce qu’elle devienne instable. L’état final de l’étoile dépend en grande partie de sa masse initiale et, dans 90% des cas, l’évolution stellaire mène à une éjection de l’enveloppe externe, laissant ainsi un noyau central très compact et très chaud. Toute étoile ayant une masse inférieure à $ M® termine sa vie de cette façon et devient une naine blanche. Ces objets sont caractérisés par des masses d’environ 0.6 M® et des rayons comparables à celui de la Terre. N’ayant plus de fusion nucléaire, elles se refroidissent avec le temps. De plus, elles sont composées d’un coeur de matière dégénérée entouré d’une mince enveloppe et résistent à l’effondrement gravitationnel grâce à la pression engendrée par un gaz d’électrons dégénérés.
Toutefois, il arrive que durant ce qu’on appelle le flash d’hélium, une phase qui déclenche de nouveau les réactions nucléaires après le premier épisode d’expansion/contraction, l’étoile perde une quantité substantielle de masse. Ce qui reste est un noyau d’hélium, très dense, qui continue de brûler, et qui est entouré d’une enveloppe d’hydrogène inerte et très mince (< 0.02 M®). Ces étoiles sont des sous-naines et elles se situent sur la branche horizontale extrême du diagramme Hertzprung-Russell. Elles partagent plusieurs points en commun avec les naines blanches, telles leur masse (‘—i 0.55 M®) et leur densité élevée, et aussi le fait qu’il s’agisse
d’objets dans un stade final de l’évolution stellaire. On croit que les sous-naines deviennent des naines blanches de faible masse lorsque leur carburant nucléaire est épuisé. En d’autres termes, les sous-naines sont les progéniteurs d’une fraction des naines blanches.
Les naines blanches et les sous-naines sont caractérisées par des propriétés atmosphériques (température effective, gravité de surface, et abondances chimiques) diverses. Dans le cas des naines blanches, la majorité d’entre elles sont classifiées DA, c’est-à-dire ayant des spectres qui ne montrent que des raies d’hydrogène. Cette pureté s’explique en partie par le phénomène de diffusion: le champ gravitationnel intense qui caractérise les naines blanches (log g ‘--i 8.0) fait en sorte que les éléments lourds coulent vers le fond de l’atmosphère, tandis que les éléments plus légers remontent vers la surface. Cependant, on retrouve aussi des naines blanches qui possèdent des atmosphères riches en hélium. Cela signifie qu’il existe d’autres processus qui entrent en compétition avec le tri gravitationnel, telle la convection. Dans le cas des DB, des étoiles relativement froides (Teif < 30, 000 K), ce sont des raies d’hélium neutre que l’on détecte, alors que les DO (Teff > 45, 000 K) montrent des raies d’hélium ionisé (Wesemael et al. 1993).
Du côté des sous-naines, nous utilisons aussi une nomenclature spectrale. De façon générale, les sdB sont des étoiles ayant des spectres dominés par des raies de Balmer sur lesquelles se su perposent de faibles raies d’hélium neutre, tandis que les sdOs, étant des étoiles plus chaudes, affichent des raies d’hélium ionisé. Par ailleurs, o remarque que la pureté chimique qui dis tingue les naines blanches est moins évidente dans les sous-naines, car les atmosphères de ces dernières coiltiennent des traces de plusieurs éléments lourds tels le fer et le carbone.
La spectroscopie est un outil indispensable dans l’analyse atmosphérique de ces deux classes d’étoiles puisqu’une foule d’informations peut être extraite de ces données. Nous présentons ici deux analyses spectroscopiques d’étoiles compactes et évoluées.
Dans le premier cas, nous nous penchons sur l’énigmatique naine blanche GD 323. Cette étoile est le prototype d’une classe particulière de naines blanches: les DAB. Ces étoiles, relativement rares, présentent à la fois des raies d’hydrogène et des raies d’hélium dans leur spectre. Toutefois, cette classe d’objets ne représente pas un groupe homogène. Dans certains cas, les observatiolls s’expliquent par un système binaire non-résolu composé de deux naines
blanches — une de type DA et une de type DB. D’autres scénarios, impliquant par exemple
l’accrétion, peuvent également expliquer la présence simultanée d’hydrogène et d’hélium. Par contre, CD 323 résiste toujours aux interprétations. Parmi les hypothèses proposées depuis sa découverte en 1984, aucune ne semble expliquer entièrement les observations. Jusqu’à récemment, le modèle le plus favorable était celui d’une atmosphère stratifiée où une couche d’hydrogène très mince ‘flotte’ sur une enveloppe d’hélium, nous permettant ainsi de détecter les deux éléments (Koester et al. 1994). D’autres modèles ont été proposés, entre autres celui d’une atmosphère homogène et aussi celui d’une atmosphère inhomogène. Par contre, aucun de ces modèles n’est adéquat, d’où l’importance de réétudier le problème.
Une question essentielle est celle de la variabilité spectroscopique. Si nous pouvions détecter des variations dans les largeurs équivalentes des raies, cela impliquerait qu’il y a des variations d’abondances chimiques à la surface de GD 323, favorisant ainsi le modèle d’une atmosphère inhomogène plutôt que stratifiée. Nous avons entrepris cette étude délicate, et avons essayé de détecter des variations soit sur une courte échelle de temps (quelques heures) ainsi que sur une échelle de temps plus longue (quelques jours). Nous présentons les résultats de cette analyse dans le chapitre 2.
Dans la deuxième étude, nous vérifions si les paramètres atmosphériques déterminés à partir de spectres visibles de sous-naines sont compatibles avec des données dans la région de l’ultraviolet lointain. Les paramètres atmosphériques nous donnent des informations impor tantes, qui nous aident ensuite à mieux comprendre les processus physiques qui ont lieu dans ces étoiles. Actuellement, plusieurs techniques existent qui nous permettent de déterminer ces paramètres. Une de ces techniques, utilisée de façon courante dans le domaine des naines blanches, est celle de l’analyse des raies de Balmer. Cette méthode s’applique également aux sous-naines, et nous permet ainsi d’estimer les valeurs de température effective et de gravité de surface.
En théorie, cette méthode pourrait également s’appliquer aux raies de Lyman dans l’ul traviolet. D’abord, ce genre d’analyse pourrait nous permettre d’avoir accès à une autre façon de déterminer les paramètres atmosphériques puisqu’il arrive parfois qu’on soit incapable de le faire en utilisant des spectres visibles. Ceci est le cas, par exemple, pour certains systèmes
binaires. De plus il serait possible de s’assurer qu’il existe une cohérence entre les paramètres obtenus à partir des raies de Lyman et à partir des raies de Balmer. Ce type d’étude est désormais possible grâce au satellite FUSE (Far UttTaviotet Spectroscopic Explorer) qui fut déployé en 1999, et qui nous permet de détecter les raies de Lyman à partir de Ly3.
Une telle étude fut réalisée par Barstow et al. (2001, 2003) et Good et al. (2004) pour les naines blanches de type DA et DAO, respectivement. Dans ce cas, ils ont déterminé de façon indépendante les paramètres atmosphériques à partir de spectres FUSE et de spectres visibles. Leurs résultats montrent qu’il existe un bon accord pour des objets ayant des températures inférieures à ‘—i 50,000 K. Une divergence apparaît pour les objets plus chauds.
Une analyse semblable peut également être complétée pour les sous-naines. Dans le cha pitre 3, nous présentons une analyse d’un échantillon de neuf sous-naines de type spectral B.
Article
DI$COVERY 0F $PECTRO$COFIC VARIATIONS IN THE
DAB WHITE DWARF GD 323
C. Pereira, P. Bergeron, and F. Wesemael
Département de Physique, Université de Montréal, C.P. 6128, Succ. Centre-Ville, Montréal, Québec, Canada, H3C 3J7.
The Astrophysicat Journal, 623: 1076-Ï0&2, 2005 Aprit 20 Received 2004 December 9; accepted 2005 January 26
2.1
Abstract
We report the discovery of spectroscopic variations in GD 323, the prototypical DAB white dwarf. Simultaneous optical spectroscopic observations over five consecutive nights of GD 323 and of PG 1234+482, a non-variable comparison DA white dwarf of similar brightness, are used to reveal quasi-periodic variations in both the hydrogen and helium absorption unes over a timescale of hours. The amplitude of the variation of the equivalent width of Ht3 is 30 %. Moreover, the strength of the hydrogen unes is shown to vary in opposite phase from that of He i M471. These results suggest that the model currently thought to be the most viable to account for the simultaneous presence of hydrogen and helium unes in GD 323, namely a static stratified atmosphere, may need to be reexamined. Instead, a model with an inhomogeneous surface composition, resulting perhaps from the dilution of a thin hydrogen atmosphere with the underlying helium convection zone, may 5e a better representation of GD 323. The observed variation timescale of 3.5 hours is consistent with the slow rotation rate of white dwarf stars.
2.2
Introduction
The DAB stars represent a class of white dwarfs with hybrid sjectra, as weak neutral helium unes are superposed onto the classical hydrogen-line spectrum of DA stars (see, e.g., Wesemael et al. 1993). The prototype of this class, GD 323 (WD 1302 + 597; V = 14.52), was
discovered independently by Oke et al. (1984) and Liebert et al. (1984). The latter made the first attempts at modeling the unusual hybrid spectrum of CD 323, and their resuits have since been updated and considerably upgraded by Koester et al. (1994) on the basis of a set of high-quality optical spectra of that star. Koester et al. (1994) were led to conclude that a stratified atmospheric structure, consisting of a thin (10g MH/M* = —16.8) hydrogen layer
floating on top of a helium envelope, remained the “most promising” explanation of the bulk of the properties of GD 323.
Since this initial discovery, several additional stars spectroscopically classified as DAB stars have been unearthed: G104—27 (Holberg et al. 1990), H$ 0209+0832 (Jordan et al.
1993), MCT 0128—3846 and MCT 0453—2933 (Wesemael et al. 1994), PG 1115+166 (Bur leigh et al. 2001; Bergeron & Liebert 2002) and, most receiitly, PG 1603+432 (Vennes et al. 2004). The sample of DAB stars is quite inhomogeneous, however, as several distinct mecha nisms have been called on to account for individual objects: thus, GD 323 could be a stratified object, while it has been argued in the discovery papers cited above that MCT 0128—3846, MCT 0453—2933, and P0 1115+166 are unresolved DA+DB binaries. This has now been confirmed for P0 1115+166 (Maxted et al. 2002) and MCT 0453—2933 (Napiwotzki & the SPY Consortium 2005). Furthermore, HS 0209+0832, while initially thought to be charac terized by a homogeneous atmosphere (Heber et al. 1997a), now appears to be undergoing accretion (Wolff et al. 2000). The last object added to the list, PG 1603+432, seems charac terized by a homogeneous composition.
Among those stars, the prototype CD 323 is perhaps the most thoroughly studied object. In their detailed analysis, Koester et al. (1994) investigate four distinct models: homogeneous and stratified composition, unresolved binary and spotted star. Despite this variety of options, they conclude that none of these models provides a completely satisfactory fit to the data, but that the stratified model is the most acceptable match. Given this ambiguous outcome, further investigations of these models appear in order.
An important ingredient in defining the correct model for GD 323 could be the question of variability. While the white light photometry of Robinson 8 Winget (1983) excludes pho tometric variations at the 0.25% level in the range 10—1200 s, it was suggested by Liebert et al. (1984) that the object be monitored for spectroscopic variations. This need became more acute with the report by Kidder et al. (1992) that the weak 11e I unes, initially observed by Holberg et al. (1990) in data at high S/N on the DAB star 0104-27, were not seen in later spectra of comparable quality. A similar situation is encountered in HS 0209+0832, in which Heber et al. (1997a) report changes in the strength of the neutral and ionized helium unes over a one-year period. In GD 323, earlier spectra obtained by Liebert et al. (1984) and by J. L. Greenstein initially displayed by Koester (1991a,b) and Wesemael et al. (1993) unfortunately cannot provide any firm conclusion about the variability of that object, as these were obtained with different instrumental setups and spectroscopic resolutions.
To investigate whether GD 323 is a spectroscopic variable, Koester et al. (1994) obtained a series of fine high signal-to-noise ratio, Z
Â
resolution spectra of that object, ail secured with an essentially identical instrumental setup. Six of these spectra were obtained within a single night, while the other three had been secured, respectively 15 days, 9 months, and one year earlier. On the basis of these spectra, the best and most homogeneous set secured at that time for a DAB star, Koester et al. (1994) concluded that the available data were compatible with the assumption that the star showed no variability. However, it was our feeling at the time that, while it was clear that there were no large-amplitude changes in the hue spectrum of GD 323, the signal-to-noise ratio of the individual spectra was good enough to permit a much more detailed analysis of the variability of GD 323 than had been carried out by Koester et al. (1994). This was undertaken independently by Wesemael et al. (1995), but their analysis could not quite meet the burden of proof associated with an investigation of this type: while their results suggested the presence of small spectroscopic variations in the Koester et al. (1994) data, their analysis also showed that a well-planned observing strategy and a rigorous data reduction process would both be required in order to build a stronger case for the presence, or absence, of low-level spectroscopic variations in GD 323.Recently, the opportunity arose to revisit the issue of spectroscopic variabihity of GD 323, and we succeeded in securing new data for that object that sheds some light on this 20 year-old problem. This paper summarizes the resuits of this revamped investigation.
2.3
Observations
2.3.1
Data Acquisition
As discussed above, the study of Koester et al. (1994) reveals that the spectroscopic varia tions in GD 323, if any, are quite small. Hence a careful observing strategy had to be developed to ensure that any variabihity detected in a series of time-resolved spectroscopic observations is intrinsic to the star and not the result of changes in the atmospheric transparency or of an artifice introduced in the data reduction. The best way to assess the variability of CD 323 is to secure in parallel spectroscopic observations of a constant comparison star. Ideally,
one would like to have both CD 323 and the comparison star on the sut in order to obtain simultaneous time-resolved spectroscopic observations. Unfortunately, no such star could be found in the vicinity of GD 323, and we had to rely on a different strategy.
We thus selected a comparison star based on the following set of criteria: firstly, we required a star with no known variations. We also required an object whose magnitude was similar to that of CD 323 (V = 14.52). Furthermore, we demanded that our comparison object have few
spectral unes and a spectral energy distribution comparable to that of GD 323. Finally, we wanted an object that was as close as possible to our target object in the sky. Examination of the Catalog of Spectroscopically Identified White Dwarfs of Mccook Sion (1999) revealed that the DA star PC 1234+482 was the most judicious choice. Past observations of PC 1234+482 have shown no evidence for variability, it has a visual magnitude of V 14.42, and with an effective temperature of Teif = 55,040 K (Liebert et ai. 2005, hereafter LBH),
its spectrum consists of a well-defined continuum with only weak hydrogen lines. Finaiiy, PC 1234+482 and CD 323 are separated by approximately 15 degrees on the sky.
Since we did not know a priori over what timescales variations might occur, we carried out spectroscopic observations over five consecutive nights, from 2004 February 10 to 14. Both CD 323 and PC 1234+482 were monitored for over 5 hours on the first night, arid for about an hour on the remaining nights. These optical spectra were secured using the Steward Observatory 2.3 m reflector telescope equipped with the Bolier & Chivens spectrograph and a Loral CCD detector. A 4.5 arcsec slit and a 600 line mm1 grating in first order provided a spectral coverage of 3200-5300
À
at a resolution of 6À
FWHM. Each 600 s spectroscopic observation of CD 323 was immediateiy followed by a 600 s exposure of PG 1234+482. The average signai-to-noise ratio per pixel and per exposure is 85 for CD 323 and 100 for PC 1234+482. In total, 27 spectra of CD 323 and 25 spectra of PC 1234+482 were secured, the vast majority of them under excellent observing conditions.2.3.2
Data
ReductionThe optical spectra were extracted and wavelength-calibrated using the Image Reduction and Analysis Facility (IRAF) standard package. A flrst cut at the flux caiibration was obtai
ned with IRAF using the variousflux standards secured during the observing nights. However, in the course of our analysis, we realized that we could take advantage of our multiple spec troscopic observations of PC 1234+482, and use this star instead as a flux standard, at least in a relative sense. This method is analogous to that used for taking high-speed photometric observations of variable stars, where a constant comparison star is used to correct the light curve of the target star. The detailed procedure used in the reduction of our spectroscopic observations thus proceeded as follows.
The flrst step was to combine our 25 individual spectra of PC 1234+482, flux calibrated with IRAF as described above. This combined spectrum, characterized by a signal-to-noise ratio of 340, was then fltted with a grid of synthetic white dwarf spectra, from which we derived Teff = 54, 200 K and logg = 7.77. This effective temperature is within 1.5 % from that
derived by LBH on the basis of a lower signal-to-noise ratio spectrum. A synthetic spectrum calculated with these atmospheric parameters, which matches extremely well the combined observed spectrum, now serves as a noiseless template for the rest of the analysis. Flux calibra tion functions were then obtained by simply dividing this template by the individual unfluxed spectra of PC 1234+482 and smoothing the result with a 9-point filter. The application of these smoothed flux calibration functions to the unfluxed spectra of PC 1234+482 ensures that each resulting spectrum matches the synthetic template perfectly. The fluxed spectra for PC 1234+482 are shown in the right panel of Figure 2.1 for the first night, and in the right panel of Figure 2.2 for the remaining nights.
The next step was to use these derived functions to flux-calibrate the spectroscopic ob servations of CD 323. Speciflcally, we calibrate each spectrum of CD 323 with the function derived from the observation of PC 1234+482 that immediately follows. The resulting flux calibrated spectra of GD 323 are displayed in the left panels of f igures 2.1 and 2.2. There are two main advantages to our approach: flrst we obtain flux calibrated spectra of our target star that are as independent as possible of the flux calibration provided by IRAF. Here, the IRAF package is used only to generate the average spectrum of PG 1234+482 used to define the noiseless synthetic template of that star. Once this template is deflned, the uncoupling from IRAF in the procedure that geneiates çalibrated spectra of CD 323 is complete (IRAF
spectra are used to generate our error estimate in
§
3). This is a substantial advantage, giventhat the flux calibration is recognized to be the most delicate step of the reduction procedure. In addition, because of the nearly simultaneous observations of CD 323 and PG 1234+482, our method allows us to monitor small temporal changes in the atmospheric transparency.
As will be discussed further below, our conclusions about the variability of CD 323 do flot hinge on the flux calibration procedure developed here, although the quality of the resuits has certainly benefited from this approach. One should also note that we did not worry about calibrating our spectra in terms of absolute fluxes, as we are mainly interested here in relative flux variations.
2.4
A Search for Spectroscopic Variations in GD 323
2.4.1 Single-Night Variations in Eqiiivalent Widths
With our calibrated spectra in hand, we search for spectroscopic variations by measuring the equivalent widths of the most important hydrogen and helium absorption unes. The most
delicate step in this procedure is to define the continuum in order to normalize the individual une profiles. A simple average over a few pixels on each side of the line is not accurate enough and can introduce undesirable uncertainties in the equivalent width measurements. We rely instead on a procedure similar to that outlined in LBH to define the location of the continuum in the far wings of the hydrogen Balmer lines.
We flrst construct a very high signal-to-noise template spectrum by combining ouf 27 spectroscopic observations of CD 323. This template spectrum displayed at the top of Figure 2.2 is then forced to match each single observation of CD 323 by multiplying the template by a polynomial of flfth degree in ). The resuit of this procedure for a typical spectrum of CD 323 is illustrated in Figure 2.3. We deflne the continuum level over a given interval on the basis of the monochromatic flux in the template spectrum at the boundaries of the interval. We choose the following intervals over which the equivalent widths are to be measured: 4800-4925
À,
4275-4425À,
4065-4150À,
corresponding to H3, H-y, and H5, respectively, as well as 4430-4510À
and 4680-4750À
for the He I À4471 and He I M713 features, respectively. Weconcentrate on these features since they are the strongest unes in the spectrum; other unes are visible, but are either weak or blended and can only be measured with difficulty. Furthermore, the wavelength intervals are chosen to include as nrnch of the une wings as possible, while avoiding blending. The intervals over which the equivalent widths are measured are reproduced in Figure 2.3.
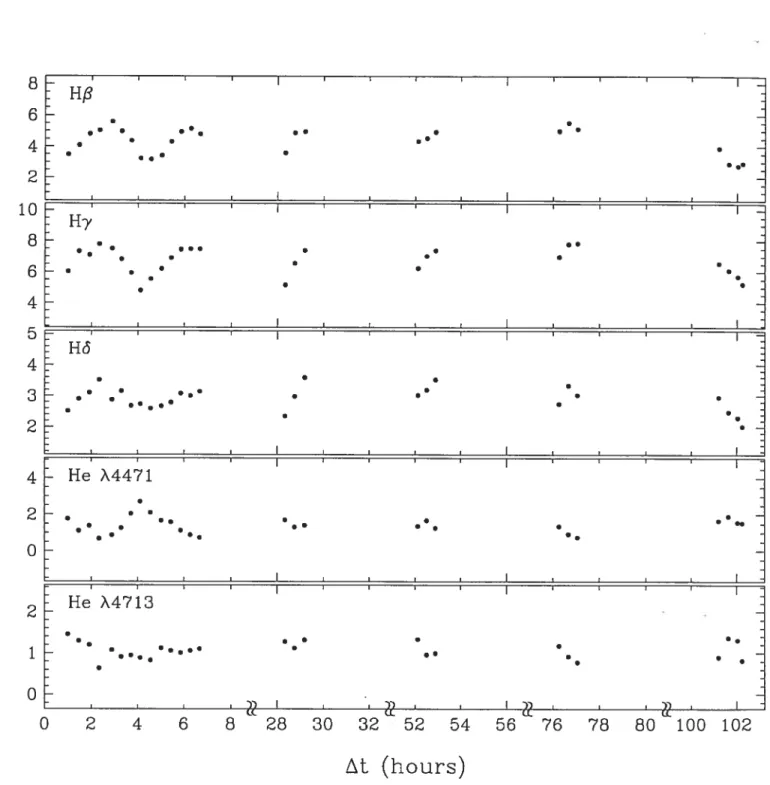
The equivalent width measurements as a function of time for the three hydrogen and the two neutral helium absorption unes in GD 323 are displayed in Figure 2.4 for the 14 spectra secured within the single night of 2004 February 10. These results show clearly that the hydrogen and He I À4471 line strengths of GD 323 vary with time,and that these variations
appear to be quasi-periodic. This was by no means expected, as we could very well have detected random variations, or no variations at ail. Moreover, the observed variations occur on a relatively short timescale, with the feature strengths going from a maximum to a minimum over the course of a few hours only. Even more surprising, the variations of the hydrogen lines and M471 appear to be out of phase: as the hydrogen unes (especially H3 and H7) get stronger, the helium une weakens and vice versa. The case for He I )4713 is admittedly much
weaker ai-id we cannot, at this stage, account completely for its behavior: while the une is reasonably strong and unaffected by blending, the variations it displays appear more muted than those observed in M471, and their phasing with the hydrogen unes much less obvious.
2.4.2 Error Analysis
A preliminary estimate of the errors in the equivalent width measurements for the three hydrogen unes in GD 323 has been obtained from a consideration of the spectrum of the comparison star PG 1234+482. We have measured the equivalent widths for each line on the 13 individual fluxed spectra of that star secured on 2004 February 10. The rms error on the equivalent widths reftects the S/N ratio of the individual spectra and the reliability of the procedure used to set the continuum level
(
2). They amount to 0.03Â
for H3, 0.0$À
for H7, ai-id 0.03À
for Hï. These errors can be considered as lower limits, as the use of smoothed flux calibration functions applied to the raw individual spectra of PG 1234+482 guarantees a perfect match of the continuum flux in individual spectra with the template of that star. Whenthe same smoothed flux calibration functions are applied to the raw individual spectra of GD 323, the match to the average, or template, spectrum of GD 323 is not as good, since residual calibration errors remain. It is not possible to evaluate these calibration errors, however, as they cannot be disentangled from the intrinsic variations of GD 323.
To estimate these residual calibration errors, we have opted to go back to the 13 individual IRAF-reduced spectra of PG 1234+482 acquired on 2004 February 10. Because these spectra were simply reduced with the standard IRAF package, the rms deviations over a single night are deemed to include contributions from the S/N ratio of the individual spectra, from the continuum setting and, more importantly, from any residual calibration error associated with IRAF. While our standard reduction is decoupled from IRAF
(
2.2), it is our feeling that the rms errors generated in this way are more representative of the true uncertainties associated with our procedure. Their values are: 0.27À
for H/3, and 0.16À
for H7 and H6.These IRAF-based error bars are included in Figure 2.4. For the neutral helium lines À4471 and À4713, both absent in the spectrum of PG 1234+482, we also measure the rms errors for HE (0.20
À),
the Balmer une that is closest in average equivalent width to the two weaker He I unes.2.4.3 Single-Night Variations
in Calibrated Spectra
An alternative way of illustrating these variations is to divide the template spectrum of GD 323 (shown in Fig. 3) by each observed spectrum. Were GD 323 a constant star, this procedure should yield a straight hue with random noise. The results for 3 spectra obtained on 2004 February 10 are displayed in Figure 2.5 at carefully selected phases. The bottom spectrum corresponds to a phase where the hydrogen une equivalent widths go through a minimum in Figure 2.4, while the top one corresponds to a maximum, and the middle spectrum is for an intermediate value; the trend is in the opposite direction for the helium unes. Also shown are the wavelength intervals used to measure the equivalent widths. Our resuits indicate that the flux variations neyer exceed 5 % throughout the spectrum. A close examination reveals, however, that in the case of the 1043 spectrum, there is less flux in the hydrogen features and more flux in the He i features, while the opposite is true for the 1226 spectrum, even when
taking into account the noise level. By integrating these small variations over the entire une profiles, we reduce the effect of the noise, and increase the significance of these variations. Indeed, even a 1% flux variation over a 100
À
wide H3 une profile yields a 1À
equivalent width variation, which is roughly the size of the variations observed in Figure 2.4.2.4.4
Single-Night Variations in IRAF-calibrated and Uncalibrated Spectra
To reinforce these conclusions, we have carried out in parallel an analysis of the spectrosco pic observations of GD 323 and PG 1234+482, but this time on data that were flux calibrated with IRAF. An additional analysis was also carried out directly with the unfiuxed spectra. In both cases, the quasi-periodic variations in the hydrogen and helium features uncovered in
§
3.1 could also be detected, although the quality of the results was significantly reduced. The fact that we were able to achieve similar resuits via several methods makes it unlikely that the variations uncovered in this paper are due to some artifice in the data acquisition or reduction procedures.2.4.5 Variations over longer timescales
The equivalent width measurements for all five successive nights — a total of 27 observa
tions are shown in Figure 2.6 for the aforementioned features. The variations observed on the first night persist on the following nights, although only a segment of the quasi-sinusoidal variations is observed. Remarkably, on a given night, all hydrogen unes follow a similar pat tern of variations, while the helium lines also share a common pattern, different from that of the hydrogen lines. Our attempts to fit a single periodic function through all the data points have failed, indicating that the variations are only quasi-periodic.
2.5
Discussion
The spectroscopic variations uncovered in GD 323 occur on timescales of the order of 3.5 h. Were these variations associated with the rotation of the underlying white dwarf (R =
1.4 x 10²R®), they would correspond to an equatorial velocity y 5kms1. This number
rotators (Heber et al. 1997b; Koester et al. 1998; Dufour et al. 2002; Karl et al. 2005). This suggests that the association of the 3.5 h timescale with stellar rotation is reasonable.
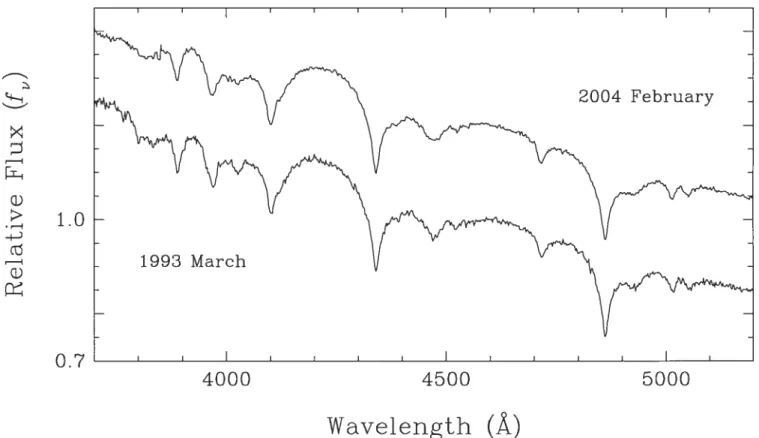
R is also possible to revisit the issue of secular spectroscopic variations on timescales of years in the spectrum of GD 323. The first digital optical spectra of GD 323 were obtained over 20 years ago, but the different instrumental setups and resolutions used aiways hampered a direct comparison with spectra secured more recently (Liebert et al. 1984; Koester et al. 1994). However, the setup for the observations of Koester et al. (1994) and ours is quite similar and this provides a better basis for the comparison of high S/N ratio spectra secured 11 years apart. A comparison of the average spectrum of Koester et al. (1994) for the night of 1993 Mardi 31 (average of 6 spectra) with our so-called template spectrum (average of 27 spectra) is shown in Figure 2.7. Although the reduction procedures differ, the daim can certainly be made that there are no large-amplitude secular variations in the spectrum of GD 323 over that baseline. However, small variations, most notably in He i M026 and He I M471, may be
present.
The detection of spectroscopic variations on a 3.5 h timescale in GD 323 forces us to revise our ideas about this unusual object. As discussed in the Introduction, the thorough analysis of Koester et al. (1994) suggested that none of the options they considered provided a completely satisfactory fit to the data, but the stratified model provided the most acceptable match to GD 323. It seems difficuit to understand now how the spectroscopic variations uncovered here could be accommodated by a static, layered model or, for that matter, by a static homogeneous hydrogen-rich atmosphere containing traces of helium.
Our findings suggest instead that an inhomogeneous surface abundance distribution in a slowly rotating star should be favored. Models with inhomogeneous surface abundances were discussed by Beauchamp et al. (1993), who considered several beit and cap geometries, and
by Koester et al. (1994), who considered a spot model. Can such models reproduce the basic characteristics of GD 323? Let us consider the conclusions of Koester et al. (1994) first: they model the spot geometry by adding appropriately weighted fluxes from model atmospheres of DA and DB stars and restrict, on physical grounds, the difference in effective temperatures of these models to less than 5000 K. The conclusion they derive from the analysis of spotted
models is a familiar one (see, e.g., Liebert et al. 1984); namely that it is difficuit to find a single model (characterized here by the effective temperature of the hydrogen-rich and helium-rich spots and by the relative surface they cover) that matches both the hydrogen and helium line strength and the siope of the energy distribution of GD 323.
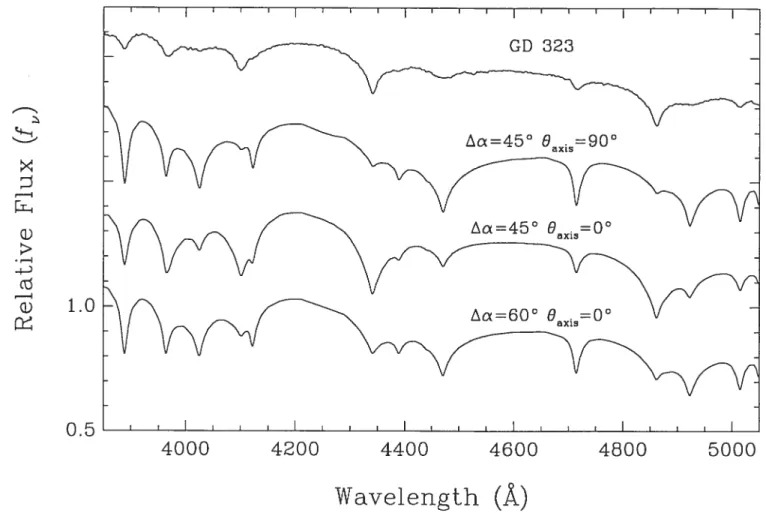
In an earlier analysis, Beauchamp et al. (1993) had used more sophisticated models that considered specific geometries (equatorial belts and polar caps) and included a self-consistent treatment of the limb darkening effects. $ample optical spectra of models with a pure helium equatorial baud and pure hydrogen polar caps from that investigation are reproduced here in Figure 2.8 and contrasted with our average spectrum of GD 323. These results illustrate how the strength of the hydrogen and helium unes, and in particular their relative strength, depends on both the extent of the helium-rich beR and on the inclination of the stellar symmetry axis with respect to the une of sight (given here by the angle For a given half-width of the pure helium equatorial band of a =
45°, the hydrogen unes are stronger and the helium unes weaker when the star is seen pole-on (&j 00) instead of equator-on (Oaxjs =
90°). Similarly, for a given inclination axis of = 0° (pole-on), the helium lines become
stronger and the hydrogen unes weaker when the half-width of the pure helium equatorial baud is increased from a = 450
to 60°. In the present context, variations of the hydrogen and helium hue strengths in opposite phase could be reproduced if the rotation axis and the symmetry axis are misahigned. While no optimal fit is provided here or in the investigation of Beauchamp et al. (1993), the results of Beauchamp et al. appear more encouraging than those of Koester et al. (1994). In particular, they encountered no major difficulty in matching the energy distribution with a model that gave an acceptable, although admittedly far from perfect, fit to the average optical spectrum of GD 323.
The modeling of surface inhomogeneities in terms of spots, or caps and belts, can perhaps lead one to believe that the origin of these surface features must be directly related to the presence of a magnetic field at the stellar surface. In that picture, GD 323 would be a low-field analog of Feige 7, a DAB white dwarf with a 35 MG dipolar field (Achilleos et al. 1992). In GD 323, the nuli circular polarization measurement of Angel et al. (1981) yields a 3u upper limit of 3 MG on the longitudinal field component at the stellar surface. However, the idea that
surface inhomogeneities are related to other processes, such as the convective dilution of a
thin overlying hydrogen envelope, should also be entertained. Indeed, it has been pointed out a while back (Liebert et al. 1987) that CD 323 is slightly cooler than the red edge of the DB
gap, that peculiar region between 45,000 K and 30,000 K that appears to be devoid of helium atmosphere degenerates. Models of the spectral evolution of white dwarfs (e.g., Fontaine & Wesemael 1987) attempt to account for this gap by calling on the dilution of a thin hydrogen layer at the surface of a 30,000 K DA star with the more massive helium envelope, dilution that would lead to a DA—*DB transition near that effective temperature. If GD 323 were understood in those terms, an idea that we favor, its surface might be characterized by the presence of horizontal abundance gradients. Unfortunately, it is not possible to be more specific since a complete picture of the mixing process stili eludes us at this stage. The geometries considered in the exploratory investigations of Beauchamp et al. (1993) and Koester et al. (1994) appear reasonable starting points for a renewed and more thorough study of that possibility.
We thank the director and staff of the Steward Observatory for the use of their facilities, and A. Beauchamp for his essential contribution to the calculation of models with surface inhomogeneities. This work was supported in part by the NSERC Canada and by the Fund FQRNT (Québec).
2.6
References
Achilleos, N., Wickramasinghe, D. T., Liebert, J., Saffer, R. A., & Grauer, A. D. 1992, ApJ,
396, 273
Angel, J. R. P., Borra, E. F., & Landstreet, J. D. 1981, ApJS, 45, 457
Beauchamp, A., Wesemael, F., Fontaine, G., & Bergeron, P. 1993, in White Dwarfs: Advances in Observation and Theory, ed. M. A. Barstow, NATO ASI Series, vol. 403, 281
Bergeron, P., & Liebert, J. 2002, ApJ, 566, 1091
Burleigh, M., Bannister, N., & Barstow, M. 2001, in ASP Conf. Ser. 226, l2th European Workshop on White Dwarf Stars, ed. J. L. Provencal, H. L. Shipman, J. MacDonald, & S. Goodchild (San Francisco: ASP), 135
Dufour, P., Wesemael, F., & Bergeron, P. 2002, ApJ, 575, 1025
Fontaine, G., & Wesemael, F. 1987, in I.A.U. Colloquium 95, The Second Conference on Faint Blue Stars, ed. A.G.D. Philip, D.S. Hayes, & J. Liebert (Schenectady: L. Davis Press), 319
Heber, U., Napiwotzki, R., Lemke, M., & Edelmann, H. 1997a, A&A, 324, L53 Heber, U., Napiwotzki, R., & Reid, I. N. 1997b, A&A, 323, 819
Holberg, J. B., Kidder, K. M., & Wesemael, F. 1990, ApJ, 365, L77
Jordan, S., Heber, U., Engels, D., & Koester, D. 1993, A&A, 273, L27
Karl, C., Napiwotzki, R., Heber, U., Dreizier, S., Koester, D., & Reid, I. N. 2004, A&A, in press
Kidder, K. M., Holberg. J. B., Barstow, M. A., Tweedy. R. W., & Wesemael, F. 1992, ApJ, 394, 288
Koester, D. 1991a, in Evolution of Stars: The Photospheric Abundance Connection, ed. G. Michaud & A. Tutukov, (Dordrecht: Kiuwer), 435
Koester, D. 1991b, in White Dwarfs, ed. G. Vauclair & E.M. Sion, NATO ASI Series, Series C, no. 336 (Dordrecht: Kiuwer), 343
Koester, D., Liebert, J., & Saffer, R. A. 1994, ApJ, 422, 783
Liebert, J., Bergeron, P., & Holberg, J. 3. 2005, ApJ$, 156, 47 (LBH)
Liebert, J., Fontaine, G., & Wesemael, F. 1987, Mem. Soc. Astr. Italiana, 58, 17 Liebert, J., Wesemael, F., Sion, E. M., & Wegner, G. 1984, ApJ, 277, 692
Ivlaxted, P. F. L., Burleigli, M. R., Marsh, T. R., & Bannister, N. P. 2002, MNRAS, 334, 833 McCook, G. P., & Sion, E. M. 1999, ApJ$, 121, 1
Napiwotzki, R. and the SPY Consortium 2005, in ASP Conf. Ser., l4th European Workshop on White Dwarfs, ed. D. Koester & S. Moehier, in press
Oke, J. B., Weidemann, V., & Koester, D. 1984, ApJ, 281, 276 Robinson, E. L., & Winget, D. E. 1983, PASP, 95, 386
Vennes, S., Dupuis, J., & Chayer, P. 2004, ApJ, 611, 1091 Wesemael, F., Bergeron, P., & Briand, E. 1995, JRASC, 89, 183
Wesemael, F., Bergeron, P., Lamontagne, R., Fontaine, G., Beauchamp, A., Demers, S., Irwin, M. J., Holberg, J. B., Kepler, S. O., & Vennes, S. 1994, ApJ, 429, 369
Wesemael, F., Greenstein, J. L., Liebert, J., Lamontagne, R., Fontaine, G., Bergeron, P., & Glaspey, J. W. 1993, PASP, 105, 761
Q)
Q)
1.0
0.6
Waveïength
(&)
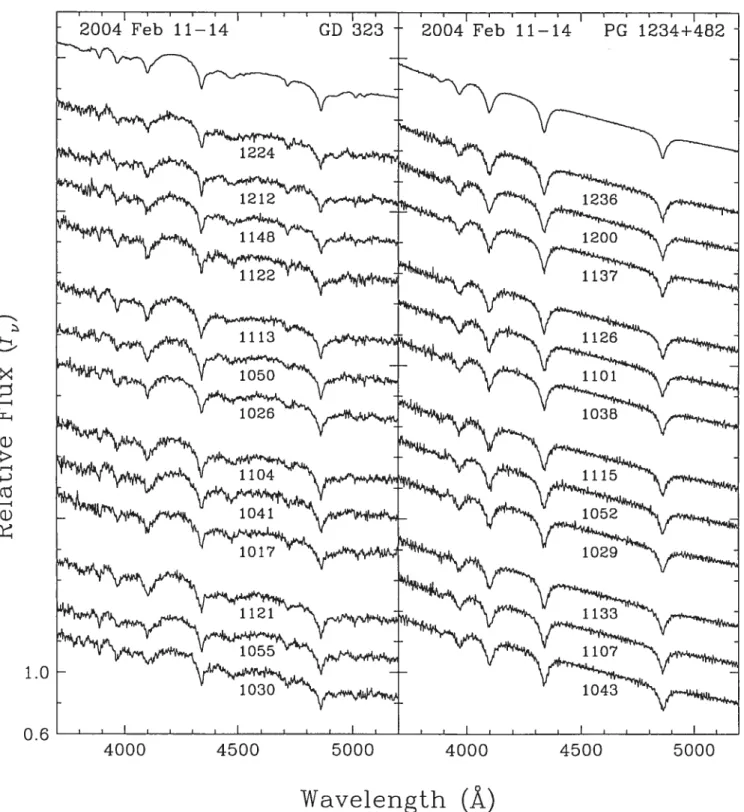
FIGURE 2.1 — Optical spectra of GD 323 (teft panet) and PG 1234+482 (right panel) taken
on 2004 February 10. The spectra appear in chronological order from the bottom up and are labeled with the corresponding universal time at which the integration was started. The spectra have been flux calibrated, normalized to unity at 4600
À
and offset from each other by a factor of 0.25 for clarity.Q)
G)
1.0
Wavelength
(&)
FIGuRE 2.2 — Optical spectra of CD 323 (teft panel) and PC 1234+482 (right panet) taken
on 2004 February 11-14. The spectra appear in chronological order from the bottom up and are labeled with the corresponding universal tirne at which the integration was started. The spectra have beenflux calibrated, normalized to unity at 4600
À
and offset from each other by a factor of 0.25 within the same night and by 0.3 between consecutive nights. The combined spectrum of CD 323 from ail nights is also dispiayed at the top of the left panel; for comparison, the combined spectrum of PG 1234+482 is displayed at the top of the right panel.0.6
cl)
Q)
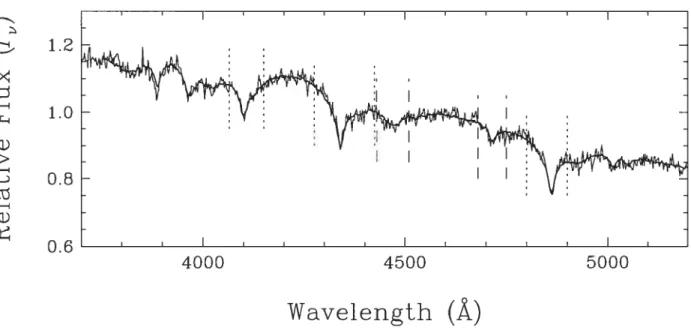
FIGuRE 2.3 —Template spectrum (average of 27 spectra) superimposed on a typical spectrum
of GD 323. Here, the template continuum lias been adjusted to that of the observed spectrum using the procedure described in the text. This is done for each individual spectrum. The wavelength range used to measure the equivalent widths is shown for the hydrogen (dotted unes) and the He i (dashed unes) absorption unes.
1.2 1.0 0.8 0.6 4000 4500 5000
(Â)
Wavel.ength
60_Hfl I I I I 5.0- 4.0-I 3.0- I I -8.OHH7
-6.0H
-5.0 -,..::::: 40—’ I 1:163.5H
3.OH
I
T II
I I -I I I 30HeÀ4471 -2.0-
1.0-0.0IHXI4713 I I08:00
10:00
12:00
Time (UT)
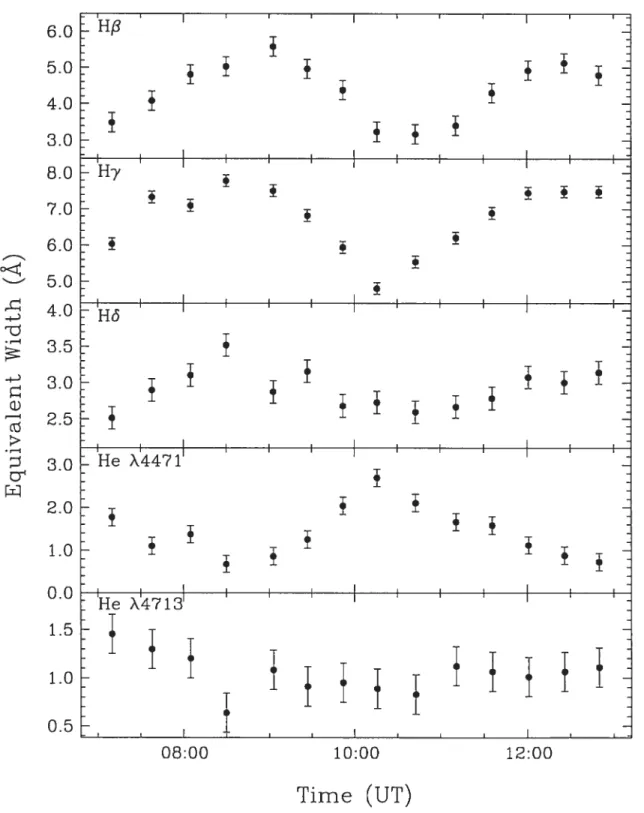
FIGuRE 2.4 —
Equivalent widths as a function of time
(hours UT) for the spectra of GD 323taken on 2004 February 10. The panels correspond to H3, H7, H,
He
I ).4471 and He I M713from top to bottom. The error bars are estimated from the equivalent width measurements of PC 1234+482, which showed no significant variations and had a similar signal-to-noise ratio. These values are then used as error bars for GD 323.
I II I I III I —
I
I
I
—Hô
Hy
IHeII
Fleli
I
I.
1226
:1
I
I
I:
1009
I 4000 4500 5000WaveÏength
(Â)
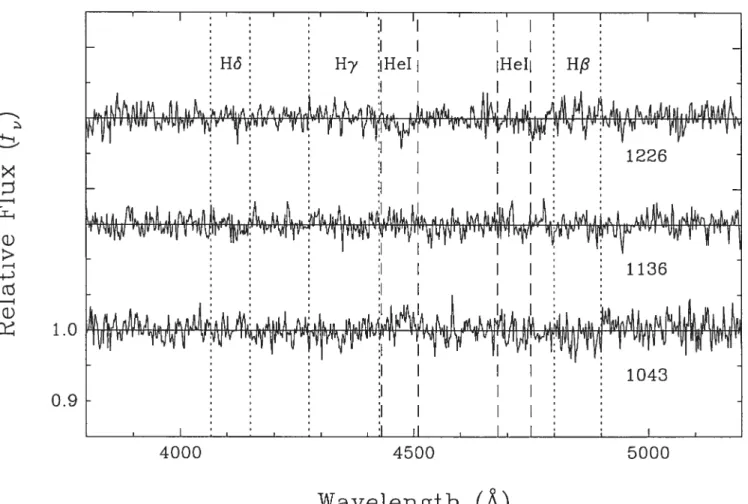
FIGuRE 2.5 — Resuits obtained by dividing the fitted template spectrum of CD 323 (see, e.g.,
Fig. 2.3) by the observed spectra. The spectra are ail taken on 2004 February 10, and they are labeled with the universal time of their acquisition. The spectra selected correspond to various phases where the hydrogen une strengths go from a minimum to a maximum, from bottom to top. The wavelength range used for the equivalent width measurements are indicated for the five strong features:H3-H5 (dotted tines), He I À4471 and He I À4713 (dashed unes).
8 — r r I I I I — 6- . •• • •‘. I . • 4 - • . . .• • — • ... • le 2-r r r r r 1. — I I I I r I — 117 8 - •. ,•• • .• — . . . • . • . _—.. 6 - • • 1 1 — • e o.r1 • S..— 4 I r I I I t r t
5
- I I I I I I I I I I I116
4- • • . . .3
- 1. • I • • — • e • .•••• I 2-1 c t I p r r I r r r I I j I I I j r 4 - Fie À4471 . 2 — • •I. . •I•. — • • .1 I • • I I • ••e II o-I r I r r r r r I I r r r I r I I j2
- Fie À4713 I •e I I I I. I 1 — • •I.•• . •l • ••I. I I — .0
- r I - I Y) Y) (L CC (L 0 2 4 6 8 28 30 32 52 54 56 76 78 80 100 102zt (hours)
FIGuRE 2.6 —Equivalent widths as a function of relative time (in hours) for the spectra of CD
323 taken over five nights, namely from 2004 February 10-14. The first observation is offset from t = O by one hour. The panels correspond to H3, H-y, H6, He I M471 and He I À4713
from top to bottom. The error bars are the same as those shown in Figure 2.5 but are omitted for clarity.
X
o)
.1.0
n
-o)
0.7
FIGuRE 2.7 — Comparison of our template spectrum of GD 323 (average of 27 spectra) with
that generated from the data of Koester et al. (1994) for the night of 1993 Mardi 31 (average of 6 spectra). The spectra are normalized to unity at 4600
À
and offset from each other by a factor of 0.2. The instrumental setup was similar between the two sets of observations, but the reduction procedure was diffèrent (sec text).4000
4500
5000
Q) -j (j -
1.0
0.5
Wavelength
(Â)
FIGuRE 2.8 — Saniple optical spectra of models with a pure helium equatorial band and pure
hydrogen polar caps; the top spectrum is that of GD 323 (average of 27 observations) The spectra are normalized to unity at 4250
À
and offset from each other by a factor of 0.35. The half-width of the pure helium equatorial hand is given by while &j represents the anglebetween the stellar symmetry axis and the une of sight.
Article
A CON$I$TENCY CHECK BETWEEN THE BALMER
UNES AND THE FAR-ULTRAVIOLET $PECTRUM IN
$UBDWARF B STARS
C. Pereira, F. Wesemael, arid P. Bergeroil
Département de Physique, Université de Montréal, C.P. 612$, Succ. Centre-Ville, Montréal, Québec, Canada, H3C 3J7.
3.1
Abstract
We investigate the consistency between atmospheric parameters of subdwarf B stars deri ved from optical spectra and the far-ultraviolet continuum flux. Optical spectra were secured for a sample of nine sdB stars whose far-ultraviolet spectra were obtained from the Far
Uttraviotet Spectroscopie EzptoTeT (FUSE,) satellite archives. We compute pure hydrogen and mixed hydrogen-helium NLTE model atmosphere grids along with synthetic spectra. Applying the Balmer lime fitting technique, we derive values for Teff and logg for our sample objects, and these are then used to predict the far ultraviolet continuum flux. To do this, we norma lize the predicted ultraviolet fluxes to the observed Strômgren y magnitude. Overall, we find satisfactory agreement for objects with Teff < 31, 000 K, in the sense that the une profiles and continuum are well reproduced, when some allowance is made for the presence of line blocking from heavy elements or for the presence of small amounts of interstellar reddening, or both. For sdB stars with Teg > 31, 000 K, we find a systematic discrepancy in the sense that the
predicted lime profiles are too wide, while the continuum levels are too low. We examine the effects of including line blanketing by heavy elements in solar abundances in our model cal culations. Our preliminary results show that the blanketing effect in the ultraviolet is large, and could explain the inconsistent results obtained above Teff = 31, 000 K.
3.2
Introduction
The fleld subdwarf B stars are the analog of the evolved, subluminous stars found on the extended horizontal branch (EHB) in globular clusters. They are low mass objects (‘- 0.55 M®)
with helium burning cores and very thin hydrogen envelopes (<0.02 M®) that are practically inert. Their evolution is not fully understood yet, although several formation channels have been proposed. Current scenarios include binary white dwarf mergers (Iben & Tutukov 1986), and the substautial mass loss of red giants either through stellar winds (D’Cruz et al. 1996) or through helium mixing ($weigart 1997). In these three cases the result is a single sdB star. However, because more than two thirds of subdwarfs are in binary systems (Maxted et al. 2001), alternative formation scenarios are needed for this channel; these have been discussed
by Han et al. (2002, 2003). Moreover, B subdwarfs are thought to evolve into white dwarf stars, although only a small percentage of white dwarfs are formed this way (Saffer et al. 1994).
Spectroscopically, the B subdwarfs show spectra dominated by broad Balmer unes and weak He i unes and have effèctive temperatures between 20,000 K and 35,000 K. Helium
has long been known to be deficient (sec, for example, Edelmann et al. 2003), while the photospheric abundances of heavy elements display complicated patterns. Depending on the element, the abundance can be either under- or overabundant with respect to the solar value. Several physical processes such as gravitational settiing, radiative levitation, and stellar winds are thought to play a role in determining the resulting abundance, but the details are not yet understood (sec, for example, Bergeron et al. 1988; Michaud et al. 1988; Fontaine & Chayer 1997; Unglaub & Bues 2001)
In order to determine the relative importance of the processes at play in the photospheres of sdB stars, the basic atmospheric parameters of any given star must first be determined. Initially, optical photometry and ultraviolet energy distributions were used to determine the effective temperature, while the profiles of a handful of Balmer unes were used to derive the surface gravity (sec e.g., Heber et al. 1984, 1986; Moehier et al. 1990; Wesemael et al. 1997). More recently, under the impetus of Saffer et al. (1994), the Balmer une fitting technique used in white dwarf work was adapted to the sdB stars. Here, the observed Balmer unes extending well into the blue are simultaneously fit using synthetic spectra generated from model atmospheres as well as a chi-squared minimization technique. This technique provides reliable estimates of the effective temperature, surface gravity and photospheric abundance (sec, e.g. Saffer et al. 1994). With the advent of instruments such as FUSE, whose spectral coverage includes the Lyman une series from Ly onwards, one could in principle apply the fitting technique to this wavelength region. By doing so, one could check the consistency between the two sets of derived parameters.
This consistency has already been explored for DA white dwarfs by Barstow et al. (2001, 2003) and for DAO white dwarfs by Good et al. (2004). Their endeavour was motivated by the difficulty encountered in determining white dwarf parameters of binary systems. In
such cases, if the companion is more luminous, it is this star’s spectrum that dominates in the optical region. However, in the ultraviolet region, it is the flux from the degenerate star that dominates, thereby providing access to atmospheric parameter determination. Barstow et al. (2001, 2003) found that, for DA white dwarfs, there was a good agreement between the two methods for temperatures up to 50, 000 K. At higher temperatures discrepancies were found, whereby Lyman une values were systematically higher. There, unresolved calibration issues, neglected trace abundances of selected heavy elements, and uncertainties in the physics included in the atmosphere models are ail possible contributors to the observed discrepancy (Barstow et al. 2003; Vennes et al. 2005).
Motivated by these studies, we report here preliminary results of a similar analysis carried ont for subdwarf B stars. For this purpose, we concentrated on a sample of nine subdwarf B stars for which we secured both optical and far-ultraviolet spectra. In
§
2, we present both optical and far-ultraviolet spectroscopy, while in§
3, we discuss the grids of model atmospheres calculated for this investigation. The importance of NLTE effects and of heavy elements for these models are then discussed in§
4. The fits to the Balmer hues are presented in§
5, and the issue of the Lyman hues is discussed in§
6. Our main conclusions are then summarized in§
7.3.3
Observations
3.3.1 Optical Spectra
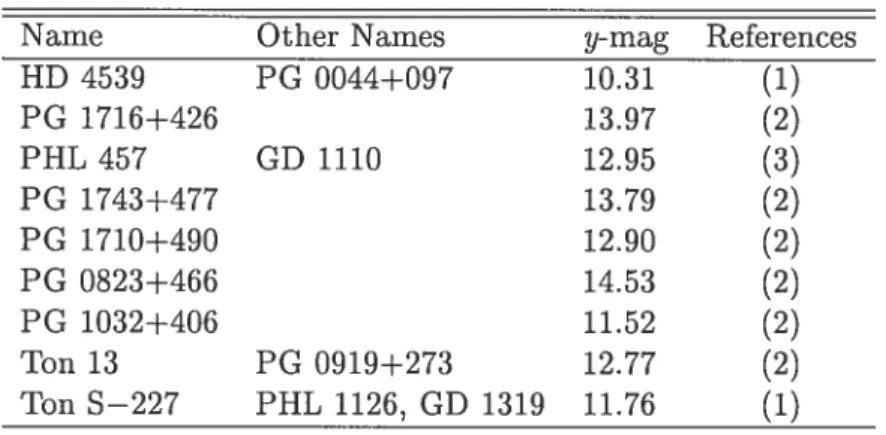
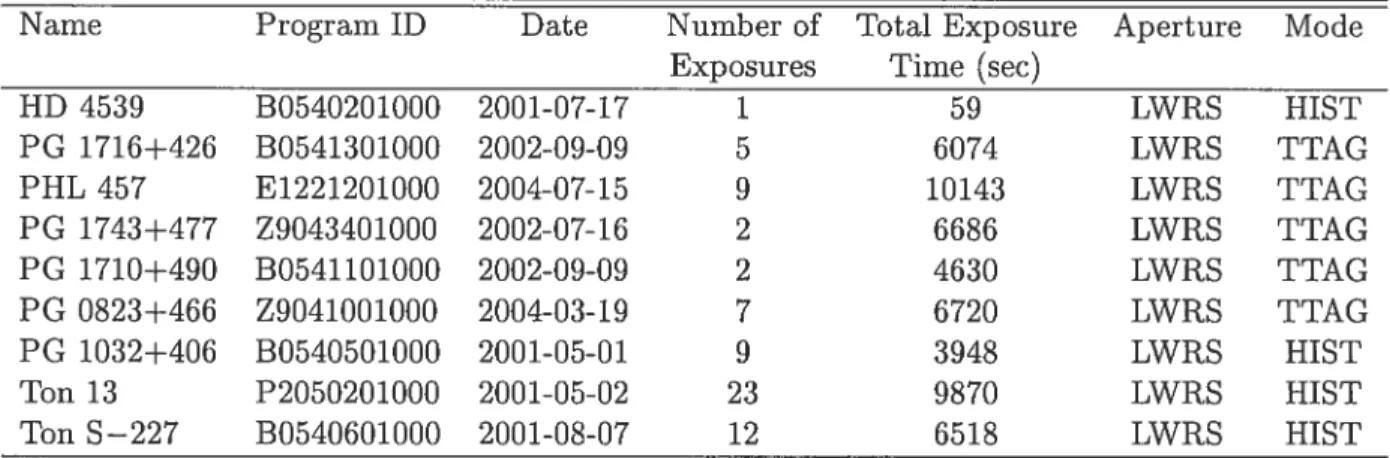
A sample of nine subdwarf B stars vas selected for this analysis. The candidates were chosen in order to provide objects covering a fair range of effective temperatures and surface gravities, as well as varions hehium and heavy element abundances. In practice, the sample includes cool sdB stars such as HD 4539 (Teif 24,000 K, logg ‘- 5.2) as well as hotter objects like Ton S—227 (Teff 34,500 K, logg 6.0). Table 1 lists the objects in our sample in order of increasing temperature along with alternative names. The Strômgren y magnitude is also provided, together with its reference. Optical spectra at high signal-to-noise ratio were secured with the 2.3 m reflector telescope at Steward Observatory in November 2004. The telescope
was equipped with the Bolier & Chivens spectrograph and a Loral CCD detector. A 4.5 arcsec sut and a 600 fine mm1 grating iii first order provided a spectral coverage of 3200-5300
À
at a resolution of 6À
FWHM. The optical spectra were extracted, wavelength and flux calibrated using the Image Reduction and Analysis Facffity (IRAF) standard package. These are shown in Figure 3.1 and appear in order of decreasing temperature from top to bottom. The spectra are normalized to unity at 4600À
and are offset from each other by a factor of 0.6 for clarity. Besides the strong Balmer unes from H3 onwards, the spectra sometime show a weak He I ,\4471.3.3.2
Far-Ultraviolet Spectra
The far-ultraviolet spectra were obtained from the Far Ultraviolet Spectroscopic Explorer (FUSE) satellite archives. Moos (2000) provides an overview of the mission, while $ahnow (2000) describes the on-orbit performance of the satellite. The instrument aboard FUSE, launched in 1999, consists of four co-aligned channels. Each is comprised of a mirror, a focal plane assembly, a diffraction grating and two detectors. Two of the mirrors and gratings are coated with SiC thereby providing sensitivity to wavelengths below 1020
À,
while the other two mirrors and gratings are coated with LiF on Al providing sensitivity above 1050À.
The overall spectral coverage of the instrument ranges thus from 905 to 1187À,
and allows detection of the full Lyman une series with the exception of Lyc. Moreover, each channel uses two detector segments A and B. This resuits in eight spectral segments which are then co-added in the reduction process to obtain the final spectra (see e.g., Barstow et al. 2003). The observations are summarized in Table 2, which provides information on the number of exposures as well as on the total integration time. Ail spectra were taken using the 30”x 30” LWRS aperture, which provides a resolution of 20,000. The spectra were obtained either using the timetag (TTAG) or histogram (HIST) mode depending on the brightness of the object. In the present study, four program stars were observed using the HIST mode, while the remaining six were obtained using the TTAG mode. The data are then reduced using the most recent CALFUSE pipeline version available. The spectra were binned over 0.1À,
as was done by Barstow et al. (2001), to augment the signal-to-noise ratio without loss of spectral definition. Moreover, someFUSE spectra show strong emission unes due to the Earth’s geocorona. These generally occur in the une cores and are ignored. Another artifact that must be deait with is the absorption of interstellar H I. This may engender an artificial deepening of the une cores. It is possible
for these effects to cancel each other, however, it is more appropriate to remove these regions from the data (Barstow et al. 2001). The spectra are shown in Figure 3.2 and appear in the same order as Figure 1. For two objects, PG 1710+490 and PG 1716+426, the data between 1120
À
and 1160À
were problematic and were not considered in the reduction process. The omission of this spectral region does not affect our analysis as we can stili detect the full Lyman series from Ly/3 onwards. The ultraviolet spectra also feature numerous narrow unes of heavy elements, the influence of which will need to be considered. Overali, the shape of the absorption features is much rounder and broader for stars with Teif < 30, 000 K, while thehotter stars have features that are sharper and narrower.
3.4
Model Calculations
The optical spectra of our sample objects show no strong features besides transitions of H
i, He i, and He ii. Accordingly, we calculated a grid of pure hydrogen models, as well as a grid
of mixed helium and hydrogen models using an average helium abundance of log(He/H) —2.5. This value corresponds to the mean helium abundance found in the literature. We use this second grid to verify the impact of a small helium abundance on the determination of our atmospheric parameters. The Napiwotzki (1997) analysis shows that the divergences between hydrogen and mixed compositions decrease as one goes from LTE to NLTE alld as one goes to lower effective temperatures. Since we use NLTE models and restrict ourselves to relatively low temperatures, we do not expect large differences between our two grids of models in the results presented in
§
5. Line blanketed LTE and NLTE models were calculated using version 200 of TLUSTY (Hubeny 1988), under the assumption of a plane parallel geometry and of hydrostatic and radiative equilibrium. The corresponding synthetic spectra were calculated with version 48 of SYN$PEC (Hubeny Lanz 1995) and the Stark broadening tables of Lemke (1997) were used. We emphasize that no blanketing due to heavy elements is included in our initial model grids. The importance of this omission will be discussed in the following section.Our model grids extend over the foliowing range of parameters in each case: Teff 20, 000 K to 60,000 K spaced by 2000 K, iogg 5.0 to 6.0 spaced by 0.25 dcx. The calculations used 300 depth points for the pure H and 100 depth points for the mixed H-He models. Ail opticai synthetic spectra were convolved with a Gaussian of full width at haif maximum of 6
À,
whiie non-convolved spectra were used for the Lyman line analysis.3.5
NLTE vs LTE and the Importance ofLine Blanketing from
Heavy Elements
Napiwotzki (1997) reports that for model atmosphere calculations of sd3 stars, one must consider two important factors: NLTE effects and hue blanketing from heavy elements. Past studies of the atmospheric properties of subdwarf B stars have frequently employed LTE models, but the results of Napiwotzki (1997) suggest an increase in NLTE effects for objects with Teff > 30,000 K. To verify the impact of NLTE effects, we used our pure hydrogen NLTE grid to derive the corrections in the values of Teff and log g that need to be applied to the results of LTE analyses. These correction vectors are shown in Figure 3.3. For temperatures above 30,000 K, differences can be as large as 20,000 K and 0.5 dcx, in the sense that the LTE generally underestimates these parameters.
Another important consideration is that of line blanketing (sec e.g., Lanz et al. 1997; Brown et al. 1996). Findiugs report that simple mixed hydrogen/helium model calculations tend to overestimate effective temperatures, since line blanketing increases the opacity in the atmosphere and results in the coohng of the stellar surface and heating of the deeper iayers through backwarming. Hence, neglecting the opacity of heavy elements such as iron, leads to NLTE models predicting too large a continuum flux, particularly in the FUV region, since it is there that most features from heavy elements are visible (Lanz & Hubeny 2003). Unfortunately, the heavy element abundances observed in sdB stars vary from object to object and do not necessarily follow solar or scaled solar abundance patterns. Thus, at this stage, we opted to include bianketing of hydrogen and helium, and heavy elements were not considered in our initial investigation.
3.6
Fits to the Balmer Lines
To determine the atmospheric parameters, Teff and log g, of our sample stars, we used the Balmer lune fitting technique. The procedure can be summarized as follows: the observed and theoretical Balmer une profiles (H/3-H9) are normalized to a linear continuum set to unity. The observations are then compared to synthetic spectra generated from model atmospheres. A chi-squared minimization technique is then applied until a best fit is achieved between the calculated model and the observations (sec Holberg et al. 1985; Bergeron et al. 1992). We flrst proceeded using the pure hydrogen model grid, and obtained satisfactory fits. These are shown in Figure 3.4. The fits are presented in order of increasing temperature from left to right. We sec that the line profiles are well reproduced. Furthermore, the values of Teff and loggwe determine are consistent with those found in the literature. We present, in Table 3, the derived effective temperatures, surface gravities, distances (in parsec), as well as abundances of helium and some heavier elements found in the literature. The distances were derived using the relation
= 4iH1,, (3.1)
with a fixed mass M = 0.55 M® for all of our objects. Reddening was not included in the
calculation of the distances, as its influence is negligible in the visible domain. On the other hand, it becomes important in the FUV region, and these effects will be discussed in section 6.1.
3.6.1 The
Impact of the Helium Abundance
As previously mentioned, we computed a mixed helium and hydrogen NLTE grid with log(He/H) = —2.5 and refit all our optical spectra with that grid. The derived atmospheric
parameters were quite similar to those obtained with the pure hydrogen grid and, in addition, the Me i une profiles were well reproduced at the abundance chosen. The values of Teff and
log g obtained with the mixed grid are contrasted to the earlier values in Table 4. The values obtained with the mixed grid are generally hotter than their counterparts, except for HD 4539
and Ton S—227, and differ from them by 250 K at most. As for the gravities, they are generally larger for the fitswithmixed models, by up to 0.013 dcx. This reinforces the Napiwotzki (1997) daim that, if one uses NLTE models, the influence of helium is not dramatic. In what follows, we adopted the parameters obtained with the pure hydrogen grid.
3.7
The Lyman Lines
Although the analysis of the Lyman unes is patterned ou work carried out on DA white dwarfs, there are substantial differences to 5e reckoned with: whule DA white dwarfs show few unes in the FUSE spectral region, the ultraviolet spectra of subdwarf 3 stars are conta minated by hundreds of transitions from heavy elements (sec, e.g, Oh et al. 2000). These unes contribute to the overall blocking effect and must be considered when trying to fit the continuum, a crucial step in the fitting procedure. The problem could be alleviated were one to use synthetic spectra that include the line blanketing of heavy elements, but this task is complicated since the abundance patterns of heavy elements in sdB stars are inhomogeneous, and are stili being documented (Fontaine et al. 2005). We show in Figure 3.5 the results ofthis experiment for two typical objects in our sample. Firstly, we note that the continuum is placed by taking an average of the “noise”, that is in reality the numerous lines of heavy elements. Moreover, elements such as iron contribute to the overall hue blocking effect and depress the flux in the FUV region (Brown et al. 1996). Thus, one cannot accurately determine the level of the continuum, and consequently the derived parameters tend to be inconsistent with the optical values.
Faced with this situation, we adopted a different approach in which we look for consistency between the optical parameters and the fluxes observed in the FUSE range. To do this, we use the Teff and log g derived from the optical spectra to interpolate the synthetic spectra in the FUSE range. These spectra are normalized through the observed $triimgren y magnitude. The Strômgren y index is used to calculate the observed flux at 5458.7