HAL Id: hal-00690067
https://hal.archives-ouvertes.fr/hal-00690067
Submitted on 21 Apr 2012HAL is a multi-disciplinary open access archive for the deposit and dissemination of sci-entific research documents, whether they are pub-lished or not. The documents may come from teaching and research institutions in France or abroad, or from public or private research centers.
L’archive ouverte pluridisciplinaire HAL, est destinée au dépôt et à la diffusion de documents scientifiques de niveau recherche, publiés ou non, émanant des établissements d’enseignement et de recherche français ou étrangers, des laboratoires publics ou privés.
Coupled visco-mechanical and diffusion void growth
modelling during composite curing
Y. Ledru, Gérard Bernhart, Robert Piquet, Fabrice Schmidt, Laurent Michel
To cite this version:
Y. Ledru, Gérard Bernhart, Robert Piquet, Fabrice Schmidt, Laurent Michel. Coupled visco-mechanical and diffusion void growth modelling during composite curing. Composites Science and Technology, Elsevier, 2010, 70 (15), pp.2139-2145. �10.1016/j.compscitech.2010.08.013�. �hal-00690067�
Accepted Manuscript
Coupled visco-mechanical and diffusion void growth modelling during com‐ posite curing
Y. Ledru, G. Bernhart, R. Piquet, F. Schmidt, L. Michel
PII: S0266-3538(10)00321-0
DOI: 10.1016/j.compscitech.2010.08.013
Reference: CSTE 4794
To appear in: Composites Science and Technology Received Date: 17 March 2010
Revised Date: 11 August 2010 Accepted Date: 21 August 2010
Please cite this article as: Ledru, Y., Bernhart, G., Piquet, R., Schmidt, F., Michel, L., Coupled visco-mechanical and diffusion void growth modelling during composite curing, Composites Science and Technology (2010), doi: 10.1016/j.compscitech.2010.08.013
This is a PDF file of an unedited manuscript that has been accepted for publication. As a service to our customers we are providing this early version of the manuscript. The manuscript will undergo copyediting, typesetting, and review of the resulting proof before it is published in its final form. Please note that during the production process errors may be discovered which could affect the content, and all legal disclaimers that apply to the journal pertain.
COUPLED VISCO-MECHANICAL AND
DIFFUSION VOID GROWTH MODELLING
DURING COMPOSITE CURING
Y. Ledru 1, 2, G. Bernhart1,2,*, R. Piquet 1, F. Schmidt 1,2, L. Michel 1,
1 : Université de Toulouse ; INSA, UPS, Mines Albi, ISAE ICA (Institut Clément Ader), DMSM
ISAE BP 54032 ; 31055 TOULOUSE CEDEX 4
2 : Ecole des Mines Albi, Campus Jarlard, F 81013, ALBI CEDEX 09 *: Corresponding author: Tel. +33 (0)5 63 49 30 79
Fax. +33 (0)5 63 49 30 99 E-mail address: [email protected]
SUMMARY: Most critical processing step during long fiber reinforced epoxy matrix
composite laminate manufacturing is the polymerization stage. If not optimized, it gives birth to defects in the bulk material, such as voids. These defects are considered as possible sources of damage in the composite parts. The aim of this work is to model the evolution of void growth in thermoset composite laminates after ply collation (autoclave processes) or resin impregnation (RTM, LCM process). A coupled mechanical and diffusion model is presented to better predict the final void size at the end of polymerization. Amongst the parameter investigated, onset of pressure application and diffusive species concentration where found to have a major effect on void size evolution during curing process.
KEYWORDS: A. Laminate; B. Porosity/Voids; C. Modelling; Autoclave processing.
1) Introduction
Nowadays, prepreg thermosetting materials are frequently used to manufacture high performance structural parts in industrial aeronautic field, as they are stronger, lighter and less corrosive when compared to metallic materials. Prepreg tape lay-up, followed by post
lay-up consolidation and autoclave curing, is the conventional process to manufacture the thick carbon/epoxy laminates for heavily loaded structural parts. In the literature, several research works attempt to determine optimized curing cycles with respect to mechanical properties of the post cured materials [1-7]. It is clearly stated that for each prepreg and part geometry, there is a specific curing cycle according to the very complex relationship
between materials and processing. One important factor that has to be taken into account during curing is the void formation and/or evolution. As a matter of fact, the negative impact of voids on laminates has been largely studied, and it has been shown that voids can promote damages, crack initiation and propagation [8]. Indeed, these defects generate important mechanical property decreases like interlaminar shear stress, flexural and tensile strengths, and modulus of elasticity [1-5, 8, 9-11]. Therefore, it is mandatory to minimize the occurrence and growth of these porosities in composite laminates, phenomenon that can be directly linked to manufacturing process.
Several authors have reported the influence of the manufacturing process on void content: for Resin Transfert Molding [12-17] (RTM), Sheet Moulding Compound (SMC) [18-20], or autoclave [21-23] processes.
Whatever the process, heterogeneous nucleation and moving gaseous species diffusion , like water molecules, at curing temperature may favour void creation [24-27]. This happens if the semi-product has absorbed humidity during the storage, cutting or perform lay-up step or after poor resin degassing.
Issues stated above were scientifically investigated by Kardos and al. [26] and A.C. Loos and al. [7] in order to define an automated procedure for curing temperature and pressure profile optimization.
In spite of results gained by these studies, it is always difficult to produce thick void-free laminates manufactured from third generation thermosetting prepregs. At the beginning, when composite materials were introduced, viscosity of first generation resin was lower and excess of polymer was washed out and absorbed by a glass bleeder during the curing step thanks to the vacuum and hydrostatic pressure. As a consequence volatiles previously mixed with resin, solvents or absorbed water, were also driven out with the excess of resin. But today, in order to improve mechanical properties of laminates, thermosetting polymers are mixed with other constituents, like thermoplastics to enhance impact resistance,
increasing resin viscosity and reducing considerably flow and gas motion possibilities inside the structure. Moreover, the very complex geometry of recent aeronautical parts, with integrated stiffeners, large thicknesses and tapered plies, limits gas evacuation possibilities. Thus, in order to decrease the void content, it is important to investigate the link between void behaviour and curing conditions, not only with a diffusion approach, but also from a mechanical point of view.
In a first step, this work addresses the time-temperature resin viscosity modelling in order to be able to introduce a mechanical description of voids behaviour during curing step. In the same time, diffusion model developed by Wood [25] is improved by taking into account the thermodynamical and the chemical aspect of water transfer. Then, mechanical and diffusion models are coupled to obtain a more accurate void size prediction along the temperature and pressure cycle applied during the polymerisation. Results are discussed and compared with experimental data published in literature and with the ones given by Kardos’ models and the ones calculated from Wood model.
2) Curing kinetic and rheology parameter identification of third
generation epoxy resin system
Rheological properties of new resin generation are particularly difficult to control during processing due to their important change in viscosity. Three parameters, resin flow, temperature and time are governing this property. Amongst them resin flow is neglected because of the very slow velocity of polymer flow during cycle duration. Temperature activates the crosslinking and influences the speed of the exothermic phenomenon, and time is introduced in the chemical reaction kinetics. In order to insure a final fiber/matrix weight ratio thermoset resin curing kinetics and chemorheological models must be studied carefully. This is mandatory to certify the final polymer crosslink ratio in order to get optimized mechanical properties.
Numerous models are summarized in literature [28], and methodology applied in the following is based on Ivankovic [29] work.
In the first step, the cure kinetics is based on an autocatalytic modified Kamal and Sourour model [30]:
(
1)
(
)
2 max 2 1 n n k k dt dα = − α α −α with = − T R E k k b ai io i exp (1)where (αmax) the maximum crosslink ratio linearly dependent with temperature T. An
inverse numerical method based on isothermal Dynamical Scanning Calorimetry (DSC)
tests allows the determination of coefficients k1, k2, n1 and n2.
Calculated results confirm that the overall reaction order (n1+n2) is 2 (see table 1).
In the second step, rheology is modeled with a combination of Williams-Landel-Ferry (WLF) [31] equation and Castro and Macosko [32] conversion term, as following:
( )
(
)
a g g go go g T T C T T C T − − + − − = α α α η α η 2 1 exp , (2)Where Tg0 the uncured resin glass-transition temperature, ηg viscosity at gelation generally
assumed to be 1012 Pa.s, αg crosslinking ratio at gelation C1, C2, a, model parameters.
Isothermal and non-isothermal rheological tests were performed to identify these parameters (see table 1).
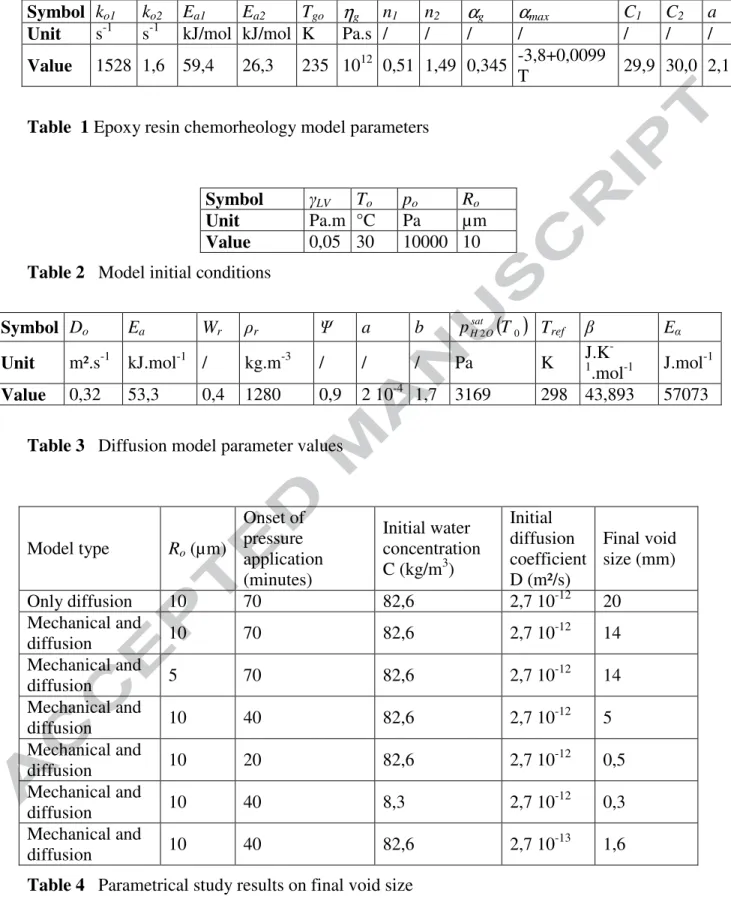
Model validity in non-isothermal conditions was verified with a dedicated rheological test close to the supplier recommended temperature curing cycle (fig. 1). The rheological test is
stopped when resin viscosity exceeds 106 Pa.s, corresponding to the solidification of 3D
macromolecular resin network.
As shown in fig. 1, there is a good agreement between experimental data and model prediction.
3) Visco-mechanical based void growth model
Several parameters are responsible for the mechanical growth of a gas bubble in a thermoset polymer matrix:
• autoclave and void gas pressure difference, respectively pimp and pg,
• gas temperature (T) variation, • cure cycle resin viscosity variation
In order to model the void size variation in laminates during the curing step, some assumptions are introduced to define the visco-mechanical model.
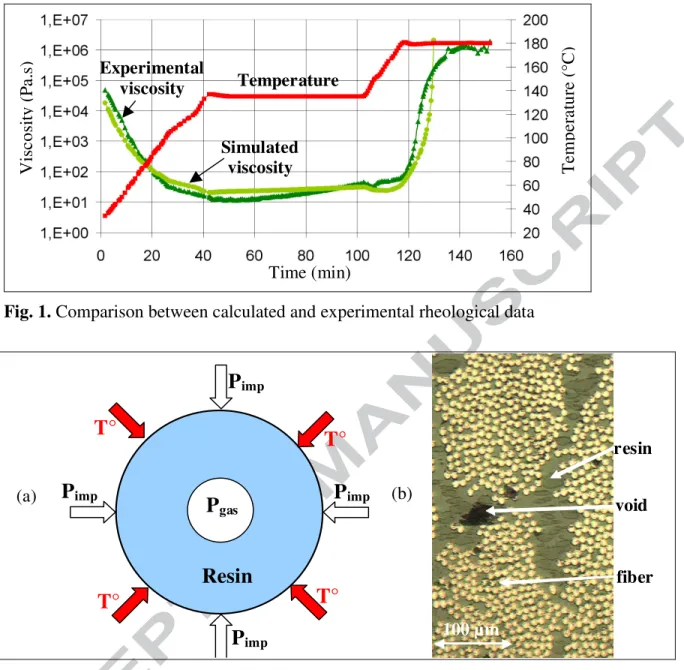
a) First of all, fiber effects are neglected. Gas bubble is assumed to be only in contact with resin (fig. 2(a)). This assumption is partially validated by optical observation on representative samples (fig. 2(b)).
b) Void and the thermoset resin are non-miscible. Therefore diffusion phenomena of gas molecules in the resin are not yet taken into account.
c) Void is a sphere with radius Rp.
d) Gas in the void is assumed to be a perfect gas. d) Thermoset resin is incompressible and Newtonian.
e) Inertia and mass effects are negligible compared to viscous effects and stresses due to gas pressure.
f) For each time step, gas and resin temperature are assumed to be equal to the imposed one.
Because of the similarity between void growth and polymer foaming process, a polymer foaming cellular model (partially developed by Amon [33]) was adapted in order to investigate the void growth in viscous medium.
Expressing void gas pressure according to the perfect gas law and initial conditions (p0, T0),
and taking into account all the previous assumptions, void radius variation (R ) can be p
expressed with following differential equation (for more details see [34]):
(
)
2(
,)
0 1 , 4 3 = + − − p LV imp p o o o p p R T T p R R T T p R R α η γ α η (3)where LV the surface tension. Model initial parameters (To, po and Ro ) are listed in table 2.
Non-linear differential equation (3) was solved using RK4 implicit scheme implemented in
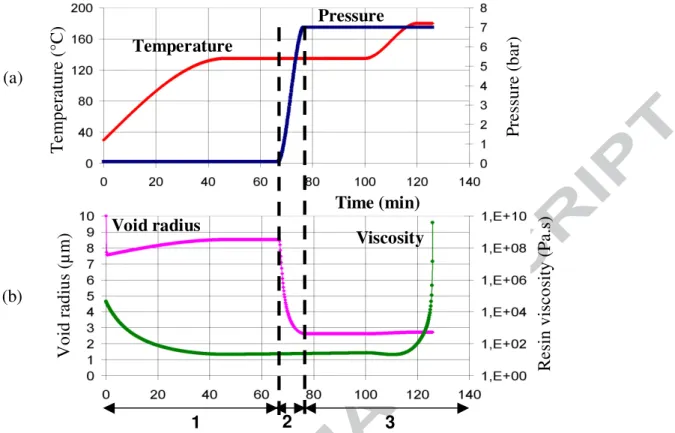
combining the temperature cycle used in paragraph 2 and a pressure cycle that increases from 0,1 to 7 bar as defined in fig. 3(a)
Viscosity variation and void radius evolution are plotted in fig. 3(b). The latter can be divided in three stages:
Stage 1: only the temperature increases, leading to the viscosity decrease. Void growth is due to gas expansion, following the perfect gas law.
Stage 2: during hydrostatic pressure increased, void internal pressure increases in order to keep a mechanical equilibrium. As a consequence, void radius is reduced by 60%.
Stage 3: pressure is constant and viscosity increases exponentially at the end of the dwell
time, due to thermoset resin crosslinking. Calculation is stopped when viscosity reaches 109
Pa.s. During this stage void diameter is nearly constant and stabilised around 3 µm. This final void radius seems to be smaller than the experimental values detected by image analysis [35], as can be seen in fig. 4. As a matter of fact, most voids have an equivalent mean radius higher than 3 µm. However, this visco-mechanical model helps the
understanding of the important role played by hydrostatic pressure aiming to reduce significantly the final void size.
Influence of the diffusion phenomenon that was neglected in previous model will be studied separately in the next section.
4) Gas diffusion controlled void growth model
Basic model formulationInitial model formulation is based on Kardos and al [26] work assuming that a spherical gas
bubble is assumed to contain an air-water vapour mixture. Total pressure in the gas void
(pg) can be calculated using two different approaches : first, in adding air partial pressure
(pair) and water vapour partial pressure (pH20) (equation 4), second with Laplace-Young
relationship (equation 5) taking into account the externally applied hydrostatic pressure
(pimp) and the surface tension forces for equilibrium stability .
O H air g p p p = + 2 (4) p LV imp g R p p − = 2γ (5)
LV surface tension is assumed to be constant throughout the curing cycle with a value of
0,05 Pa.m, classically taken in literature [26].
Chemical phenomenon describing bubble growth or shrinkage corresponds to the diffusion of mobile species (water molecules) across the bubble/resin interface, requiring a transfer of gaseous species from the bubble toward the resin or vice versa. In this work, water molecules are assumed to be the only diffusive species between resin and gas bubble. Changes in pressure and temperature can have pronounced effects on the solubility of the mobile species in the resin, or may affect directly the void expansion following the perfect gas law.
For modelling purposes, the gas bubble radius Rp(t) is surrounded by a large volume of
resin with initial and uniform dissolved gas concentration equal to C . When temperature and pressure vary, diffusion occurs at the resin/bubble interface, modifying the gas
Following Epstein and Plesset’s [36] and Wood [25] approaches, solution of Fick’s second
law for this spherically symmetrical geometry at r = Rp leads to:
+ − = ∂ ∂ ∞ = Dt R R C C r C p p sat R r p π 1 (6)
Where D the diffusion coefficient is assumed to be constant until the end of the curing cycle (this assumption will be discussed latter). In this work, diffusion is assumed to be isotropic. Nevertheless, as the bubble may be trapped between fibers, their proximity may induce anisotropic or orthotropic diffusion. As a consequence, bubble geometry may evolve from a spherical towards a cylindrical shape [37].
Bubble water mass evolution rate is determined by the outward gas flux at bubble surface,
itself obtained from the Fick’s first law expressed at the bubble interface (r = Rp).
p R r 2 p r C DR 4 dt dm = ∂ ∂ = π (7)
This mass evolution can also be calculated according to the perfect gas law as follows:
= gas g 3 p b p M T R dt d R 3 4 dt dm π (8)
Where Mgas, the bubble gas molecular weight depending on gas composition that evolves
with time.
Improved model formulation
(
+)
=(
∞ −)
+ t D R 1 R C C D R 3 R 2 R p T M dt d p p sat b 2 p LV 3 p imp gas π γ (9)Compared to Kardos [24] and Wood’s work [25], no assumptions where made to simplify the resolution, and non isothermal and non isobar conditions as well as gas molecular weight variation and surface tension effects where taken into account.
The molecular weight considered for pure water vapour and pure air are respectively 18.10
-3 kg.mol-1 and 28.10-3 kg.mol-1. Actual bubble gas molecular weight is updated using a
linear combination based on their respective volume fraction.
As a result, equation (9) is highly non-linear and numerical methods are required for radius variation calculation versus time.
As void growth is a relatively slow process (with respect to autoclave type cycles), computation can be simplified in assuming that all parameters reach equilibrium for each time increment.
Experimental model parameter determination
Main input parameters, diffusivity D, gas concentration Csat and C were experimentally
determined as follow. Previously dried, prepreg samples were exposed to three levels of temperature (6°C, 20°C, 40°C) and humidity (60%, 80%, 90%), for a maximum duration of one month. Mass increase was regularly measured along this period, and has shown a typical Fick behaviour. Diffusion coefficient that expresses the capacity for mobile
( )
= − T R E D T D b a O exp (10)Parameters Do, pre-exponential constant and Ea, diffusion activation energy per mole, were
determined thanks to a linear regression of experimental data and are reported in table 3. This equation was assumed to be also valid at higher temperature (i.e. during curing cycle). Resin water concentration, C, was estimated from environmental humidity ratio, (%), of
prepreg resin weight fraction, Wr and resin specific mass, r following equation (11):
( )
R R b W a C 100 ρ ϕ ψ = (11)The adjustment parameter – that varies between 0 and 1- allows a differentiation between the water molecules chemically reacting with polymer following a hydrolyse reaction and
those able to diffuse into the resin. Expression a( )b is used to describe the solubility of
water in resin, experimental values of parameters a and b are reported in table 3.
Bulk resin water concentration can be expressed directly using the relationship (11), if air humidity ratio in contact with resin is known. This humidity ratio ( ), corresponds to the environmental humidity ratio existing in the manufacturing, cutting and laid up workshops (classical value is 55 ± 5%). In the following a value of 60% was chosen and was
considered to be constant all over the curing cycle. Water concentration close to the void interface is more complicated to model with respect to the variation of bubble gas humidity ratio, induced by water molecule diffusion from resin into void. Definition of gas relative humidity ratio ( ) is given by the ratio of partial vapour pressure and saturated vapour pressure as shown in equation (12). Water vapour saturated pressure is related to temperature following Dupré Bertrand relation (13) which is a modified Clausius-Clapeyron relationship [38].
sat O H O H p p 2 2 100 = ϕ (12)
( )
=( )
− T 1 T 1 R E exp T T T p T p ref b R ref 0 sat O 2 H sat O 2 H b α β (13)( )
' 0 2 T psat OH is the saturated water vapour pressure at reference temperature T’0, and E are
two parameters used to adjust the evaporation enthalpy of water versus temperature increase. Table 3 summarises all parameter values used in the diffusion model.
Water vapour partial pressure depends on water mole fraction in gaseous void mixture
(xH2O) following Dalton relation:
g O H O H x p p 2 = 2 (14)
Gas concentration at bubble wall, Csat, (equation (15)), can now be expressed combining
equation (5) and (11 to 14). First expression of Csat in equation (15) is valid as long as water partial pressure is lower than saturated water partial pressure.
( )
( )
( )
if p p( )
T W a C T p p if T T R T T T p R p x W a C sat O H O H b R R sat sat O H O H b ref b R ref sat O H p LV imp H R R sat b 2 2 2 2 0 2 20 100 100 1 1 exp 2 100 100 ≥ = < − − = ρ ψ α γ ρ ψ β (15) Simulation resultsAll previous equations were combined to get the final non-linear differential equation that is able to describe void size evolution along the curing cycle. It takes into account on one hand the external temperature and pressure imposed during the cycle, and on the other hand
the water molecule diffusion phenomenons through the void interface. A dedicated Matlab subroutine was developed to solve this equation using an implicit Euler scheme. Time step
( t = 10-3 s) was adapted to insure the stability of the computation.
Model results are plotted in fig. 5 and compared to Wood and Kardos models.
Temperature and curing cycles are the same as those imposed in the previous mechanical model. Three stages can be distinguished on fig. 5(c). During first stage, whatever the model, void radius grows rapidly due to the temperature effect on diffusion. This increase is
related to the exponential variation of diffusion coefficient and to the decrease of Csat. As
Kardos model does not take into account surface tension, void size predicted is more than two times higher.
The high maximum values obtained with these three models are mainly related to the assumption on constant infinite concentration. From a physical point of view, validity of this approximation may be questionable and experimental tests are necessary to get a better evaluation for the relation between these parameters and temperature and pressure applied on the bubble.
After the first stage, hydrostatic pressure is applied on resin, and void radius decreases more or less rapidly, depending on the considered model. The drop observed on Kardos results is related to perfect gas law with the assumption of a constant material quantity inside bubble during pressure application. Conversely, Wood’s model shows low sensitivity to pressure gap. Current model combines the advantages of these two previous models: limited initial void size increase followed by pressure sensitivity. Saturation concentration variations obtained from current model are plotted fig. 5(b). It can be seen that during first stage, this concentration decreases due to the diffusion toward the bubble, whereas after
pressure application, the increase of the concentration in the bubble reverses the
phenomena and Csat increases towards values higher than Cinfini. As a consequence void size
evolution due to concentration differences becomes negligible from the beginning of the stage 3. After the end of pressure application, void radius seems to be stabilized. Only current model predicts a low void reduction of about 20 %.
5) Coupled visco-mechanical and gas diffusion void growth model
The main goal of this improved and combined model is to add the viscosity and polymer crosslinking effects to the previous diffusion model and also to improve the role played by hydrostatic pressure.
In this combined model gas pressure inside void is derived from equation (3) that can rewritten as followed
(
)
+ + = LV p p imp g T R R p p γ η ,α 2 4 (16) Equation (8) allows the calculation of gas mass evolution during a time step dt:( )
(
+(
)
+)
= LV p imp p p gaz b R p R T T R M dt d R dt dm π 2γ 4η ,α 3 4 2 (17) Using the diffusion model developed previously, this mass variation can be expressed using equation (18) (combination of equations (6), and first Fick’s law):(
−)
+ = ∞ t D R R C C D dt dm p p sat π π 1 4 (18)
(16) in order to obtain the total gas pressure inside void. This last parameter is linked to the partial water vapour with the Dalton relation (14).
Computation procedure for solving the above equations requires several steps. First, for a given time step, temperature and pressure imposed on system are updated. With these new values, resin viscosity is calculated using equation (1) and (2). Then, a first test is made to
verify whether the limit value of 109 Pa.s for viscosity is reached or not. If it is the case,
calculation is stopped. If not, diffusion coefficient D and water concentration near the
bubble wall, Csat are determined thanks to equation (10) and modified equation (15).
Afterwards void gas mass variation due to diffusion only is determined thanks to equation (18). Another loop stop is introduced in order to verify if the new gas mass inside void is positive. If this condition is not satisfied, time step has to be shorten. Else, molecular
weight of gas Mgas and mole fraction of water in gaseous void mixture (xH2O) are updated
too. Subsequently the new void radius is calculated using (17) relationship. This procedure is repeated until viscosity reaches the upper value, or until curing cycle is finished.
Previous computation procedure was used for parametrical studies in order to identify the more influent parameters on void reduction. Seven selected cases where investigated (table 4) and five of them are reported in fig. 6. The reference curve (shown with rhomb markers) is the coupled diffusion/mechanical model result obtained for the curing cycle of fig. 5(a). When compared with the only diffusion model (triangular marker or fig. 5(c)), visco-mechanical phenomena reduce significantly (-30%) initial void growth (remind the logarithm scale of the curve).
Next, three types of parameters have been investigated successively:
• polymerization cycle parameters, i.e. onset of pressure application (40 min (circle
markers) instead 70 min, and 20min);
• physico-chemical parameters, i.e. resin bulk diffusive species concentration (divided
by 10, square markers), and diffusion coefficient divided by 10 (see table 4).
Following general trends have been highlighted (Table 4). First, decreasing initial void size in optimizing the lay-up conditions has low effect on its final value. This is true as far as initial void size remains in the industrial best practice range. Second, onset of hydrostatic pressure application has a major effect in limiting diffusive species void growth: as can be seen in fig. 6 moving the pressure application from the middle of the first temperature gelation dwell towards its beginning divides the final void radius by a factor of 3 . This is enhanced if pressure is applied after only 20 min, where size is divided by a factor of 20. The earlier hydrostatic pressure is applied, the smaller is the void size increase. This could explain the industrial practice to apply the hydrostatic pressure since the beginning of curing cycle for these new generation resin systems. Lastly, the mastering of the resin bulk diffusive species concentration C is the second important parameter affecting the void behaviour. As a matter of fact, dividing this concentration by a factor of 10 results in a other decrease of the final radius by a factor close to 15 ( simulation show a final void radius close to 0.3 mm, which is of the same order of magnitude as some voids observed by image analysis). Lastly a decrease of diffusion coefficient by a factor of 10 diminishes final void size by a factor of 3.
In summary three parameters where found to have a major effect on void size evolution during curing: the onset of pressure application, the initial water concentration and the diffusion coefficient. Amongst them the two first may be easily mastered in industry. Newertheless, from a modelling point of view, future work is required to confirm the
importance of diffusive species concentration, especially in trying to compare experimental in-situ bubble growth measurements with numerical predictions.
CONCLUSION
In this paper, the effects of diffusion and visco-mechanical phenomena have been
investigated with respect to void growth during autoclave curing cycle of a new generation resin system. Three types of void growth models were developed successively: the visco-mechanical model, the gas diffusion controlled model, and the coupled visco-visco-mechanical and diffusion model. After resin curing kinetics and rheological characterization, predicted results were obtained after the development of a computational numerical code. It was shown that diffusion is favoured by the increase in temperature that induces the growth of water gas bubble. Pressure application inverses the concentration gradient in diffusive species and marks the sudden shrinking of void radius until the system reaches a
mechanical and diffusion state of equilibrium. Then, void volume is stabilized until the end of curing. It was also shown that the onset of pressure application, the diffusive species concentration as well as the diffusion coefficient are the three major parameters to have to be controlled in order to minimize the final void radius. Although if major focus was on the prepreg process, this coupled model may also be used for void size prediction during polymerization in other processes like RTM or SMC.
ACKNOWLEDGMENTS
The authors would like to acknowledge J. Charles and J. M. Bergerat for fruitful discussions and Airbus for having supported this work.
1. Tang JM, Lee WI, Springer GS. Effects of cure pressure on resin flow, voids, and
mechanical properties. J Compos Mater 1987;21:421-440.
2. Liu L, Zhang BM, Wang DF, Wu ZJ. Effects of cure cycles on void content and
mechanical properties of composite laminates, Compos Structures 2006;73:303-309.
3. White SR, Kim YK. Staged curing of composite materials. Compos: Part A
1996;27A(3):219-227.
4. Yokota MJ. In-Process controlled curing of resin matrix composites. SAMPE Journal
1978;11-17.
5. Bowles KJ, Frimpong S. Void effects on the interlaminar shear strength of
unidirectional graphite-fiber-reinforced composites. J Compos Mater 1992;26(10):1487-1509.
6. Gutowski TG, Cai Z, Bauer S, Boucher D, Kingery J, Wineman S. Consolidation
experiments for laminate composites. J Compos Mater 1987;21:650-669
7. Loos AC, Springer G. Curing of epoxy matrix composites. J Compos Mater
1983;17:135-169.
8. Wisnom MR, Reynolds T, Gwilliam N. Reduction in ILSS by discrete and distributed
voids. Compos Sci Technol 1996;56:93-101.
9. Yoshida H, Ogasa T, Hayashi R. Statistical approach to the relationship between ILSS
and void content of CFRP. Compos Sci Technol 1986;25:3-18.
10. Müller de Almeida SF, Nogueira Neto ZS. Effect of void content on the strength of
composite laminates. Compos Struct 1994;28:139-148.
11. Liu L, Zhang BM, Wang DF, Wu ZJ. Effects of cure cycles on void content and
mechanical properties of composite laminates. Compos Struct 2006;73:303-309.
12. Lundström TS, Gebart BR, Lundemo CY. Void formation in RTM. J Reinf Plastics
Compos 1993;12:1340-1349.
13. Leclerc JC, Ruiz E. Porosity reduction using optimized flow velocity in Resin Transfer
Molding. Compos Part A 2008;39(12):1859-1868.
14. Frishfelds V, Lundstrom TS, Jakovics A. Bubble motion through non-crimp fabrics
during composites manufacturing. Compos Part A 2008;39(2):243-251.
15. Gourichon B, Deleglise M, Binetruy C, Krawczak P. Dynamic void content prediction
during radial injection in liquid composite molding. Compos Part A 2008;39(1):46-55.
16. Lundstrom TS, Frishfelds V, Jakovics A. Bubble formation and motion in non-crimp
fabrics with perturbed bundle geometry. Compos Part A 2010;41(1):83-92.
17. Ruiz E, Achim V, Soukane S, Trochu F, Bréard J. Optimization of injection flow rate
to minimize micro/macro-voids formation in resin transfer molded composites. Compos Sci Technol 2006; 66(3-4):475-486.
18. Olson NEJ, Lundstrom TS, Olofsson K. Design of experiment study of compression
moulding of SMC. Plast Rubber and Compos 2009; 38(9-10):426-431
19. Comte E, Merhi D, Michaud V, Manson JAE. Void formation and transport during
SMC manufacturing: effect of the glass fiber sizing. Polym Compos 2006; 27(3):289-298.
20. Odenberger PT, Andersson HM, Lundstrom TS. Experimental flow-front visualisation
in compression moulding of SMC.
21. Pitchumani R, Ranganathan S, Don RC, Gillespie JW, Lamontia MA. Analysis of
transport phenomena governing interfacial bonding and void dynamics during thermoplastic tow placement. Inter J Heat Mass Transf 1996;39(9):1883-1897.
22. Wang W, Zhang Z, Xie F, Li M, Dai D, Wang F. Correlated rules between complex
structure of composite components and manufacturing defects in autoclave molding technology. J Reinf Plastics and Compos 2009, 28(22):2791-2803.
23. Li m, Li Y, Zhang Z, Gu Y. Pressure window analysis for thin laminated composites in
autoclave process. Polymer Compos 2009; 30(2):169-175.
24. Kardos JL, Dudukovic MP. Void growth and resin transport during processing of
thermosetting – matrix composites. Adv Polym Sci 1986; 80:101-123.
25. Wood JR, Bader MG. Void control for polymer-matrix composites (1): experimental
methods for determining the growth and collapse of gas bubbles. Compos Manufact 1994;5(3):139-147.
26. Kardos JL. The processing science of reactive polymer composites. Adv Compos
Manufact 1997; Chapter 2, Edited by T.G. Gutowski,43-80.
27. Kwak HY, Kim YW. Homogeneous nucleation and macroscopic growth of gas bubble
in organic solutions. Intern J Heat Mass Transf 1998;41:757-767.
28. Halley PJ, Mackay ME. Chemorheology of thermosets – an overview. Polym Eng Sci
1996;36(5):593-609.
29. Ivankovic M, Incarnato L, Kenny JM, Nicolais L. Curing kinetics and chemorheology
of epoxy/anhydride system. J Applied Polym Sci 2003;90:3012-3019.
30. Lee CL, Wei KH. Curing kinetics and viscosity change of a two-part epoxy resin
during mold filling in resin transfer molding process. J Applied Polym Sci 2000;77(10):2139-2148.
31. Williams ML, Landel RF, Ferry JD. The temperature dependence of relaxation
mechanisms in amorphous polymers and other glass-forming liquids. J American Chem Soc 1955;77:3701-3707.
32. Castro JM, Macosko CW. Kinetics and rheology of typical polyurethane reaction
injection molding systems. SPE ANTEC Technical paper 1980:434-438.
33. Amon M, Denson CD. A study of the dynamics of foam growth: analysis of the growth
of closely spaced spherical bubbles. Polym Eng Sci 1984;24(13):1026-1034.
34. Ledru Y, Piquet R, Schmidt F, Michel L, Bernhart G. Modelling of void growth
mechanisms during the manufacturing of composite laminates. Proc. of the 9th FPCM
2008;1.
35. Ledru Y. Etude de la porosité dans les matériaux composites stratifiés aéronautiques.
PhD Thesis, University of Toulouse, 2009, in french.
36. Epstein PS, Plesset MS. On the stability of gas bubbles in liquid-gas solutions. J Chem
Physics 1950;18(11):1505-1509.
37. Lundstrom TS. Measurement of void collapse during resin transfer moulding. Compos
Part A 1997; 28:201-214.
38. Rivas-Enterrios J, Kohl P. Construction d’un diagramme psychrométrique de Mollier.
Symbol ko1 ko2 Ea1 Ea2 Tgo ηg n1 n2 αg αmax C1 C2 a
Unit s-1 s-1 kJ/mol kJ/mol K Pa.s / / / / / / /
Value 1528 1,6 59,4 26,3 235 1012 0,51 1,49 0,345 -3,8+0,0099 T 29,9 30,0 2,1
Table 1 Epoxy resin chemorheology model parameters
Symbol LV To po Ro
Unit Pa.m °C Pa µm
Value 0,05 30 10000 10
Table 2 Model initial conditions
Symbol Do Ea Wr r a b pHsat2O
( )
T0 Tref EUnit m².s-1 kJ.mol-1 / kg.m-3 / / / Pa K J.K1.mol- -1 J.mol-1
Value 0,32 53,3 0,4 1280 0,9 2 10-4 1,7 3169 298 43,893 57073
Table 3 Diffusion model parameter values
Model type Ro (µm) Onset of pressure application (minutes) Initial water concentration C (kg/m3) Initial diffusion coefficient D (m²/s) Final void size (mm) Only diffusion 10 70 82,6 2,7 10-12 20 Mechanical and diffusion 10 70 82,6 2,7 10-12 14 Mechanical and diffusion 5 70 82,6 2,7 10-12 14 Mechanical and diffusion 10 40 82,6 2,7 10-12 5 Mechanical and diffusion 10 20 82,6 2,7 10-12 0,5 Mechanical and diffusion 10 40 8,3 2,7 10-12 0,3 Mechanical and diffusion 10 40 82,6 2,7 10-13 1,6
V is co si ty (P a. s) T em pe ra tu re (° C ) Temperature Experimental viscosity Simulated viscosity Time (min)
Fig. 1. Comparison between calculated and experimental rheological data
P
gasResin
P
impP
impP
impP
impT°
T°
T°
T°
(a) resin void fiber (b) 100 µmFig. 2. (a) Schematic of the cellular model, (b) Micrography of representative void in
Time (min) T em pe ra tu re (° C ) Pr es su re (b ar ) Temperature V oi d ra di us (µ m
) Void radius Viscosity
R es in v is co si ty (P a. s) 2 3 1 Pressure (a) (b)
Fig. 3. Void radius evolution according to temperature, pressure, resin viscosity and time.
Fig. 4. Experimental void size investigation: (a) micrography (voids are represented in
green color) (b) equivalent radius mean size distribution
<3 4 5 6 7 8 >8 40 35 30 25 20 15 10 5 0
Void equivalent radius (µm)
N um be r of v oi d /m m ² 192 250 µm (a) (b)
Pr es su re (b ar ) T em pe ra tu re (° C ) V oi d ra di us (m m ) Temperature Wood model current model Kardos model Pressure Time (min) 2 3 1 Time (min) G as c on ce nt ra tio n (k g. m -3 ) Time (min) CSAT Cinfini (a) (b) (c)
V oi d ra di us (m m )
Only diffusion model
Mechanical and diffusion model Initial void radius smaller (5 µm) Pressure application earlier (40 min) Diffusion phenomenon reduced ( = 9%)
Time (min) 0,001 0,1 0,01 10 1 100 0 20 40 60 80 100 120
Fig. 6. Void radius versus time, temperature, pressure, resin viscosity and diffusive species
![Fig. 5. Void radius calculated from Kardos [24], Wood [25] and current model](https://thumb-eu.123doks.com/thumbv2/123doknet/12409301.332734/25.918.134.811.107.799/fig-void-radius-calculated-kardos-wood-current-model.webp)

