Material and Methods
Since 1998, the Belgian surveillance program assess the contamination with E. coli of meat from beef, pork, layers, broilers, turkeys and fishes. The matrixes investigated are shown in table 1.
The enumeration of E. coli (in cfu/g or cm2) has been realised on the chromogenic Rapid E. coli 2 medium (Sanofi Diagnostics Pasteur) after an incubation of 24h at 44°C.
Control charts have been done for each company investigated and these charts have been linked to prevalence of pathogens (Salmonella and Campylobacter).
Introduction
• The faecal contamination is likely the main source of potential human pathogens including Salmonella, Campylobacter and
enterohemorrhagic Escherichia coli on animal carcasses and on meat. Leakage from the gastrointestinal tract or contact with the animal skin could cause widespread contamination. In warm-blooded animals, the best indication of faecal contamination is Escherichia coli numbering. This microorganism is widely present in the gastrointestinal tract and survives under refrigerated conditions but temperatures below 7°C prevent its growth.
• The USDA has chosen E. coli as indicator of faecal contamination and the enumeration has to be done mandatory for all industries commercializing meat in the United States of America.
• The Belgian surveillance of meat in 1998 has allowed the evaluation of the sampling method and criteria for the Belgian production surveillance are proposed.
Results and discussion
This study was financially supported by the Institute of Veterinary Expertise (Public Health).
Application and revision of microbiological criteria for the quality control of
faecal contamination in Belgian slaughterhouses and cutting rooms
G. Daube1, Y. Ghafir1, JM. Dumont2, JY. Francois1, M. Cornelis4, M. Jouret4and L. De Zutter3
1 Food Microbiology, Faculty of Veterinary Medicine, University of Liege, Liege, Belgium 2Public Health Institute - Louis Pasteur, Brussels, Belgium
3Food Microbiology, Faculty of Veterinary Medicine, University of Gent, Gent, Belgium 4Institute of Veterinary Expertise (Public Health), Brussels, Belgium
Conclusion
Bibliography
Table 1: Matrixes investigated
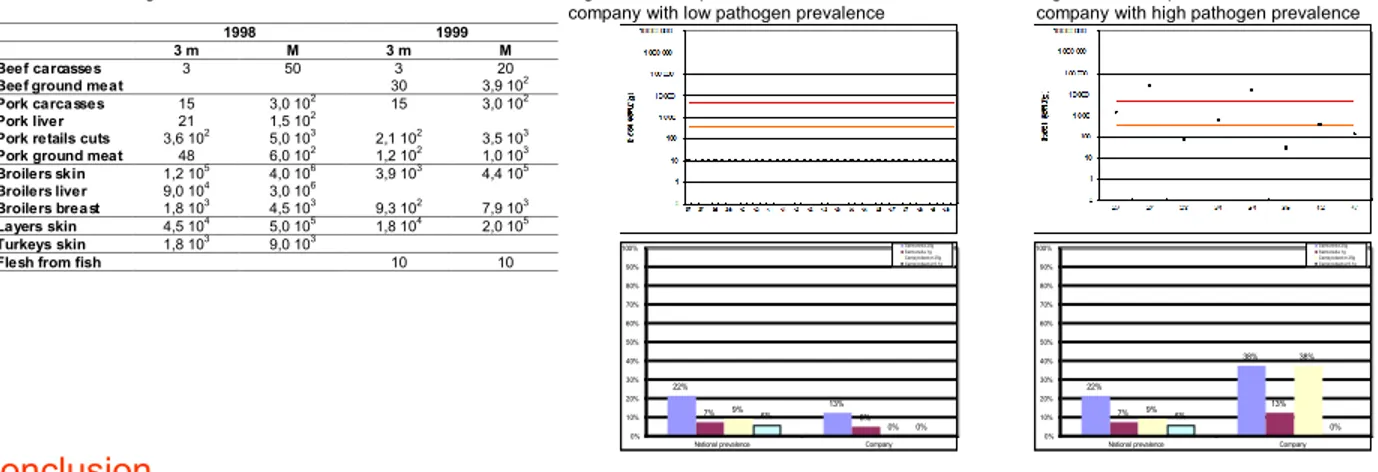
Selected results of the enumeration of E. coli obtained in 1998, 1999 and 2000 (part) are presented in figure 1-10 and all criteria are listed in table 2. Figure 11 and 12 show the link between faecal contamination and prevalence of pathogens.
It is to be noted that, firstly, the criterion for fishes (figure 10) is useless as it corresponds to the detection limit of the method; secondly, all ”3m" criteria are equal or better in 1999 than in 1998 except for ground minced meat of pork due to the sample origin (from cutting rooms in 1998 and from butchers in 1999).
Figure 1: Beef carcasses Figure 4: Pork carcasses Figure 5: Pork retail cuts
Figure 6: Pork minced meat Figure 7: Broilers carcass Figure 8: Broilers boneless breast Figure 9: Layers carcasses Figure 10: Fishes
These criteria are useful for internal quality control. They will allow an evaluation of the normal contamination rate of the industry, in excluding the accidental contaminations. These criteria must be completed and reviewed at the end of the surveillance program 2000.
Table 2: Microbiological criteria in 1998 and 1999 Figure 11: Example of faecal contamination in a company with low pathogen prevalence
Figure 12: Example of faecal contamination in a company with high pathogen prevalence
Food Safety and Inspection Service (FSIS), Federal Register of Department of Agriculture, FSIS, Part II, 9CFR Part 304 Pathogen reduction; HACCP Systems; Final rules, partim pages 38846-38848.
Figure 2 : Beef minced meat Figure 3 : Calf carcasses
1998 1999
3 m M 3 m M
Beef carcasses 3 50 3 20
Beef ground meat 30 3,9 102
Pork carcasses 15 3,0 102 15 3,0 102
Pork liver 21 1,5 102
Pork retails cuts 3,6 102
5,0 103
2,1 102
3,5 103
Pork ground meat 48 6,0 102 1,2 102 1,0 103
Broilers skin 1,2 105 4,0 106 3,9 103 4,4 105 Broilers liver 9,0 104 3,0 106 Broilers breast 1,8 103 4,5 103 9,3 102 7,9 103 Layers skin 4,5 104 5,0 105 1,8 104 2,0 105 Turkeys skin 1,8 103 9,0 103
Flesh from fish 10 10
22% 38% 7% 9% 13% 38% 6% 0% 0% 10% 20% 30% 40% 50% 60% 70% 80% 90% 100%
National prevalence Company
Salmonella 25g Salmonella 1g Campylobact er 25g Campylobact er 0,1g 22% 13% 7% 9% 5% 0% 6% 0% 0% 10% 20% 30% 40% 50% 60% 70% 80% 90% 100%
National prevalence Company
Salmonella 25g Salmonella 1g Campylobact er 25g Campylobact er 0,1g