HAL Id: hal-01199727
https://hal.archives-ouvertes.fr/hal-01199727
Submitted on 16 Sep 2015
HAL is a multi-disciplinary open access
archive for the deposit and dissemination of
sci-entific research documents, whether they are
pub-lished or not. The documents may come from
teaching and research institutions in France or
abroad, or from public or private research centers.
L’archive ouverte pluridisciplinaire HAL, est
destinée au dépôt et à la diffusion de documents
scientifiques de niveau recherche, publiés ou non,
émanant des établissements d’enseignement et de
recherche français ou étrangers, des laboratoires
publics ou privés.
Measurements of Cardiac and Cardiopulmonary
Activities Using Contactless Doppler Radar
Sarah El-Samad, Dany Obeid, Gheorghe Zaharia, Sawsan Sadek, Ghais El
Zein
To cite this version:
Sarah El-Samad, Dany Obeid, Gheorghe Zaharia, Sawsan Sadek, Ghais El Zein. Measurements
of Cardiac and Cardiopulmonary Activities Using Contactless Doppler Radar. 2015 3rd
Interna-tional Conference on Advances in Biomedical Engineering (ICABME), Sep 2015, Beilut, Lebanon.
�10.1109/icabme.2015.7323285�. �hal-01199727�
Measurements of Cardiac and Cardiopulmonary
Activities Using Contactless Doppler Radar
Sarah El-Samad
1,2, Dany Obeid
1, Gheorghe Zaharia
2,
Sawsan Sadek
1, Ghais El Zein
2 1Doctoral School of Science and Technology, Lebanese University, Lebanon
2
IETR - UMR CNRS 6164, INSA Rennes, France
Abstract-This paper presents a wireless measurement system
for cardiopulmonary activity. This system generates a continuous wave signal at 2.4 GHz toward the target and then measures the reflected signal. The target is the person’s chest set at a distance of 1 m. The radar system contains a vector network analyzer, which measures the phase of S21. The phase variation of S21
contains information about heart and respiration activity. Measurements are performed with two different conditions, while the person is holding respiration for 10 seconds and then breathing normally for the same duration. Filtering is used as processing technique to separate heartbeat signal from respiratory signal in the second case. The measurements were performed simultaneously with a PC-based electrocardiograph which is used as a reference to validate the information extracted from the measured signals.
Keywords-heartbeat detection; wireless monitoring; Doppler radar; electrocardiogram; signal; heart rate, heart rate variability
I. INTRODUCTION
Nowadays, research efforts have been moving the technology development toward lower power, better accuracy, long detection range, and more robust operation for practical portable and handheld applications [1]. Although, there is a huge attraction toward contactless monitoring patient‟s heartbeat, especially when the traditional electrocardiogram (ECG) measurements with fixed electrodes are not practical in some cases like infants at risk, sudden infant syndrome or burn victims [2], [3].
Non-contact microwave radar sensors have advantages over other contactless measurement like video technologies, as microwave radar has sensibility towards tiny movements due to heartbeat and respiration. In addition, the signals transmitted by microwave sensors can penetrate walls and obstacles, and Doppler characteristics reveal extra details of motion, and thus enable gesture recognition [4]. There are several main-stream radar architectures found in the literature, like single-tone continuous-wave (CW) radar, impulse-radio ultra-wideband (UWB) and frequency-modulated continuous-wave (FMCW). Continuous-wave (CW) radar has lot of advantages: it immunes to stationary clutter interference [5] and it is robust because of its high precision displacement measurements [4], [6]. However, since the single-tone radar does not transmit an instantaneous bandwidth, it does not possess range resolution [7]. On the other hand, range tracking of the ultra-wideband algorithm is not based on phase measurements that are very convenient to get phase variation of the signal [7]. FMCW radars allow measuring the distance of the detected subject, and
can detect motion [6]. Accuracy is a critical issue. For example, FMCW radar requires 1.5 GHz bandwidth to achieve 10 cm resolution [5].
In this paper, Doppler radar is proposed for healthcare applications. It allows the measurement of vital signs concerning cardiac and cardiopulmonary activities. Measurements were conducted in order to extract the heartbeat rate (HR) and the heart rate variability (HRV), in two different configurations: with and without breathing. The obtained results are then compared to those given by an ECG. Breathing will be measured using a 2.4 GHz CW signal, and heartbeat parameters like HR, HRV will be extracted using filtering techniques. Previous works applied these techniques to simulation models to extract heartbeat and respiratory parameters [2]. In this work, these techniques are applied to real measurements.
The rest of the paper is organized as follows: The proposed microwave system is presented in Section II. The heartbeats detection after the signal processing is described in Section III. Section IV summarizes the heart rate and heart rate variability values extracted from the measured signals. Finally, the conclusion is given in Section V.
II. SYSTEM DESCRIPTION
The measurement system is designed for heartbeat measurement with the ability of tuning both frequency and power of the transmitted wave [2], [8], [9]. The simplicity of the system is useful in order to determine the optimal frequency with the minimum power before the implementation process [2], [10]. According to Doppler effect, a constant frequency signal reflected off an object having a varying displacement will result in a reflected signal with a time varying phase [11], [12]. The relation between the chest displacement ∆x(t) and the phase variation ∆(t) is the following:
4π
Δθ(t)=
Δx(t)
λ
where is the wavelength of the transmitted signal. In our case, the object is the patient‟s chest; the reflected signal contains information about heartbeat and respiration of the patient when breathing normally [2], [8]. The main information extracted from the obtained signal is the heartbeat rate (HR) and the heart rate variability (HRV). The heartbeat rate is the number of beats per unit time; the heart rate variability is defined as the variation of the duration of R-R intervals [13]. HRV is
regarded as an activity indicator of autonomic regulation of circulatory function, because it may predict disease states and can be assessed to determine the presence of cardiac abnormalities [2]. The average peak-to-peak chest motion due to respiration is between 4 and 12 mm, and due to the heartbeat alone is between 0.2 and 0.5 mm. At rest, the respiration frequency varies between 0.1 and 0.3 Hz. Moreover, the heartbeat frequency changes within the 1 and 3 Hz interval. Hence, the respiration rate varies between 6 and 18 Breaths per minute (Bpm) and the heartbeat rate varies between 60 and 180 beats per minute (bpm) [2], [8]. In this paper, we aim to compare extracted parameters from 2 different conditions of measurements done on a person: when holding breath and when breathing normally. The system is based on a Vector Network Analyzer (VNA) and two horn antennas. The VNA is widely used for RF applications and microwave measurements. The VNA has several features; between these features, there is the ability of tuning both frequency and power of the transmitted signal. Moreover, it measures lot of parameters and especially the time variation of the phase of the transmission coefficient S21. This phase corresponds to the difference
between the phase of the received and the transmitted signal. The VNA generates a Continuous Wave (CW) signal, the emitted frequency is 2.4 GHz and the emitted power is 0 dBm. The antenna gain is 11 dB. The reflected signal that carries chest information is received by the Rx antenna and fed back into the VNA where the phase of S21 is computed [1]. 54 years
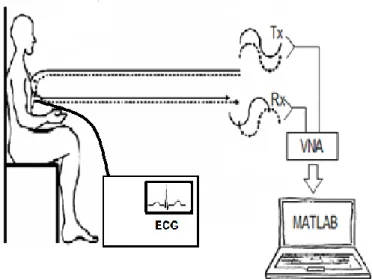
old person is sitting in front of the system at a distance of 1 m. Fig. 1 presents the contactless system and the contact ECG system.
The measurements are realized for 10 seconds, the number of points is 20000, and hence the sampling frequency is 2000 Hz. To validate the proposed system, ECG measurements are started simultaneously with the system measurements and then compared. Fig. 2 presents the phase of S21 signal for a person
who not breathes and Fig. 3 corresponds to the time variation of the phase S21 for a person who breathes normally.
Fig. 1. Proposed measurement setup [2].
Fig. 2. S21 phase of a non-breathing person (in degree).
Fig. 3. S21 phase of a breathing person (in degree).
III. SIGNAL FILTERING AND HEART RATE MEASUREMENT
Measurements are conducted in two different conditions. The first condition is for a person holding the breath, so the reflected signal contains information about chest motion resulting from only the cardiac activity. The second condition is for a person breathing normally; in this case, reflected signal contains information about chest motion resulting from both cardiac and pulmonary activities. Then processing techniques are applied. The main purpose of the processing techniques used in case of absence of respiratory is the noise reduction; this is done by using smoothing method. For a breathing person, the elimination of the respiratory signal is required because breathing amplitude is greater than heartbeat amplitude. To remove the low frequency which represents the respiratory frequency, high-pass filter (HPF) or band-pass filter (BPF) could be applied. After using processing techniques, respiratory rate and heart parameters like heart rate and heart rate variability are extracted. In order to validate the used signal processing method, on-body ECG measurements are also performed using the same start time.
As shown in Fig. 2, heartbeat signal for a non-respiratory signal is noisy, and therefore peak detection may be faulty. That‟s why smoothing method should be applied on the signal. Smoothing is applied by using a MATLAB function. This function uses sliding average of length N; it calculates the average of the center and (N-1)/2 elements before and after the
center. At the edges of the vector the number of elements before or after is reduced so that the actual window size is less than the specified window. After several trials, the length of the window „N‟ is chosen to be 150, as an optimal value for higher accuracy detection. After using smoothing method, peak detection is applied then heartbeat rate is extracted. The heart rate is calculated by the following equation:
1 2
60
...
NN
HR
d
d
d
where N is the intervals number and dk is the interval duration
expressed in seconds. The heart rate is expressed in beat per minute (bpm). Fig. 4 presents smoothed signal of the non-breathing person (in blue), and the corresponding ECG signal (in green).
Fig. 4. Smoothed S21 phase of a non-breathing person (blue),
ECG signal (green).
The heartbeat rate obtained for the non-breathing person is 74 bpm and the heart rate extracting from the corresponding ECG is 70 bpm, hence the relative error between heart rate obtained by the system and heart rate extracted from ECG is 5.71%. To detect heart beat rate of a breathing person, the respiration signal must be removed; this rejection is done using filtering. The filter is a Chebychev band pass filter with cutoff frequencies 1 Hz and 2 Hz and order n = 4. This filter attenuates all signals that have frequencies lower than 1 Hz which means lower than 60 bpm and upper than 2 Hz which means upper than 120 bpm; hence the respiratory signal and noises are eliminated. The value n = 4 is taken as a compromise between the complexity of the filter and the rejection of the undesired frequency. After using band pass filter, peak detection is applied, and then heart rate is extracted. Fig. 5 presents the peak detection of the filtered S21 signal (in
blue).
Fig. 5. Peak detection of the filtered S21 signal (blue),
and corresponding ECG signal (green).
The heart rate computed from the filtered S21 phase is 81
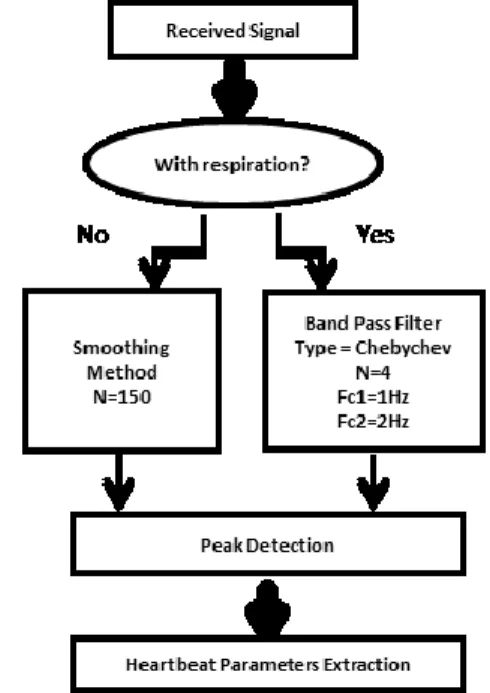
bpm. The heart rate obtained from the ECG (in green) is 82 bpm. Fig 6 presents the diagram of processing techniques used to obtain the heartbeat parameters.
Fig. 6. Processing techniques for heartbeat rate extraction.
IV. HEART BEAT RATE VARIABILITY
HRV is the variation of the heart rate; this corresponds to the variation of the R-R interval [2], which corresponds to the interval of time between two consecutive peaks detected from the filtered signal when the person was breathing, or from smoothed signal of the person who wasn‟t breathing, hence HRV is a vector of N values. N is the number of peaks coming from the heartbeat signal.
Fig. 7 presents the time variation of the delay between 2 successive peaks (duration of an interval determined by 2 successive peaks) or HRV of the person who does not breathe and Fig. 8 presents the time variation of the HRV of the person who breathes normally.
Fig. 8. HRV of the person who breathes normally (s).
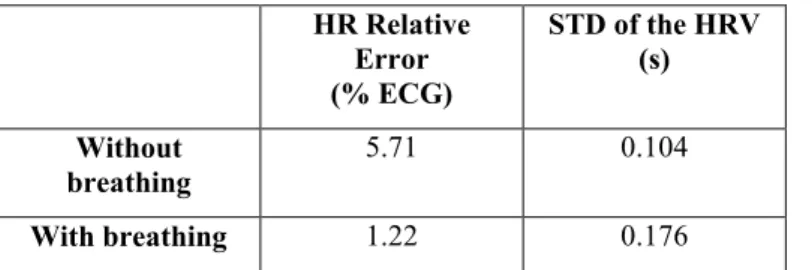
After that, the standard deviation of this variation is calculated; the results of the heart rate and heart rate variability are resumed in Table 1.
HR Relative Error (% ECG) STD of the HRV (s) Without breathing 5.71 0.104 With breathing 1.22 0.176
Table 1: Results of HR relative error and STD of the HRV.
The relative error of HR is calculated by the following equation:
The relative error of the heart beat rate for the non-breathing person is 5.71% and for the non-breathing person after using band-pass filter is 1.22%. Based on the American National Standard [14], the results are acceptable when they are lower than 10% or 5 bpm difference; hence the obtained results are satisfactory. In addition, heart rate variability standard deviation of the non-breathing person is 0.104 s and for the breathing person is 0.176 s, which is reasonable.
V. CONCLUSION
The presented measurement system generates a continuous wave toward a person‟s chest that is then reflected to the system. Using a vector network analyzer, the phase variation of S21 is measured. The phase of S21 carries information on
cardiopulmonary activity. Smoothing method is applied on non-breathing signal in order to improve the peak detection. For breathing signals, filtering method is used in order to extract heartbeat signal from the phase of S21. Hence the
respiratory effect is eliminated and then peak detection is applied to extract the parameters of the signal. These
parameters are the heart rate, and the heart rate variability. The signal processing methods used in this study were applied to real measurements and the obtained results were compared to those given by the ECG taken as reference. The obtained relative errors are less than 6%. Future applications intend to extract the heartbeat information in different configurations: behind the wall, in 4 directions like front, back, left and right.
REFERENCES
[1] C. Li, V. M. Lubecke, O. Boric-Lubecke, J. Lin “A Review on Recent Advances in Doppler Radar Sensors for Noncontact Healthcare Monitoring,” Microwave Theory and Techniques, IEEE Transactions on, Vol. 61, No. 5, May 2013, pp. 2046-2060.
[2] D. Obeid, Touchless cardiopulmonary monitoring: measurements, processing, and modeling. PhD Thesis, INSA of Rennes, Sept. 2010, 162 p.
[3] M. T. Lynette, J. M. Kudargi, “A review on RF based intruder detection using CW Doppler radar,” IOSR Journal of Electronics and Communication Engineering, Vol. 4, No. 6, 2013, pp. 28-31.
[4] G. Wang, C. Gu, C. Li, “Application of linear Continuous wave (LFMCW) Radars for Tracking of Vital Signs,” Microwave Theory and Techniques, IEEE Transactions on, Vol. 62, No. 6, Nov. 2014, pp. 2812-2822.
[5] G. Wang, J. Munoz-Ferreras, R. Gomez-Garcia, C. Li, “Clutter Interference Reduction in Coherent FMCW Radar for Weak Physiological Signal Detection,” Microwave Symposium (IMS) 2014 IEEE MTT_S International, Tampa, Florida, June 2014.
[6] L. Crocco, V. Ferrara, “A Review on Ground Penetrating Radar Technology for the Detection of Buried or Trapped Victims,” Collaboration Technologies and Systems (CTS), 2014 International Conference, Minneapolis, MN, May, 2014.
[7] G. Wang, J. Munoz-Ferreras, C. Gu, C. Li, R. Gomez-Garcia “Application of linear Continuous wave (LFMCW) Radars for Tracking of Vital Signs,” Microwave Theory and Techniques, IEEE Transactions on, Vol. 62, No. 6), June 2014, pp. 1387-1399.
[8] D. Obeid, S. Sadek, G. Zaharia, G. El Zein, “A tunable-frequency system for touch-less heartbeat detection and HRV extraction,” Proc. of IEEE ISSCS, Iasi, Romania, July 2009, 4p.
[9] D. Obeid, G. Issa, S. Sadek, G. Zaharia, G. El Zein, “Low Power Microwave Systems for Heartbeat Rate Detection at 2.4, 5.8, 10 and 16 GHz,” Proc. of the First International Symp. on Applied Sciences in Biomedical and Comm. Technol. (ISABEL 2008), Aalborg, Denmark, Oct. 2008.
[10] M. A. Othman, H. Azman, M. N. Husain, M. M. Ismail, H. A. Sulaiman, M. H. Misran, M. A. M. Said, M. Abdulaziz, N. Hassan, A. N. Che Pee, S. Suhaimi, M. R. Motsidi, “Heart Monitoring Systems at 10 GHz Using Microwave Doppler Techniques for Atheletes Fitness Monitoring System: A Review,” Australian Journal of Basic and Applied Sciences, Vol. 7, No. 14, Dec., 2013, pp. 57-70.
[11] B. Lohman, O. B. Lubecke, V. M. Lubecke, P. W. Ong, M. M. Sondhi, “A Digital Signal Processor For Doppler Radar Sensing of Vital Signs,” Engineering in Medicine and Biology Magazine, IEEE, Vol. 21, No.5, 2002, pp.161-164.
[12] D. Obeid, G. Zaharia, S. Sadek, G. El Zein, “Microwave doppler radar for heartbeat detection vs electrocardiogram,” Microwave and Optical Technology Letters Vol. 54, No. 11, pp. 2610-2617, 2012.
[13] R. Barbieri, E. C. Matten, E. N. Brown, “Instantaneous Monitoring of Heart Rate Variability,” Proc. of the IEEE EMBS, Cancun, Mexico, Sept. 2003.
[14] American National Standard, “Cardiac monitors, heart rate meters, and alarms”, ANSI/ AAMI EC13:2002