DISTRIBUTION OF TEMPERATURE AND SALINITY IN THE CANADIAN ARCTIC ARCHIPELAGO DURING THE 2009 ARCTICNET SAMPLING
EXPEDITION
By
Marie-Emmanuelle Rail1, Yves Gratton1 and Louis Prieur2
1
INRS-Eau, Terre et Environnement 490, de la Couronne
Québec, Qc Canada, G1K 9A9
2
Laboratoire océanographique de Villefranche Villefranche-sur-mer
France
2011, INRS-Eau, terre et environnement
CORRECT CITATION FOR THIS PUBLICATION :
Rail M.E., Y. Gratton and L. Prieur. 2011. Distribution of temperature and salinity in the Canadian Arctic Archipelago during the 2009 ARCTICNET sampling expedition. Report No R1248, INRS-ETE, Québec (Qc): vii + 69 p.
ABSTRACT
This report presents the CTD (Conductivity, Temperature and Depth) data obtained during the 2009 ArcticNet expedition in the Canadian High Arctic. The report contains the logbooks and detailed maps of sampling sites for the following instruments: a CTD (Conductivity, Temperature and Depth) installed on a Rosette frame, a MVP (Moving Vessel Profiler), a SCAMP (Self Contained Autonomous Micro Profiler), a ship mounted ADCP (Acoustic Doppler Current Profiler) and various instruments attached to mooring lines. Salinity and temperature data are presented as contour plots along West-East or South-North sections. An example of SCAMP data is also included.
RÉSUMÉ
Ce rapport présente un résumé des données échantillonnées lors de la mission ArcticNet qui s’est déroulée dans l’Arctique canadien en 2009. Le rapport contient un exemple des livres de bord et des cartes détaillées indiquant l’emplacement des sites d’échantillonnage pour chaque instrument utilisé. Les instruments sont les suivants : un CTD (Conductivity, Temperature, Depth) attaché à une Rosette, un MVP (Moving Vessel Profiler), un SCAMP (Self Contained Autonomous Micro Profiler), un profileur de courant (ADCP) fixé sous la coque du navire et plusieurs sondes attachées à des lignes de mouillage. Les données de salinité et de température sont présentées sous forme de contours le long de sections ouest-est ou sud-nord. Un exemple des données du SCAMP est également présenté.
TABLE OF CONTENTS ABSTRACT……….. iii TABLE OF CONTENTS……….. iv LIST OF FIGURES……….. v LIST OF TABLES……… v LIST OF APPENDICES………... vi FOREWORD……… vii 1. INTRODUCTION……….. 1 2. SAMPLING PROGRAM………... 3 ROSETTE………. 3
MOVING VESSEL PROFILER (mvp) ………... 4
SELF CONTAINED AUTONOMOUS MICRO PROFILER (scamp)……... 5
MOORINGS………. 6
SHIP MOUNTED ACOUSTIC DOPPLER CURRENT PROFILER (adcp).. 8
3. DATA PROCESSING AND QUALITY CONTROL……… 9
ROSETTE-CTD DATA……… 9
MOVING VESSEL PROFILER (mvp) ………... 9
MOORINGS DATA………. 10
MOORED ADCP DATA………...……….. 10
4. DISCUSSION………..……….. 10
5. ACKNOWLEDGMENTS……….. 11
6. REFERENCES………... 11
TABLES………... 14
LIST OF FIGURES
FIGURE 1 ArcticNet study area in 2009………. 1
FIGURE 2 Rosette sampling sites……… 3
FIGURE 3 MVP sections……….……… 4
FIGURE 4 SCAMP sampling sites……….. 5
FIGURE 5 Moorings location (2008-2009)………. 6
FIGURE 6 Moorings location (2009-2010) ……… 7
FIGURE 7 Ship-mounted ADCP sampling sites………....…. 8
LIST OF TABLES TABLE 1 Summary of ArcticNet expedition and sampling………...……….... 14
TABLE 2 Rosette and MVP sensors characteristics...……… 15
TABLE 3 Moored sensors characteristics……….. 16
TABLE 4 Summary of moored instruments 2008-2009……… 17
TABLE 5 Content of the ASCII Rosette-CTD data files………... 18
LIST OF APPENDICES
APPENDIX 1 High resolution maps of Arctic areas where Rosette-CTD, MVP,
SCAMP and moorings data were collected……….……….. 19
APPENDIX 2 Rosette-CTD data logbook……… 27
APPENDIX 3 List of Rosette sections with related casts and stations……….…… 36
APPENDIX 4 List of MVP sections………. 37
APPENDIX 5 Plots of salinity and potential temperature, Leg 2 (0902)……... 38
APPENDIX 6 Plots of salinity and potential temperature, Leg 3 (0903)……...…... 50
APPENDIX 7 Plots of salinity and potential temperature, Leg 4 (0904)……...…. 56
APPENDIX 8 LADCP data plots example……….……….. 67
APPENDIX 9 SCAMP data logbook……….………... 68
FOREWORD : ARCTICNET AND THE NETWORK OF CENTRES OF EXCELLENCE
The Canadian Network of Centres of Excellence (NCE) is a unique joint program that brings together several universities, government agencies, industrial companies and non-profit organizations. Their mission is to increase Canada’s economy and social benefits through research and entrepreneurial programs. Three Canadian federal granting agencies the Canadian Institutes for Health Research (CIHR), the Natural Sciences and Engineering Research Council of Canada (NSERC) and the Social Sciences and Humanities Research Council of Canada (SSHRC) as well as Industry Canada, have combined their efforts to financially support and oversee the initiatives of the NCE. (NCE web site at http://www.nce.gc.ca)
ArcticNet is one of the NCE networks. The central objective of this program is to bring specialists from different fields together in order to improve our understanding of the impacts of climate change on Coastal Canadian Arctic ecosystems. Begun in 2004, ArcticNet now has over 145 researchers from 30 Canadian Universities, as well as researchers from 8 federal and 11 provincial agencies and departments. Those scientists are supported in their work by several Inuit organizations and northern communities, industrial partners, and finally others scientists from 12 different countries.
The ArcticNet Network investigators study the impact of climate change in the Canadian Arctic to assess the effect of ongoing warming and modernization on Canadian Arctic ecosystems, economies and societies, as well as to help Canadians better cope with the changes and opportunities that may occur due to climate change. ArcticNet’s structure is set to translate the growing understanding of the changing Arctic ecosystem into national policies, adaptation strategies and impact assessment studies conducted on societies and marine / terrestrial coastal ecosystems in the Canadian High Arctic, the Eastern Arctic, Hudson Bay and Eastern Sub Arctic. (Please see the ArcticNet Annual Report 2007-2009 for more information). (ArcticNet web site at
In 2009, the ArcticNet sampling expedition were carried out on board the CCGS Amundsen in collaboration with two others research programs. The first one, Malina is a French program studying the effects of light penetration on the biodiversity and biogeochemical fluxes in the High Arctic and the second expedition, Canadien IPY Geotraces, is a program aiming to improve the understanding of biogeochemical cycles and large-scale distribution of trace elements and their isotopes in the marine environment.
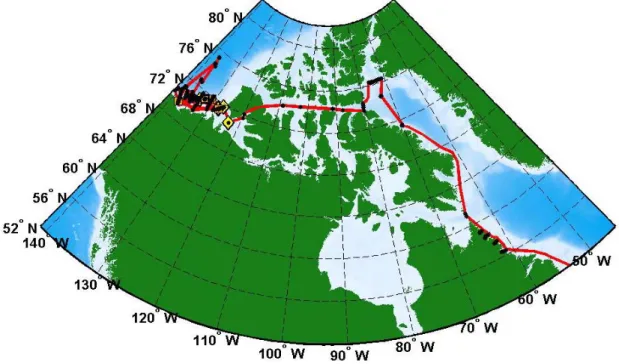
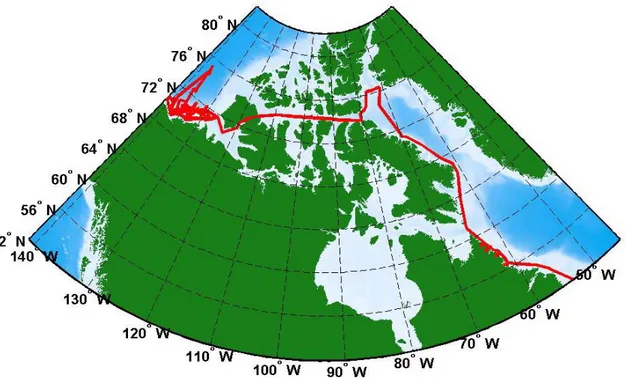
The NGCC Amundsen left Quebec City on the 4th of June 2009 to reach the Beaufort Sea, via the Panama channel and the Bering Sea, on the 16th of July. It sailed into the Beaufort Sea and the Amundsen Gulf until October 16th. Then, it started its journey through the Northwest Passage and the Baffin Bay (see Fig. 1). The Amundsen returned to Quebec City on the 18th of November 2009. The 2009 sampling expedition was divided into three legs of six weeks know as legs 2, 3 and 4. Leg 1 was the transit through Panama channel. Each one of the other legs was subdivided into two parts (a and b). Some ArcticNet participants were on board the ship most of the time, but legs 2b and 3a were dedicated to the Malina and Geotraces projects while legs 2a and 3b were dedicated to high resolution sampling and mooring deployments in the Mackenzie area by representative of Imperial Oil Limited (ASL Environment) and ArcticNet.
FIGURE 1. ArcticNet 2009 study area. Ship track is illustrated as a red line,
Rosette-CTD sampling locations are represented by black dots. Mooring sites are represented by yellow diamond-shaped dots and scamp sites are represented by orange squares.
This report provides the ArcticNet community with a synthesis of the available data resulting from these three expeditions. The data set includes 356 Rosette-CTD (Conductivity, Temperature, Depth) casts, three MVP (Moving Vessel Profiler) sections and 32 SCAMP (Self Contained Autonomous Profiler) profiles. Also included are data recorded by 13 different instruments recovered from four mooring lines as well as current data recorded along the ship track by a ship mounted ADCP (Acoustic Doppler Current Profiler). A summary of the three legs sampling effort may be found in Table 1. High resolution maps of sampling sites are presented in Appendix 1.
Related Studies
Several published studies and scientific papers have reported on the physical oceanographic processes in the Canadian Arctic. Extensive CTD profiles were collected in the polynyas of the North Water (NOW) in northern Baffin Bay. Gratton et al. (2006) presented the NOW program data in their report and two special issues have been published, Atmosphere-Ocean (volume 29, no3, 2001) and Deep-Sea Research II (volume 49, no22-23, 2002), which also presented studies on the North Water Polynya. Stewart and Lockhart (2005) have recently carried out an extensive study on the Hudson Bay region. The oceanography of the Northwest Passage was the subject of a chapter in a special issue of «The Sea» (volume 14, part B, 2005). In this paper, McLaughlin et al. (2005) presented their comprehensive study of all the oceanographic aspects and processes encountered in the Northwest Passage and explained in detail the physical and chemical oceanography of this area. The Beaufort Sea and Amundsen Gulf are the Canadian Arctic regions that have been studied the most extensively over the years, especially during the Canadian Arctic Shelf Exchange Study (CASES) program and subsequently during ArcticNet expeditions and various projects involving the Circumpolar Flaw Lead System Study (CFL) and the International Polar Year (IPY) programs. In 2008, the Journal of Geophysical Research published eleven papers from the CASES program in a special issue, volume 113, number C3. That same year, a book entitled On thin ice containing a synthesis of the work performed in every main research subject of the CASES program was edited by L. Fortier, D. Barber and J. Michaud. Simard et al. (2008) have also prepared a synthesis report regarding the CTD profiles and other physics data generated during the CASES 2002-2004 expeditions. The oceanography of the Beaufort Sea was also discussed by Ingram et al. in part «A» of the special issue of «The Sea» (volume 14, part A, 2005). Finally, a Compendium of the CFL Cruise Reports has recently been published by the University of Manitoba (Anonymous, 2009).
2. SAMPLING PROGRAM
Rosette
During the 2009 expedition, the rosette was equipped with 24 «Niskin» 12 L bottles, a SeaBird 911+ CTD with eight independent sensors (see Table 2 for sensors characteristics) and a 300 kHz LADCP (Lowered Acoustic Doppler Current Profiler). The pH probe was used only during the first 45 casts of leg 2 (0902). Then it was replaced with a CDOM fluorometer. The rosette was deployed from the ship and lowered into the water at a rate of 1 m s-1. CTD profiles were carried out in the Beaufort Sea, Northwest Passage, Baffin Bay and Labrador fjords (see Figure 2). High resolution maps of rosette sampling sites and station number are found in Appendix 1A. A total of 356 casts were obtained from 170 different stations. Rosette logbooks are presented in Appendix 2. As often as possible, station positions were selected to form section lines at strategic locations. In 2009, 20 sections with a minimum of three casts each were sampled. Four sections represent parameter evolution over time. In this case, the data were collected over a period of 24 hours. The connection between the casts, the stations and the sections is presented in Appendix 3. Contour plots of salinity and potential temperature recorded along these sections are presented in Appendices 5, 6 and 7. An example of horizontal velocity data recorded with the LADCP is presented in Appendix 8.
FIGURE 2. Location of 2009 Rosette sampling sites.
A summary of the CTD processing and quality control is presented in section 3 of this report. As a general «rule of thumb», CTD data are reserved for the ArcticNet
ArcticNet and/or the Integrated Service Data Management (ISDM) website and will be available to the international community.
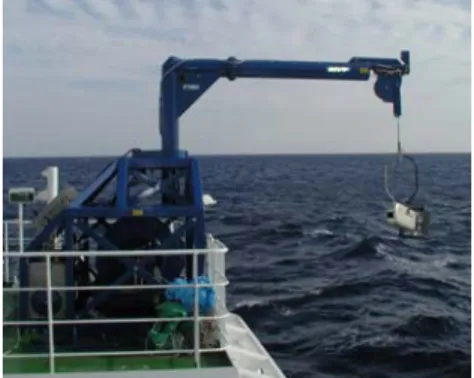
Moving Vessel Profiler (MVP)
The Moving Vehicle Profiler (MVP) is a towed CTD. It is usually set in automatic mode. The “fish” (right) freefalls at ~ 5 m s-1 and is automatically winched back to 10 m under the surface after each cast. Because of these adjustments, we lose the first and last 10 meters of the water column. It is a MVP 300-1700 model, meaning that it is equipped with 1700 m of cable and can profile down to 300 m at 12 knots. The slower the cruising speed the deeper the MVP can reach.
The MVP profiler was equipped with a CTD, a Sound Velocity probe, a fluorometer and a transmissometer. The characteristics of the probes are found in Table 2. Three sections and 113 profiles were carried out in the Beaufort Sea (see Fig. 3 and Appendix 1B). A summary of the sampling data is presented in Appendix 4. Contour plots of the salinity and potential temperature recorded along the sections are presented in Appendices 5, 6 and 7.
FIGURE 3. Location of the 2009 MVP sections (the black line is a short section on the
Self Contained Autonomous Micro Profiler (SCAMP)
The SCAMP is a CTD-type profiler. It samples at a frequency of 100 Hz (i.e. 100 times per second). It free falls at approximately 10 cm s-1, resulting in a vertical resolution of approximately one (1) millimetre, down to a maximum depth of 100 m. The instrument measures the temperature and fluctuations in salinity at a micro-scale in order to estimate the turbulent mixing occurring in the water column. In order to properly measure (as opposed to “estimate”) turbulence, we should also be measuring fluctuations in velocity. Unfortunately, due to budget limitations, we do not have access to a velocity sensor. The other sensors on the SCAMP include three temperature sensors, two salinity sensors (i.e. conductivity), a PAR (Photosynthetically Active Radiation) and fluorescence sensors.
SCAMP profiles were carried out in the Beaufort Sea (see Fig. 4 and Appendix 1C). Measurements were taken on 4 stations (30 casts) during leg 2 (0902). The logbook of SCAMP profiles is presented in Appendix 9 and an example of data profiles is presented in Appendix 10. Scamp data are not available yet. When available, processing and quality control protocols will be provided at the same time as the scamp data.
Moorings
ArcticNet moorings are identified according to the following guidelines: the letters and the first two digits represented the location (CA: Beaufort Sea; BA: Baffin Bay and AN: Hudson Bay); the last two digits are the deployment year.
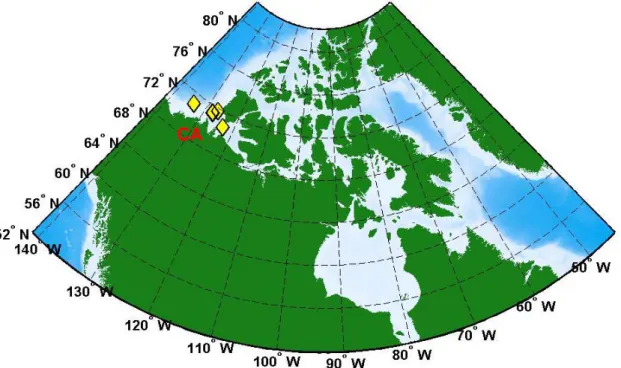
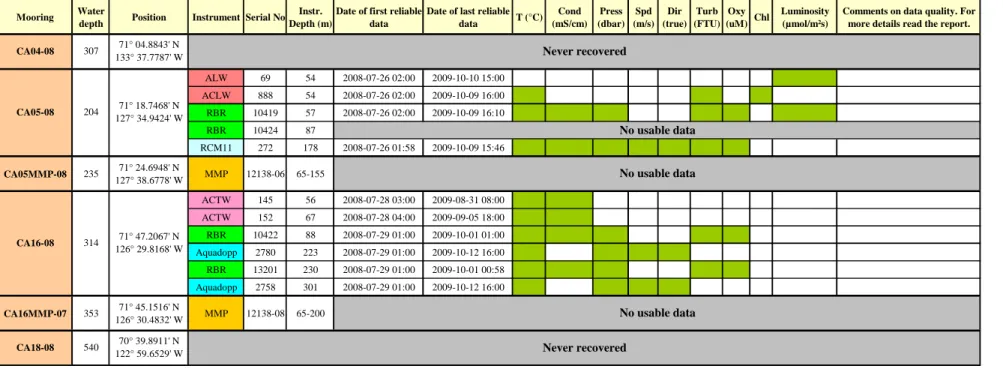
Six mooring lines were deployed in the Beaufort Sea in 2008 (see Fig. 5 and Appendix 1D). Two of them were dedicated to a MMP profiler (McLane Moored Profiler). The MMP is a moving profiler sliding up and down along the mooring line recording temperature, salinity and fluorescence data. The MMPs lines were deployed next to the “classic” mooring lines CA05 and CA16. Four of the six lines were recovered in 2009 (CA05, CA05-MMP, CA16 and CA16-MMP). CA04 could not be recover because of the ice cover while CA18 was lost. Unfortunately, the MMPs did not record reliable data. The moorings CA05 and CA16 provided data from ten different instruments. The probes characteristics are presented in Table 3. The summary of the data recovered may be found in Table 4.
CA
FIGURE 5. Mooring locations are identified by the yellow diamond-shaped dots. In
2008, six moorings were deployed on four different locations. Four were recovered in 2009.
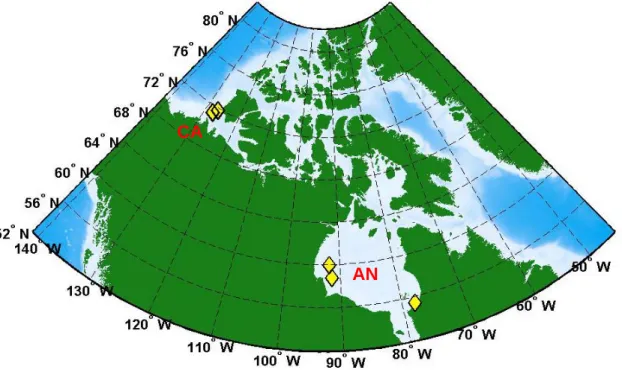
Four moorings were redeployed in the Beaufort Sea during Expedition 0904 (leg 4) and three other were deployed in Hudson Bay (see Fig. 6 and Appendix 1D). The former were deployed during a special expedition of the CCGS Pierre Radisson. This expedition took place between July 27th and August 5th 2009.
CA
AN
FIGURE 6. Moorings deployed in 2009. Mooring locations are identified by the yellow
Ship mounted Acoustic Doppler Current Profiler (ADCP)
In 2009, the CCGS Amundsen was equipped with a ship-mounted RDI Ocean Surveyor 150 kHz ADCP. The settings used for these expeditions were chosen according to the recommendations of the RDI technical staff. Attempts were done to synchronize the hull ADCP with another sensor (an EK-60) mounted close to the ADCP on the Amundsen’s hull but interferences were still occurring.
The hull ADCP recorded current data along the ship track from the beginning to the end of the expedition (see Fig 7). Ship-mounted ADCP data includes date and time, ship location, and finally an average of current speed and current direction for every 8 m cell from 8 m under the ship hull to maximum 250 m. Averages are available for a 5-minute and 10-5-minute periods. Because of sound attenuation by the ice window, the maximum bottom-tracking depth is around 240 m. This value is reduced to 100-150 m when the ship is steaming.
Data validation was not performed. Note that the raw data is available upon request.
3. DATA PROCESSING AND QUALITY CONTROL
Rosette-CTD data
The Rosette data processing and quality control are described in details by Guillot (2007b, 2010a, 2010d and 2010e). The «READ ME » file attached to each yearly CTD data set also presents the most important processing steps and corrections applied to the data files. All users should read these files so they can be aware of data limitations.
Processing included the following steps: validation of the calibration coefficients, conversion of data to physical units, alignment correction and extraction of useless data. Oxygen sensor calibration was done using Winkler titrations (Guillot 2009, 2010b and 2010c) and salinity data were compared with water samples analysed with a Guildline 8400B Autosal. The CTD data were passed through a set of quality control tests based on UNESCO’s algorithm standards (1990). The recorded data were averaged every 1 dbar. The computed oceanographic parameters were calculated using the averaged data. Missing data were linearly interpolated. Lastly, there is one ASCII file for every CTD cast. The variables and units of a typical ASCII file are shown in Table 5.
CTD profiles cover the water column down to 10 meters from the sea-bed. To reduce the amount of information presented in this report, temperature and salinity contours are only provided for each section presented in Appendix 3. The contours are presented in Appendices 5, 6 and 7. One cast was selected for every station location in the interpolation process. The temperature and salinity data were interpolated on a 5 km by 5 m grid with a triangle-based cubic interpolation method and contoured in Matlab®. The origin of each section is the westernmost or southernmost cast. For the West-East sections, West is on the left and East on the right; for the South-North sections, South is on the left and North on the right. The colorbar scales are the same for all sections of a same expedition regardless of the instrument used. More information is found in Table 6.
The LADCP fixed on the rosette frame is programmed in individual ping mode (one every second). The horizontal velocities are averaged over thirty-two, 4 m bins for a total (theoretical) range of 100 to 120 m. Since the ADCP is lowered with the rosette, there will be several measurements for each depth interval. The processing is done in Matlab® according to Visbeck (2002).
MVP data
MVP profiles cover the water column from 10 meters of the surface down to 10 meters from the sea-bed. The temperature and salinity contours are provided for each section shown in Appendix 4. The contours are presented in Appendices 5, 6 and 7. The temperature and salinity data were averaged every 1 dbar but were not interpolated. The contours plots use the original data. The origin of each section is the westernmost or southernmost cast. For the West-East sections, West is on the left and East on the right; for the South-North sections, South is on the left and North on the right.
Mooring data
Processing steps for mooring data are described in Boisvert et al. (2011). It consisted of meta-data and calibration coefficients validation, control of the instrument depth and clock, and comparison of mooring data with Rosette-CTD data recorded at the same location. Instrument depth and salinity data were corrected by adding an offset when needed. Erroneous time tags were corrected. Missing data and questionable data are mentioned in the quality control report, and they were replaced by NaNs (Not a Number). Users should consult the Quality Control Report (Boisvert et al., 2011). ASCII files were created for every instrument (see Table 4).
Moored ADCP data
The processing and quality control of ArcticNet ADCP data are still ongoing. The quality control procedures on ADCP data were adapted from the «ADCPtools» toolbox of the U.S. Geological Survey’s «Sediment Transport Instrumentation Group». The «ADCPtools» functions used by the USGS were adapted to the peculiarities of ArcticNet’s data. The tests include the validation of the calibration, data and meta-data. The modified tests used are based on comparisons between data and defined «thresholds». If a data point does not meet the thresholds it is rejected and all its associated data points are then considered as «questionable». A document presenting in details the finalized procedures of processing and quality control of ADCP data is available (Guillot 2007).
4. DISCUSSION
The 2009 ArcticNet field season saw the addition of two new instruments on our rosette: a CDOM (Colored Dissolved Organic Matter) fluorometer and a LADCP (Lowered ADCP). The fluorometer is the property of Prof. Ronald Benner from University of South Carolina while the LADCP is the property of INSU (Institut National des sciences de l’univers), a French organisation.
The CCGS Amundsen transited through Panama Canal, also a first, since the Northwest Passage is not open in July. This resulted in the earliest sampling of southern Beaufort Sea by ArcticNet since the beginning of the program in 2004. This early sampling was financed through a research agreement with Imperial Oil Limited. Many moorings were deployed on their behalf in the Mackenzie Shelf region in leg 2a and 3b by ASL Environment (see their report). Leg 2b was dedicated to the French Malina project led by Dr. Marcel Babin of CNRS (Conseil national de la recherche scientifique). In four weeks the rosette was deployed 151 times (Appendices 1A and 2A). Leg 3a was dedicated to the IPY Geotraces program. We covered (Appendices 1A and 2B) a section from the Mackenzie mouth to 75.25°N, in more than 3500 m of water where we reached 3000 m with our rosette. Geotraces used their own “clean” rosette and reached a depth of 2955 m at their station L3 (see their report). The 2009 field season provided us with a
very good spatial coverage of the Mackenzie Shelf, plus a deep South-North section up to 75.25°N.
5. ACKNOWLEDGMENTS
We thank Captains Julien and Thibault and their crew aboard the CCGS Amundsen for their outstanding collaboration. We also thank the «Rosette team», Claudie Marec, Marc Picheral, Louis Prieur, Dominique Boisvert, Véronique Dansereau, and David Huard, and all the «Rosette monkeys» for their outstanding sampling effort cast after cast after cast. Thanks to the mooring team: Luc Michaud, Pascal Massot, Sylvain Blondeau, Louis Létourneau and Steeve Gagné. And last but not least, many thanks to Pascal Guillot for his data processing efforts.
6. REFERENCES
Anonymous, 2009. CFL Scientific Cruise Report Compendium, Vol. I (legs 3-6) and II (legs 7-10). University of Manitoba Press, 786 p.
Boivert, D. and V. Dansereau. 2009a. GeoTraces 0903 – Leg 3a – Rosette team sampling report from August 27th to September 12th 2009 on board the CCGS Amundsen. Field Report (Unpublished), INRS-ETE, Québec (Qc), 9 p.
Boivert, D. and V. Dansereau. 2009b. IOL 0903 – Leg 3b – Rosette team sampling report from September 12th to October 8th 2009 on board the CCGS Amundsen. Field Report (Unpublished), INRS-ETE, Québec (Qc), 17 p.
Boivert, D. and D. Huard. 2009a. ArcticNet 0904 – Leg 4a – Rosette team sampling report from October 8th to November 6th 2009 on board the CCGS Amundsen. Field Report (Unpublished), INRS-ETE, Québec (Qc), 11 p.
Boivert, D. and D. Huard. 2009b. ArcticNet 0904 – Leg 4b – Rosette team sampling report from November 7th to November 13th 2009 on board the CCGS Amundsen. Field Report (Unpublished), INRS-ETE, Québec (Qc), 9 p.
Boisvert, D., M.E. Rail, C. Bélanger and Y. Gratton. 2011. ArcticNet 2008-2009 Mooring data quality control report. Unpublished internal report, INRS-ETE, Québec (Qc): 92 p.
Fortier, L. D. Barber and J. Michaud [Eds], 2008. On thin Ice. Aboriginal Issues Press, Winnipeg, 215 p.
Gagné, S. and V. Dupuis, 2009. Moorings Retrieval and Deployment, in : BaySys 2009 – ArcticNet Science Mission on board CCGS Radisson. Unpublished internal report, Laval University, Québec (Qc): pp. 14-19.
Gratton, Y., M. Ouellet, M.E. Rail, and R.G. Ingram. 2006. Distribution of temperature and salinity in Northern Baffin Bay during the International North Water program (August 1997, April to July 1998, and September 1999). Internal Report No R897, INRS-ETE, Québec (Qc): x + 124 p.
Gratton, Y., C. Marec, M. Picheral and L. Prieur. 2009a. ArcticNet 0902 – Leg 2a – Rosette team sampling report from July 16th to July 30th 2009 on board the CCGS Amundsen. Field Report (Unpublished), INRS-ETE, Québec (Qc), 13 p.
Gratton, Y., C. Marec, M. Picheral and L. Prieur. 2009b. ArcticNet 0902 – Leg 2b – Rosette team sampling report from July 30th to August 27th 2009 on board the CCGS Amundsen. Field Report (Unpublished), INRS-ETE, Québec (Qc), 18 p.
Guillot, P. 2007a. Rapport de traitement de données Workhorse ADCP (Acoustic Doppler Current Profiler). Technical report, draft version, Québec-Océan, Université du Québec à Rimouski, 99 p.
Guillot, P. 2007b. Sea-Bird CTD Processing and Quality Control Procedure. Technical report, draft version, Québec-Océan, Université du Québec à Rimouski: 44 p.
Guillot, P. 2009. Dissolved oxygen data tests - IOL / Malina cruise 0902. Technical Report, Québec-Océan, Université du Québec à Rimouski: 52 p.
Guillot, P. 2010a. ArcticNet 0904 CTD processing notes. Technical Report, Québec-Océan, Université du Québec à Rimouski: 84 p.
Guillot, P. 2010b. Dissolved oxygen data tests – ArcticNet cruise 0904. Technical Report, Québec-Océan, Université du Québec à Rimouski: 53 p.
Guillot, P. 2010c. Dissolved oxygen data tests – Geotraces-IOL cruise 0903. Technical Report, Québec-Océan, Université du Québec à Rimouski: 42 p.
Guillot, P. 2010d. Étalonnage du capteur de nitrate Durant la mission ArcticNet 0904. Technical Report, Québec-Océan, Université du Québec à Rimouski: 39 p.
Guillot, P. 2010e. IOL / Malina 0902 CTD processing notes. Technical Report, Québec-Océan, Université du Québec à Rimouski: 102 p.
Ingram, R.G., E.C. Carmack, F.A. McLaughlin, and S. Nicol. 2005. Polar Ocean Coastal Boundaries, chapter 3 in: The SeaIdeas and Observations on Progress in the Study of the Seas, Volume 14 part A, A.R. Robinson and K.H. Brink (eds), Harvard University Press, Cambridge: pp. 61-81.
Lanos, R., 2009. Circulation générale, masses d’eau, cycles d’évolution et transports entre la mer de Beaufort et le Golfe d’Amundsen. Ph.D. Thesis, INRS-ETE, September 2009.
McLaughlin, F.A., E.C. Carmack, R.G. Ingram, W.J. Williams, and C. Michel. 2005. Oceanography of the Northwest Passage, chapter 31 in: The SeaIdeas and Observations on Progress in the Study of Seas, Volume 14 part B, A.R. Robinson and K.H. Brink (eds), Harvard University Press, Cambridge: pp. 1213-1244.
Melling, H. 1999. Observations by moored instruments in Northern Baffin Bay 1997-1998. Unpub. Rep., Institute of Ocean Sciences, Sydney, B.C.: 37 p.
Rail, M.E. and Y. Gratton. 2011. Distribution of temperature and salinity in the Canadian Arctic Archipelago during the 2007 and 2008 ARCTICNET sampling expeditions. Report No R0001243, INRS-ETE, Québec (Qc): vii + 65 p.
Simard, A., M.E. Rail, and Y. Gratton. 2010a. Distribution of temperature and salinity in the Beaufort Sea during the Canadian Arctic Shelf Exchange Study sampling expeditions 2002-2004. Report No R1187, INRS-ETE, Québec (Qc): vii + 128 p.
Simard, A., M.E. Rail, and Y. Gratton. 2010b. Distribution of temperature and salinity in the Canadian Arctic Archipelago during the 2005 ARCTICNET sampling expedition (from August 5th to October 27th 2005). Report No R1126, INRS-ETE, Québec (Qc): vi + 79 p.
Simard, A., M.E. Rail, and Y. Gratton. 2010c. Distribution of temperature and salinity in the Canadian Arctic Archipelago during the 2006 ARCTICNET sampling expedition (from August 22nd to November 9th 2006). Report No R1127, INRS-ETE, Québec (Qc): vi + 79 p.
Stewart, D.B., and Lockhart, W.L. 2005. An overview of the Hudson Bay marine ecosystem. Can. Tech. Rep. Fish. Aquat. Sci. 2586: vi + 487 p.
Visbeck, M. 2002. Deep velocity profiling using lowered acoustic Doppler current profilers: Bottom track and inverse solutions, J Atmos Ocean Tech, 19(5), 794-807.
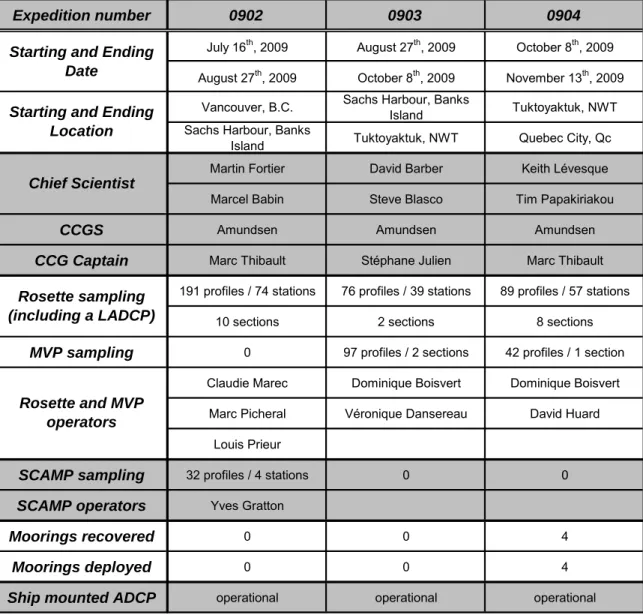
TABLE 1. Summary of the three 2009 ArcticNet expedition.
Expedition number 0902 0903 0904
July 16th, 2009 August 27th, 2009 October 8th, 2009
August 27th, 2009 October 8th, 2009 November 13th, 2009
Vancouver, B.C. Sachs Harbour, Banks
Island Tuktoyaktuk, NWT
Sachs Harbour, Banks
Island Tuktoyaktuk, NWT Quebec City, Qc
Martin Fortier David Barber Keith Lévesque
Marcel Babin Steve Blasco Tim Papakiriakou
CCGS Amundsen Amundsen Amundsen
CCG Captain Marc Thibault Stéphane Julien Marc Thibault 191 profiles / 74 stations 76 profiles / 39 stations 89 profiles / 57 stations
10 sections 2 sections 8 sections
MVP sampling 0 97 profiles / 2 sections 42 profiles / 1 section
Claudie Marec Dominique Boisvert Dominique Boisvert
Marc Picheral Véronique Dansereau David Huard
Louis Prieur
SCAMP sampling 32 profiles / 4 stations 0 0
SCAMP operators Yves Gratton
Moorings recovered 0 0 4
Moorings deployed 0 0 4
Ship mounted ADCP operational operational operational
Starting and Ending Date
Starting and Ending Location Rosette and MVP operators Chief Scientist Rosette sampling (including a LADCP)
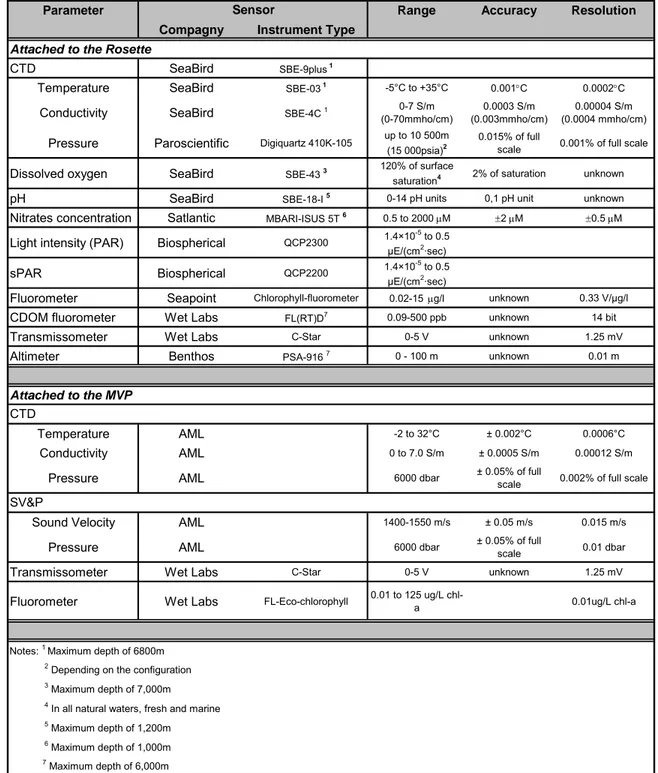
TABLE 2. Characteristics of Rosette and MVP sensors used during ArcticNet 2009
sampling expedition.
Parameter Range Accuracy Resolution
Compagny Instrument Type
CTD SeaBird SBE-9plus 1
Temperature SeaBird SBE-03 1 -5°C to +35°C 0.001C 0.0002C
Conductivity SeaBird SBE-4C 1 0-7 S/m
(0-70mmho/cm)
0.0003 S/m (0.003mmho/cm)
0.00004 S/m (0.0004 mmho/cm)
Pressure Paroscientific Digiquartz 410K-105 up to 10 500m (15 000psia)2
0.015% of full
scale 0.001% of full scale
Dissolved oxygen SeaBird SBE-43 3 120% of surface
saturation4 2% of saturation unknown
pH SeaBird SBE-18-I 5 0-14 pH units 0,1 pH unit unknown
Nitrates concentration Satlantic MBARI-ISUS 5T 6 0.5 to 2000 M 2 M 0.5 M
Light intensity (PAR) Biospherical QCP2300 1.4×10⁻⁵ to 0.5
μE/(cm2·sec)
sPAR Biospherical QCP2200 1.4×10⁻⁵ to 0.5
μE/(cm2·sec)
Fluorometer Seapoint Chlorophyll-fluorometer 0.02-15 g/l unknown 0.33 V/μg/l
CDOM fluorometer Wet Labs FL(RT)D7 0.09-500 ppb unknown 14 bit
Transmissometer Wet Labs C-Star 0-5 V unknown 1.25 mV
Altimeter Benthos PSA-916 7 0 - 100 m unknown 0.01 m
Temperature AML -2 to 32°C ± 0.002°C 0.0006°C
Conductivity AML 0 to 7.0 S/m ± 0.0005 S/m 0.00012 S/m
Pressure AML 6000 dbar ± 0.05% of full
scale 0.002% of full scale
Sound Velocity AML 1400-1550 m/s ± 0.05 m/s 0.015 m/s
Pressure AML 6000 dbar ± 0.05% of full
scale 0.01 dbar
Transmissometer Wet Labs C-Star 0-5 V unknown 1.25 mV
Fluorometer Wet Labs FL-Eco-chlorophyll 0.01 to 125 ug/L chl-a 0.01ug/L chl-a
CTD
SV&P
Sensor
Notes: 1 Maximum depth of 6800m 2 Depending on the configuration
7 Maximum depth of 6,000m
Attached to the MVP Attached to the Rosette
3 Maximum depth of 7,000m 4 In all natural waters, fresh and marine 5 Maximum depth of 1,200m 6 Maximum depth of 1,000m
TABLE 3. Specifications of instruments moored in 2008.
Parameters Range Resolution Accuracy
Current speed 2.5 to 250 cm/sec ± 1 cm/sec
Current direction 0.35o ± 7.5o / ± 5o
Temperature -2.46°C to 21.48°C 0.1% of selected Range ± 0.05°C
Conductivity 0 to 77 mmho/cm 0.1% of Range ± 0.025 mmho/cm
Current speed 2 to 250 cm/sec ± 1 cm/sec
Current direction 0.35o ± 7.5o / ± 5o
Temperature -2.46°C to 5.62°C 0.1% of selected Range ± 0.05°C
Conductivity 0 to 74 mmho/cm 0.1% of Range ± 0.025 mmho/cm
Current speed 0-300 cm/s 0.3 cm/s ± 1% of reading
Current direction 0.35° ± 7.5o / ± 5o
Temperature -3.01 to 5.92 °C 0.1% of Range ± 0.05°C
Conductivity 24 to 38 mS/cm 0.002 mS/cm ± 0.05 mS/cm
Pressure 0 to 20 Mpa 0.1% of Range ± 0.25% Range
Turbidity 0 to 20 NTU 0.1% of full scale 2% of full scale
Oxygen 0 to 500µM <1 µM <8µM
Conductivity 0 to 60 mS/cm 0.001 mS/cm ±0.05 mS/cm
Temperature -5 to 40°C 0.001°C ±0.05°C
ALW Luminosity 0-5000 µmol/s/m² 0.1µmol/s/m² ±1%
Temperature -5 to 40 °C 0.001°C ±0.05°C
Chlorophyll 0-400 ppb 0.01 ppb ±1%
Turbidity 0-1000 NTU 0.03 NTU ±2%
Conductivity 0-85mS/cm ~1μS/cm ±0.003 mS/cm
Temperature -5˚C to 35˚C <0.00005˚C ±0.002˚C
Pressure 0-2000 dbar <0.001% full scale ±0.05% full scale
Turbidity 0 to 2,500 NTU - ±2% of value
Oxygen 0-200% - ±2% Temperature -4 to 40 °C 0.01°C 0.1°C Pressure 200 dbar <0.005% 0.5% Velocity ±5m/s - 1% ±0.5cm/s Direction 0.1° 2° Temperature -5°C to 35°C 0.0002°C 0.001°C Conductivity 0-70 mS/cm 0.0004 mS/cm 0.003 mS/cm
Pressure 0 to 10 500 m 0.001% of full scale 0.015% of full scale
Temperature -5 to 35°C 0.001°C 0.01°C
Pressure Tide 0 to 270 m 0.2 mm / 0.01 mm 0.01% of full Range
Pressure Wave 0 to 270 m 0.4 mm / 0.1 mm 0.01% of full Range
Conductivity 0 to 70 mS/cm 0.0001 mS/cm 0.003 mS/cm
Temperature -5 to 35°C 0.0001°C 0.002°C
Pressure 0 to 7000 m 0.002% of full Range 0.1% of full Range
SBE37 Sea-Bird Electro nics In c. A qu a dop p N ortek In c. CTD 911+ SBE-26 ACTW ACLW R ocklan d O ceano grap hic S ervices Inc. X R -420 RBR RC M -4 RC M -7 RCM-11 Aan deraa Dat a Inst rum ent s
TABLE 4. Summary of the instruments moored in 2008 and recovered in 2009.
Mooring Water
depth Position Instrument Serial No Instr. Depth (m)
Date of first reliable data
Date of last reliable data T (°C) Cond (mS/cm) Press (dbar) Spd (m/s) Dir (true) Turb (FTU) Oxy (uM) Chl Luminosity (µmol/m²s)
Comments on data quality. For more details read the report.
ALW 69 54 2008-07-26 02:00 2009-10-10 15:00 ACLW 888 54 2008-07-26 02:00 2009-10-09 16:00 RBR 10419 57 2008-07-26 02:00 2009-10-09 16:10 RBR 10424 87 RCM11 272 178 2008-07-26 01:58 2009-10-09 15:46 CA05MMP-08 235 71° 24.6948' N 127° 38.6778' W MMP 12138-06 65-155 ACTW 145 56 2008-07-28 03:00 2009-08-31 08:00 ACTW 152 67 2008-07-28 04:00 2009-09-05 18:00 RBR 10422 88 2008-07-29 01:00 2009-10-01 01:00 Aquadopp 2780 223 2008-07-29 01:00 2009-10-12 16:00 RBR 13201 230 2008-07-29 01:00 2009-10-01 00:58 Aquadopp 2758 301 2008-07-29 01:00 2009-10-12 16:00 CA16MMP-07 353 71° 45.1516' N 126° 30.4832' W MMP 12138-08 65-200 Never recovered 71° 04.8843' N 133° 37.7787' W 307 CA04-08 No usable data CA18-08 540 70° 39.8911' N 122° 59.6529' W Never recovered No usable data CA16-08 314 71° 47.2067' N 126° 29.8168' W CA05-08 204 71° 18.7468' N 127° 34.9424' W No usable data
TABLE 5. Content of the ASCII Rosette-CTD data files.
Parameters Units Number of
significant digits
Pressure (or depth) dbars 2
Temperature C (ITS-90) 3
Transmissivity % 2
Fluorescence μg/l 2
Salinity PSS (1978) 3
Density, (S,T,P) kg/m3 2
Specific volume anomaly 10-8 m3/kg 0 N2: Brunt-Väisälä frequency 1/sec2 2 Density; (S,T,O) kg/m3 3 Potential temperature (θ) C 3 θ; Sθ,O) kg/m 3 3 Freezing temperature C 2
Dissolved oxygen concentration ml/l 4
pH no units 3
Nitrates mmol/m3 2
PAR pressure dbars 2
PAR μEinsteins/m2/sec 3
Surface PAR μEinsteins/m2/sec 3
TABLE 6. Maximum and minimum values used to draw salinity and temperature
contour plots from the Rosette-CTD and the MVP data (Appendices 5, 6 and 7). Values were fixed for all sections of a same expedition regardless of the instrument used.
Leg Expedition
Number Number Minimum Maximum Minimum Maximum
2 0902 19 35 -2 6
3 0903 23 35 -2 4
4 0904 27 35 -2 3
APPENDIX 1. High resolution maps of Arctic areas where Rosette-CTD, MVP, SCAMP
and moorings data were collected.
1A. Rosette-CTD sampling sites in Beaufort Sea, Northwest Passage, Baffin Bay and Labrador fjords (Legs 2, 3 and 4).
1B. MVP sampling sites in Beaufort Sea (Legs 3 and 4).
1C. SCAMP sampling sites in Beaufort Sea (Leg 2).
Beaufort Sea (Leg 2 - 0902)
Beaufort Sea (Leg 3 - 0903)
APPENDIX 1A. Location of the Rosette-CTD sampling sites during the 2009
Beaufort Sea (Leg 4 - 0904)
Northwest Passage (Leg 4 - 0904)
APPENDIX 1A. Location of the Rosette-CTD sampling sites during the 2009
Northern Baffin Bay (Leg 4 - 0904)
Labrador fjords (Leg 4 - 0904)
APPENDIX 1A. Location of the Rosette-CTD sampling sites during the 2009
Beaufort Sea (Leg 3 - 0903)
Beaufort Sea (Leg 2 - 0902)
Beaufort Sea (2008-2009)
Beaufort Sea (2009-2010)
APPENDIX 1D. Moorings deployed (and recovered) from the CCGS Amundsen in the
Beaufort Sea. As for the 2007-2008 sampling year, there were two different lines deployed on station CA05 and CA16. The second line was used for a single instrument
Hudson Bay (2009-2010)
APPENDIX 1D. Moorings deployed in the Hudson Bay from the CCGS Pierre Radisson
APPENDIX 2. Rosette-CTD logs, they included cast locations, sampling time, water
depth and corresponding station or mooring numbers during 2009 ArcticNet scientific expedition.
2A. Rosette logbook for Leg 2 (expedition 0902)
2B. Rosette logbook for Leg 3 (expedition 0903)
APPENDIX 2A. Rosette cast locations, sampling time, water depth and corresponding
stations or mooring numbers during ArcticNet expedition 0902 (page 1/4).
Cast number Station or mooring Start date UTC Start time UTC Latitude (North) Longitude (West) Sea bottom depth (m) Cast depth (m) 001 1 (B) 2009-07-18 11:50 70º 28.81 135º 06.62 62 51 002 1 (B) 2009-07-18 12:06 70º 28.81 135º 07.04 62 51 003 2 (B) 2009-07-19 00:26 70º 39.35 135º 38.27 148 140 004 11 (B) 2009-07-19 06:22 70º 44.15 135º 33.65 363 101 005 11 (B) 2009-07-19 08:21 70º 44.27 135º 32.21 363 355 006 3 (B) 2009-07-19 12:54 70º 42.34 135º 48.13 400 392 007 14 (B) 2009-07-20 00:26 70º 34.83 135º 57.25 94 85 008 15 (B) 2009-07-20 06:19 70º 39.27 135º 55.88 294 286 009 17 (B) 2009-07-20 12:51 70º 36.59 136º 28.45 730 715 010 4 (B) 2009-07-21 02:34 70º 45.76 136º 01.26 688 665 011 10 (B) 2009-07-21 12:46 70º 47.24 135º 31.72 432 416 012 I (09) 2009-07-21 21:47 70º 48.90 134º 32.99 73 65 013 23 (B) 2009-07-22 00:52 70º 53.82 134º 16.05 82 75 014 22 (B) 2009-07-22 07:41 70º 49.10 134º 30.61 72 62 015 21 (B) 2009-07-22 16:29 71º 01.11 134º 37.95 337 331 016 18 (B) 2009-07-23 01:07 70º 52.50 135º 21.43 495 480 017 08 (B) 2009-07-23 07:42 70º 55.22 135º 51.82 782 767 018 20 (B) 2009-07-23 15:54 71º 00.94 135º 20.74 645 642 019 16 (B) 2009-07-24 14:15 70º 47.69 136º 39.45 1084 991 020 6 (B) 2009-07-25 06:57 70º 56.16 136º 25.77 1024 988 021 7 (B) 2009-07-25 14:19 70º 59.31 136º 07.71 1018 988 022 M (09) 2009-07-26 02:47 70º 44.23 135º 55.10 583 564 023 13 (B) 2009-07-27 03:55 70º 30.00 135º 40.00 66 60 024 12 (B) 2009-07-27 14:11 70º 38.39 135º 06.01 61 50 025 390 2009-07-31 21:08 70º 10.81 133º 33.83 58 45 026 390 2009-07-31 23:06 70º 10.51 133º 34.01 43 38 027 390 2009-08-01 00:31 70º 10.69 133º 34.73 43 36 028 689 2009-08-01 12:28 69º 29.27 137º 56.67 52 46 029 690 2009-08-01 15:11 69º 29.05 137º 55.99 51 46 030 690 2009-08-01 16:50 69º 28.30 137º 57.26 53 48 031 690 2009-08-01 20:21 69º 29.13 137º 56.33 55 46 032 680 2009-08-02 16:46 69º 36.46 138º 12.47 120 115 033 680 2009-08-02 19:14 69º 36.42 138º 13.32 122 115 035 680 2009-08-02 20:59 69º 36.60 138º 13.20 124 115 036 680 2009-08-02 22:51 69º 36.57 138º 14.26 124 101 037 394 2009-08-03 20:29 69º 50.83 133º 29.52 14 10 038 394 2009-08-03 22:47 69º 50.91 133º 29.86 14 10 039 290 2009-08-04 12:21 70º 40.34 130º 26.06 32 28 040 280 2009-08-04 14:56 70º 52.17 130º 30.41 38 33 041 280 2009-08-04 16:28 70º 52.26 130º 30.42 42 38 042 280 2009-08-04 18:13 70º 52.84 130º 31.71 42 37 043 270 2009-08-04 19:51 71º 04.41 130º 32.85 50 43 044 260 2009-08-04 22:06 71º 16.00 130º 36.51 58 50 045 260 2009-08-05 00:00 71º 16.00 130º 36.00 59 50 046 250 2009-08-05 04:20 71º 28.31 130º 41.75 219 210 047 240 2009-08-05 06:20 71º 40.37 130º 44.47 460 450 048 230 2009-08-05 08:03 71º 51.95 130º 50.27 702 684 049 220 2009-08-05 10:15 72º 03.49 130º 53.53 890 871 050 220 2009-08-05 14:11 72º 02.74 130º 49.51 834 400
APPENDIX 2A. Rosette cast locations, sampling time, water depth and corresponding
stations or mooring numbers during ArcticNet expedition 0902 (page 2/4).
Cast number Station or mooring Start date UTC Start time UTC Latitude (North) Longitude (West) Sea bottom depth (m) Cast depth (m) 051 220 2009-08-05 15:48 72º 03.22 130º 52.62 880 200 052 220 2009-08-05 17:28 72º 02.98 130º 56.69 911 225 053 240 2009-08-05 22:17 71º 40.29 130º 43.67 465 200 054 240 2009-08-06 00:31 71º 40.31 130º 44.19 459 395 055 110 2009-08-06 11:09 71º 42.06 126º 28.90 400 386 056 110 2009-08-06 13:38 71º 41.84 126º 28.70 399 300 057 110 2009-08-06 15:23 71º 42.05 126º 28.78 397 250 058 110 2009-08-06 18:05 71º 41.83 126º 28.68 395 300 059 120 2009-08-06 22:58 71º 33.88 126º 54.55 419 410 060 130 2009-08-07 00:51 71º 25.63 127º 21.97 311 250 061 130 2009-08-07 03:27 71º 25.44 127º 21.41 313 250 062 140 2009-08-07 09:05 71º 17.04 127º 47.42 148 140 063 150 2009-08-07 11:17 71º 09.66 128º 09.64 66 60 064 160 2009-08-07 12:39 71º 03.03 128º 29.82 43 40 065 170 2009-08-07 14:35 70º 54.83 128º 55.09 35 30 066 170 2009-08-07 16:12 70º 54.92 128º 55.43 35 30 067 170 2009-08-07 17:38 70º 55.04 128º 55.14 35 30 068 150 2009-08-07 22:57 71º 09.74 128º 09.59 66 62 069 150 2009-08-08 01:09 71º 09.66 128º 09.60 66 60 070 390 2009-08-08 11:37 70º 10.65 133º 33.59 44 40 071 380 2009-08-08 13:10 70º 23.78 133º 36.55 63 57 072 380 2009-08-08 14:48 70º 23.77 133º 35.98 63 56 073 380 2009-08-08 16:12 70º 23.56 133º 35.72 62 55 074 370 2009-08-08 19:13 70º 35.92 133º 39.00 70 65 075 360 2009-08-08 21:58 70º 48.03 133º 43.83 75 70 076 360 2009-08-08 23:36 70º 48.14 133º 43.94 74 70 077 350 2009-08-09 04:24 70º 58.29 133º 44.04 90 85 078 340 2009-08-09 06:22 71º 10.38 133º 50.04 575 564 079 330 2009-08-09 08:05 71º 22.39 133º 53.50 1080 1000 080 320 2009-08-09 10:13 71º 34.30 133º 56.23 1159 989 081 310 2009-08-09 12:36 71º 44.53 133º 57.05 1614 988 082 320 2009-08-09 15:00 71º 34.33 133º 56.89 1160 300 083 320 2009-08-09 16:57 71º 33.83 133º 57.22 1141 300 084 320 2009-08-09 19:03 71º 33.80 133º 57.24 1115 300 085 330 2009-08-09 21:31 71º 22.24 133º 53.23 1070 300 086 340 2009-08-09 23:45 71º 10.31 133º 49.50 562 300 087 340 2009-08-10 02:08 71º 10.06 133º 50.18 553 300 088 680 2009-08-10 16:44 69º 36.35 138º 14.10 125 120 089 670 2009-08-10 19:22 69º 47.85 138º 26.24 174 167 090 670 2009-08-10 21:00 69º 47.98 138º 26.15 174 167 091 670 2009-08-10 22:55 69º 47.83 138º 25.67 173 165 092 660 2009-08-11 01:00 69º 59.08 138º 39.09 268 260 093 660 2009-08-11 03:14 69º 58.23 138º 38.24 260 250 094 650 2009-08-11 05:37 70º 10.12 138º 54.51 374 368 095 640 2009-08-11 07:35 70º 20.42 139º 08.78 564 558 096 630 2009-08-11 09:11 70º 32.01 139º 22.78 839 826 097 620 2009-08-11 11:08 70º 42.21 139º 36.52 1736 1684 098 610 2009-08-11 14:27 70º 47.69 139º 36.18 1823 1780 099 620 2009-08-11 18:43 70º 40.88 139º 37.29 1740 300 100 620 2009-08-11 20:56 70º 40.10 139º 39.43 1740 300
APPENDIX 2A. Rosette cast locations, sampling time, water depth and corresponding
stations or mooring numbers during ArcticNet expedition 0902 (page 3/4).
Cast number Station or mooring Start date UTC Start time UTC Latitude (North) Longitude (West) Sea bottom depth (m) Cast depth (m) 101 620 2009-08-11 22:49 70º 40.42 139º 37.96 1538 300 102 630 2009-08-12 00:53 70º 31.88 139º 22.47 840 300 103 640 2009-08-12 02:50 70º 20.35 139º 08.23 573 300 105 760 2009-08-12 13:49 70º 33.24 140º 47.86 579 565 106 760 2009-08-12 15:21 70º 33.25 140º 47.78 560 300 107 760 2009-08-12 16:50 70º 32.83 140º 47.62 566 300 108 760 2009-08-12 19:11 70º 32.38 140º 47.08 566 300 109 770 2009-08-12 23:03 70º 20.93 140º 48.40 223 215 110 780 2009-08-13 01:58 70º 09.21 140º 48.35 49 45 111 780 2009-08-13 03:38 70º 09.22 140º 48.04 50 45 112 345 2009-08-14 16:26 71º 19.80 132º 33.80 479 460 113 345 2009-08-14 18:19 71º 20.50 132º 35.53 502 500 114 345 2009-08-14 20:27 71º 20.95 132º 36.39 517 500 115 345 2009-08-14 22:25 71º 21.26 132º 36.52 530 500 116 345 2009-08-15 00:23 71º 21.16 132º 37.29 519 500 117 345 2009-08-15 02:19 71º 21.28 132º 37.03 529 500 118 345 2009-08-15 04:20 71º 21.15 132º 36.61 524 495 119 345 2009-08-15 06:21 71º 21.62 132º 36.64 536 500 120 345 2009-08-15 08:17 71º 21.83 132º 36.46 539 500 121 345 2009-08-15 10:23 71º 21.11 132º 35.12 519 494 122 345 2009-08-15 12:20 71º 21.39 132º 34.92 525 500 123 345 2009-08-15 14:24 71º 22.03 132º 41.24 559 500 124 345 2009-08-15 16:23 71º 22.88 132º 43.48 612 300 125 345 2009-08-15 18:19 71º 23.56 132º 39.80 602 500 126 345 2009-08-15 20:18 71º 24.54 132º 38.32 580 495 127 345 2009-08-15 22:23 71º 25.33 132º 37.09 615 500 128 345 2009-08-16 00:21 71º 25.15 132º 35.52 625 594 129 345 2009-08-16 02:19 71º 24.76 132º 35.01 606 590 130 345 2009-08-16 04:26 71º 26.07 132º 36.31 654 641 131 570 2009-08-17 10:43 70º 12.32 137º 15.33 55 50 132 560 2009-08-17 12:13 70º 23.32 137º 28.61 400 395 133 550 2009-08-17 14:07 70º 34.31 137º 42.63 1076 1064 134 540 2009-08-17 17:18 70º 45.15 137º 53.64 1514 1512 135 540 2009-08-17 20:07 70º 45.30 137º 53.11 1514 300 136 540 2009-08-17 22:06 70º 45.37 137º 52.26 1522 300 137 530 2009-08-18 04:32 70º 56.42 138º 08.79 1602 1597 138 430 2009-08-18 15:00 71º 13.16 136º 42.76 1351 1339 139 430 2009-08-18 17:27 71º 12.21 136º 44.20 1334 300 140 430 2009-08-18 19:29 71º 11.03 136º 44.89 1300 300 141 440 2009-08-19 00:11 71º 02.07 136º 27.67 1149 990 142 450 2009-08-19 02:29 70º 51.31 136º 14.16 840 824 143 470 2009-08-19 06:06 70º 28.32 135º 54.75 62 55 144 480 2009-08-19 07:29 70º 16.69 135º 45.10 56 50 145 460 2009-08-19 13:46 70º 40.62 136º 03.29 468 300 146 460 2009-08-19 15:44 70º 41.03 135º 59.31 434 58 147 460 2009-08-19 16:16 70º 41.01 135º 58.06 420 300 148 460 2009-08-19 18:16 70º 40.91 135º 53.47 362 355 149 135 2009-08-20 18:45 71º 18.62 127º 28.62 231 222 150 135 2009-08-20 20:24 71º 18.74 127º 29.34 230 222
APPENDIX 2A. Rosette cast locations, sampling time, water depth and corresponding
stations or mooring numbers during ArcticNet expedition 0902 (page 4/4).
Cast number Station or mooring Start date UTC Start time UTC Latitude (North) Longitude (West) Sea bottom depth (m) Cast depth (m) 151 135 2009-08-20 22:51 71º 18.63 127º 29.15 228 221 152 135 2009-08-21 00:31 71º 18.56 127º 30.11 223 220 153 135 2009-08-21 02:30 71º 18.68 127º 29.62 230 223 154 135 2009-08-21 04:18 71º 18.79 127º 29.48 231 227 155 135 2009-08-21 06:19 71º 18.71 127º 29.80 228 220 156 135 2009-08-21 08:19 71º 18.60 127º 29.54 227 221 157 135 2009-08-21 10:19 71º 18.66 127º 29.51 230 228 158 135 2009-08-21 12:50 71º 18.46 127º 29.38 227 222 159 135 2009-08-21 14:24 71º 18.41 127º 29.76 224 220 160 135 2009-08-21 16:20 71º 18.60 127º 30.30 222 215 161 135 2009-08-21 18:23 71º 18.69 127º 29.68 227 222 162 135 2009-08-21 20:31 71º 18.81 127º 29.93 227 225 163 135 2009-08-21 22:51 71º 18.54 127º 29.88 225 225 164 235 2009-08-22 08:36 71º 45.87 130º 49.97 619 514 165 235 2009-08-22 10:41 71º 45.63 130º 45.79 567 522 166 235 2009-08-22 12:18 71º 45.77 130º 48.38 599 526 167 235 2009-08-22 14:15 71º 45.94 130º 48.13 598 520 168 235 2009-08-22 16:25 71º 45.76 130º 50.09 617 520 169 235 2009-08-22 18:27 71º 46.11 130º 53.93 666 530 170 235 2009-08-22 20:24 71º 46.02 130º 56.38 681 677 171 235 2009-08-22 22:31 71º 46.54 130º 51.29 637 627 172 235 2009-08-23 00:19 71º 46.63 130º 51.16 640 628 173 235 2009-08-23 02:26 71º 46.47 130º 50.24 626 613 174 235 2009-08-23 04:24 71º 45.98 130º 53.69 670 654 175 235 2009-08-23 06:20 71º 46.19 130º 56.80 686 680 176 235 2009-08-23 08:15 71º 46.48 130º 56.38 687 680 177 235 2009-08-23 10:23 71º 46.08 130º 51.07 626 618 178 235 2009-08-23 12:18 71º 46.08 130º 51.08 629 618 179 235 2009-08-23 14:15 71º 45.86 130º 51.17 634 621 180 235 2009-08-23 16:22 71º 45.61 130º 53.80 657 647 181 235 2009-08-23 18:29 71º 45.23 130º 54.04 650 643 182 235 2009-08-23 20:23 71º 45.29 130º 54.61 655 647 183 235 2009-08-23 22:21 71º 45.03 130º 54.30 652 500 184 235 2009-08-24 00:21 71º 44.55 130º 54.41 633 500 185 235 2009-08-24 02:20 71º 44.80 130º 50.42 611 495 186 235 2009-08-24 04:43 71º 43.65 130º 50.51 576 500 187 235 2009-08-24 06:32 71º 43.88 130º 52.13 597 495 188 235 2009-08-24 08:21 71º 43.93 130º 52.27 600 505 189 235 2009-08-24 10:40 71º 44.20 130º 45.05 547 514 190 235 2009-08-24 12:29 71º 43.08 130º 49.77 560 300 191 235 2009-08-24 14:36 71º 42.73 130º 47.87 593 300
APPENDIX 2B. Rosette cast locations, sampling time, water depth and corresponding
stations or mooring numbers during ArcticNet expedition 0903 (page 1/2).
Cast number Station or mooring Start date UTC Start time UTC Latitude (North) Longitude (West) Sea bottom depth (m) Cast depth (m) 001 S1 2009-08-30 00:09 69º 30.05 137º 59.79 60 54 002 S1 2009-08-30 05:34 69º 29.95 137º 59.70 59 54 003 S1 2009-08-30 07:08 69º 29.94 137º 59.48 58 56 004 S1 2009-08-30 09:06 69º 29.98 137º 58.97 56 54 005 S1.1 2009-08-30 10:40 69º 40.17 138º 09.17 126 120 006 S1.1 2009-08-30 11:57 69º 40.44 138º 09.72 128 123 007 S1.2 2009-08-30 13:25 69º 49.89 138º 19.63 189 181 008 S1.2 2009-08-30 14:35 69º 50.06 138º 20.62 191 100 009 S1.2 2009-08-30 15:42 69º 50.31 138º 21.15 191 10 010 S2 2009-08-30 17:05 70º 00.08 138º 30.31 258 247 011 S2 2009-08-30 20:23 70º 00.52 138º 30.40 260 252 012 S2 2009-08-31 00:13 69º 59.68 138º 29.53 256 248 013 S2 2009-08-31 06:54 70º 01.39 138º 32.94 271 261 014 L1 2009-08-31 20:22 71º 05.53 139º 00.54 1914 1874 015 L1 2009-09-01 02:18 71º 06.35 139º 01.53 1913 1879 016 L1 2009-09-01 15:26 71º 07.38 139º 11.90 1988 1949 017 L1 2009-09-01 21:03 71º 06.37 139º 18.25 2036 018 L1 2009-09-02 01:08 71º 07.60 139º 20.00 2046 019 L1 2009-09-02 09:19 71º 06.27 139º 20.62 2045 2043 020 L1 2009-09-02 13:04 71º 06.80 139º 20.96 2049 2045 021 L1 2009-09-02 17:25 71º 06.22 139º 17.84 2034 2028 022 L2 2009-09-04 00:08 74º 39.16 137º 22.95 3391 023 L2 2009-09-04 06:23 74º 38.67 137º 17.07 3000 989 024 L2 2009-09-04 14:18 74º 35.62 137º 07.34 3000 500 025 L2 2009-09-04 18:31 74º 34.87 137º 03.55 3000 1000 026 L2 2009-09-04 21:30 74º 34.17 136º 54.81 3296 027 L2 2009-09-05 03:35 74º 26.50 136º 28.11 3000 100 028 L2 2009-09-05 04:37 74º 25.96 136º 28.80 3000 39 029 L2 2009-09-05 05:36 74º 25.47 136º 29.59 3000 99 030 L2 2009-09-05 07:24 74º 25.06 136º 29.98 3000 59 031 L2 2009-09-05 08:49 74º 25.92 136º 30.03 3266 032 L3 2009-09-07 14:02 75º 19.54 137º 39.64 3457 033 L3 2009-09-07 21:26 75º 16.78 137º 33.85 3000 200 034 L3 2009-09-08 00:17 75º 16.89 137º 28.59 3501 035 L1.1 2009-09-09 01:00 72º 30.83 136º 35.91 2530 2534 036 L1.1 2009-09-09 10:22 72º 29.54 136º 43.60 2527 1000 037 L1.1 2009-09-09 14:29 72º 30.95 136º 47.40 2533 200 038 L1.1 2009-09-10 02:48 72º 32.21 136º 56.01 2551 2556 039 L1.1 2009-09-10 07:59 72º 32.59 136º 59.25 2554 600 040 L1.1 2009-09-10 09:15 72º 32.55 137º 03.23 2558 600 041 L1.1 2009-09-10 10:10 72º 32.92 137º 04.14 2560 10 042 L1.1 2009-09-10 10:56 72º 33.27 137º 05.60 2560 10 043 L1.1 2009-09-10 16:11 72º 35.27 137º 08.72 2590 2594 044 L1.1 2009-09-10 23:19 72º 37.37 137º 19.63 2626 100 045 L1.1 2009-09-10 23:52 72º 37.65 137º 19.98 2630 85 046 Mapping 1 2009-09-14 09:45 70º 49.03 136º 16.49 745 735 047 Mapping 2 2009-09-14 15:47 70º 50.15 136º 02.89 794 787 048 Mapping 3 2009-09-15 00:08 70º 34.95 135º 38.83 69 61 049 Mapping 4 2009-09-15 04:25 70º 48.77 136º 32.74 1000 971 050 Mapping 5 2009-09-15 15:46 70º 44.39 135º 26.83 269 262
APPENDIX 2B. Rosette cast locations, sampling time, water depth and corresponding
stations or mooring numbers during ArcticNet expedition 0903 (page 2/2).
Cast number Station or mooring Start date UTC Start time UTC Latitude (North) Longitude (West) Sea bottom depth (m) Cast depth (m) 051 USBL 2009-09-15 20:38 70º 44.56 136º 22.77 811 800 052 Mapping 6 2009-09-16 13:20 70º 46.55 136º 06.87 727 717 053 Mooring b 2009-09-16 17:31 70º 39.32 135º 36.59 122 113 054 Mapping 7 2009-09-17 04:30 70º 44.54 136º 21.84 765 742 055 Mapping 8 2009-09-17 21:45 70º 44.59 135º 52.01 559 546 056 Mapping 9 2009-09-20 03:06 70º 47.99 136º 06.05 744 736 057 Mapping 10 2009-09-21 11:38 70º 43.79 136º 16.97 612 609 058 Mapping 11 2009-09-22 02:03 70º 35.56 136º 01.88 190 182 059 Mapping 12 2009-09-22 13:10 70º 33.43 135º 57.46 66 64 060 Mapping 13 2009-09-23 03:02 70º 45.16 136º 38.98 1212 959 061 Mapping 14 2009-09-24 01:50 70º 47.60 135º 33.93 418 413 062 Mapping 15 2009-09-24 13:23 70º 35.64 136º 02.74 194 184 063 Mapping 16 2009-09-25 01:15 70º 38.95 135º 56.72 279 269 064 Mapping 17 2009-09-25 13:03 70º 38.80 136º 10.41 496 486 065 Mapping 18 2009-09-26 00:55 70º 41.27 136º 16.49 594 579 066 Mapping 19 2009-09-26 13:01 70º 44.77 136º 11.80 611 600 067 Mapping 20 2009-09-27 01:11 70º 40.55 136º 02.50 457 457 068 Mapping 21 2009-09-27 16:21 70º 35.41 135º 44.95 74 64 069 Mapping 22 2009-09-27 21:44 70º 40.55 136º 05.88 462 453 070 Mapping 23 2009-09-28 13:04 70º 47.95 136º 11.72 749 743 071 Mapping 24 2009-09-29 01:02 70º 45.46 135º 33.83 387 200 072 Mapping 25 2009-09-29 13:05 70º 33.26 136º 28.79 484 481 073 Mapping 26 2009-10-01 14:28 70º 45.03 136º 38.43 1212 983 074 Mooring A1 2009-10-01 16:24 70º 45.61 136º 00.60 668 661 075 Mooring C 2009-10-03 14:07 70º 35.14 136º 05.51 212 210 076 Mapping 27 2009-10-04 21:32 70º 47.98 136º 18.77 687 680
APPENDIX 2C. Rosette cast locations, sampling time, water depth and corresponding
stations or mooring numbers during ArcticNet expedition 0904 (page 1/2).
Cast number Station or mooring Start date UTC Start time UTC Latitude (North) Longitude (West) Sea bottom depth (m) Cast depth (m) 001 408 2009-10-09 15:39 71º 18.73 127º 34.86 213 197 002 408 2009-10-09 17:27 71º 24.66 127º 38.49 243 228 003 437 2009-10-12 05:04 71º 47.07 126º 29.21 318 308 004 437 2009-10-12 08:00 71º 47.72 126º 29.51 295 287 005 437 2009-10-12 15:32 71º 46.94 126º 29.09 323 314 006 437 2009-10-12 21:53 71º 47.05 126º 29.80 319 309 007 408 2009-10-13 10:07 71º 18.44 127º 35.18 201 194 008 408 2009-10-13 12:39 71º 18.96 127º 35.47 205 198 009 408 2009-10-13 19:16 71º 18.68 127º 34.68 205 200 010 408 2009-10-14 01:50 71º 19.32 127º 35.40 208 200 011 416 2009-10-14 05:51 71º 18.11 127º 44.22 167 159 012 415 2009-10-14 07:00 71º 21.67 127º 33.22 243 231 013 414 2009-10-14 07:48 71º 25.30 127º 21.68 306 295 014 413 2009-10-14 09:12 71º 29.68 127º 08.10 375 365 015 412 2009-10-14 10:11 71º 33.84 126º 55.50 418 408 016 411 2009-10-14 11:52 71º 37.77 126º 42.51 436 427 017 410 2009-10-14 12:57 71º 41.92 126º 29.38 408 399 018 437 2009-10-14 18:48 71º 45.24 126º 30.32 367 357 019 437 2009-10-14 21:10 71º 47.19 126º 29.12 311 303 020 437 2009-10-15 03:13 71º 45.44 126º 31.16 355 351 021 405 2009-10-15 11:32 70º 39.87 122º 59.88 560 555 022 405 2009-10-15 14:09 70º 39.85 122º 59.77 567 557 023 405 2009-10-15 17:07 70º 39.77 123º 00.25 585 571 024 405 2009-10-16 16:31 70º 39.81 123º 03.11 558 549 025 446 2009-10-17 07:27 71º 39.03 119º 41.43 142 133 026 450 2009-10-17 11:05 72º 05.57 119º 47.48 95 86 027 308 2009-10-19 23:17 74º 06.16 108º 49.72 587 536 028 308 2009-10-20 02:48 74º 06.16 108º 49.95 544 535 029 334 2009-10-22 17:00 74º 17.81 102º 44.94 225 217 030 304 2009-10-23 23:20 74º 18.73 091º 20.02 340 330 031 304 2009-10-24 01:56 74º 18.89 091º 22.95 332 324 032 330 2009-10-24 11:38 74º 08.38 087º 51.35 419 413 033 325 2009-10-25 03:40 74º 49.11 080º 29.89 684 672 035 323 2009-10-25 11:21 74º 09.70 080º 30.50 786 777 037 323 2009-10-25 21:30 74º 08.22 080º 38.96 801 793 038 323 2009-10-25 23:36 74º 06.98 080º 40.68 786 779 039 300 2009-10-26 02:08 74º 19.39 080º 31.13 703 688 040 322 2009-10-26 05:24 74º 29.65 080º 36.19 660 624 041 103 2009-10-27 00:44 76º 21.24 076º 32.23 155 149 042 103 2009-10-27 06:03 76º 20.63 076º 35.27 161 157 043 105 2009-10-27 19:05 76º 14.83 075º 50.58 353 343 044 105 2009-10-28 00:35 76º 17.96 075º 44.91 313 310 045 106 2009-10-28 02:37 76º 18.48 075º 21.26 380 375 046 107 2009-10-28 03:39 76º 16.86 074º 59.33 446 433 047 108 2009-10-28 05:03 76º 15.78 074º 36.10 447 441 048 109 2009-10-28 10:18 76º 17.23 074º 06.94 447 444 049 109 2009-10-28 13:14 76º 17.21 074º 08.14 448 438 050 110 2009-10-28 19:12 76º 17.72 073º 37.55 524 518
APPENDIX 2C. Rosette cast locations, sampling time, water depth and corresponding
stations or mooring numbers during ArcticNet expedition 0904 (page 2/2).
Cast number Station or mooring Start date UTC Start time UTC Latitude (North) Longitude (West) Sea bottom depth (m) Cast depth (m) 051 111 2009-10-28 21:14 76º 17.70 073º 12.63 559 548 052 111 2009-10-29 00:26 76º 17.31 073º 14.17 560 557 053 112 2009-10-29 03:44 76º 18.90 072º 42.35 560 552 054 113 2009-10-29 04:57 76º 19.34 072º 13.72 550 546 055 114 2009-10-29 06:40 76º 19.44 071º 46.78 614 604 056 115 2009-10-29 16:01 76º 19.92 071º 11.73 672 665 057 115 2009-10-29 19:04 76º 20.02 071º 11.74 654 648 058 115 2009-10-29 22:53 76º 19.99 071º 14.42 667 661 059 136 2009-10-30 16:29 74º 45.83 073º 26.59 808 808 060 136 2009-10-30 19:21 74º 45.46 073º 33.47 779 775 061 136 2009-10-30 23:19 74º 42.46 073º 24.34 804 799 062 141 2009-11-01 02:00 71º 27.92 070º 02.56 615 603 063 141 2009-11-01 14:28 71º 24.87 070º 15.35 680 672 064 141 2009-11-01 21:14 71º 23.66 070º 08.77 423 417 065 141 2009-11-02 13:43 71º 23.95 070º 09.30 475 466 066 352 2009-11-07 14:13 61º 15.87 064º 44.92 276 067 354 2009-11-07 16:37 61º 00.50 064º 44.27 497 485 068 600 2009-11-08 10:45 59º 05.21 063º 25.75 204 192 069 601 2009-11-08 14:39 59º 02.91 063º 36.21 166 157 070 602 2009-11-09 00:09 59º 03.15 063º 52.31 151 142 071 604 2009-11-09 03:56 58º 59.58 063º 53.70 62 53 072 612 2009-11-09 11:33 58º 28.16 062º 59.06 44 36 073 613 2009-11-09 13:16 58º 28.99 063º 13.19 239 232 074 613 2009-11-09 18:08 58º 29.08 063º 13.08 241 233 075 614 2009-11-09 21:43 58º 24.13 063º 23.40 100 91 076 615 2009-11-09 23:13 58º 19.38 063º 32.49 138 130 077 610 2009-11-10 07:21 58º 31.27 062º 50.41 127 119 078 617 2009-11-10 12:14 58º 30.00 062º 41.21 135 127 079 633 2009-11-11 04:57 57º 36.20 061º 53.49 165 160 080 632 2009-11-11 10:12 57º 34.01 062º 03.40 83 80 081 631 2009-11-11 19:42 57º 29.57 062º 11.64 91 83 082 630 2009-11-11 23:09 57º 28.34 062º 26.52 51 42 083 630 2009-11-12 02:10 57º 28.15 062º 26.38 51 43 084 634 2009-11-12 06:50 57º 34.12 061º 56.41 102 92 085 620 2009-11-12 20:44 56º 23.81 061º 12.98 96 87 086 621 2009-11-13 03:14 56º 24.92 061º 31.08 113 102 087 622 2009-11-13 04:10 56º 24.99 061º 43.92 85 77 088 623 2009-11-13 05:26 56º 26.84 061º 56.41 119 110 089 624 2009-11-13 06:29 56º 25.23 061º 04.36 71 55
APPENDIX 3. List of Rosette sections and their related stations and casts. Some of these
sections have been sampled during previous ArcticNet expeditions. When relevant, the section name as been preserved.
Section Station Cast Section Station Cast Section Station Cast
290 39 S1 1 416 11 280 40 S1.1 5 415 12 270 43 S1.2 7 414 13 260 44 S2 10 413 14 250 46 Stn L1 L1 14 to 21 412 15 240 47 411 16 230 48 410 17 220 49 437 18 110 55 308 27 120 59 334 29 130 61 304 30 140 62 330 32 150 63 323 35 160 64 325 33 170 66 323 35 390 70 300 39 380 71 322 40 370 74 103 41 360 75 105 44 350 77 106 45 340 78 107 46 330 79 108 47 320 80 109 48 310 81 110 50 680 88 111 51 670 89 112 53 660 92 113 54 650 94 114 55 640 95 115 58 630 96 600 68 620 97 601 69 610 98 602 70 780 110 604 71 770 109 615 76 760 105 614 75 Stn 345 345 112 to 130 613 73 570 131 612 72 560 132 610 77 550 133 617 78 540 134 633 79 530 137 634 84 430 138 632 80 440 141 631 81 450 142 630 83 460 145 620 85 470 143 621 86 480 144 622 87 Stn 135 135 149 to 163 624 89 Stn 235 235 164 to 191 Section 600 Section 400 Section 900 Section 850 Section 800 Leg 0902 Section 700 Section 950 Leg 0903 Section 900 Anaktalak fjord Northern Baffin Bay Section 5 Section 400 Eastern North-West Passage Lancaster Leg 0904 Nachvak fjord Saglek fjord Okak fjord
APPENDIX 4. List of the MVP sections and their related casts and metadata.
Transects
of 0903 # of Casts
first and
last cast Date Time Latitude Longitude Bottom (m)
Cast depth (m) 22 September 29th, 2009 02:56 70,675 -135,44 79 51,6 76 September 29th, 2009 05:02 70,433 -136,67 89 60,4 84 October 6th, 2009 03:00 70,568 -135,98 95,4 51,3 107 October 6th, 2009 03:47 70,511 -136,26 71,8 55,7 Transects of 0904 # of Casts first and
last cast Date Time Latitude Longitude Bottom (m)
Cast depth (m) 1 October 16th, 2009 04:10 71,355 -127,29 289,3 72,1 50 October 16th, 2009 09:13 70,945 -124,38 500,1 224,4 Beaufort Sea 100 m talus 48 42 Section 100 23 Beaufort Sea 100 m talus
APPENDIX 5. Sections of salinity and potential temperature from Expedition 0902 (Leg
2). It includes data from the Rosette-CTD and from the MVP. The list of the stations and casts selected for each section is found in Appendices 3 and 4.
The same color scale is used for all sections of this leg regardless of the sensor used. However, it is different from one leg to another. Details are found in Table 6.
5. Location of CTD sections during Expedition 0902
Rosette-CTD sections
5.1 Section 600
5.2 Section 400 (previously sampled in 2003-04-05-06)
5.3 Section 700 (previously sampled in 2002-03-04-06-07)
5.4 Section 900 (previously sampled in 2004)
5.5 Section 950
5.6 Station 345 (parameters evolution over 36 hours)
5.7 Section 850
5.8 Section 800
5.9 Station 135 (parameters evolution over 28 hours)
1
2
3
10
8
6
9
7
4
5
APPENDIX 5. Location of CTD (red) sampling sites during Expedition 0902 (Leg 2). The numbers identify the sections presented as
APPENDIX 5.1. Potential temperature and salinity along section 600. The southern sites
are on the left and the northern sites are on the right.
0 100 200 300 '2 ro 400 ..Q ~ Q) 500 ~ :::l en en Q) ~ 600 0... 700 800 0 100 200 300 '2 ro 400 ..Q ~ Q) 500 ~ :::l en en Q) ~ 600 0... 700 800
ArcticNet
l>Pl>'bC'b)r b )Pr'cr<1'bnrc 50 100Distance (km) from South to North
50 100
Distance (km) from South to North
TCCJ Salinity 35 30 25 20 150
APPENDIX 5.2. Potential temperature and salinity along section 400. The western sites
are on the left and the eastern sites are on the right.
100 ~ 150 ..Q ~ ~ 200 :::l en en Q)
0:
250 300 50 100 ~ 150 ..Q ~ ~ 200 :::l en en Q)0:
250 300 TCCJ 3 2 40 60 80 100Distance (km) fram West ta East
30
25
20
20 40 60 80 100 120
APPENDIX 5.3. Potential temperature and salinity along section 700. The southern sites
are on the left and the northern sites are on the right.
100 200 300 '2 ro 400 ..Q ~ Q) 500 ~ :::l en en Q) ~ 600 0... 700 800 0 100 200 300 '2 ro 400 ..Q ~ Q) 500 ~ :::l en en Q) ~ 600 0... 700 800 20 40
ArcticNet
l>Pl>'bC'b)r b )Pr'cr<1'bnrc 60 80 100 120 140Distance (km) from South to North
40 60 80 100 120 140
Distance (km) from South to North
TCCJ Salinity 35 30 25 20 160
APPENDIX 5.4. Potential temperature and salinity along section 900. The southern sites
are on the left and the northern sites are on the right.
TCCJ 400 '2 600 ro 3 ..Q ~ 800 Q) 2 ~ :::l ~ 1000 Q) ~ 0... 1200 1400 40 60 80 100 120
Distance (km) from South to North
400 600 30 '2 ro ..Q ~ 800 Q) ~ :::l ~ 1000 Q) ~ 25 0... 1200 1400 20 20 40 60 80 100 120 140
APPENDIX 5.5. Potential temperature and salinity along section 950. The southern sites
are on the left and the northern sites are on the right.
100 ~200 ~ ro ..Q ~ ~ 300 :::l en en Q) ~ 0... 400 500
ArcticNet
l>Pl>'bC'b)r b )Pr'cr<1'bnrc 600L----L--~~--~--~~--~--~--~~---L--~ o 5 10 15 20 25 30 35 40Distance (km) from South to North
TCCJ 3 2 Salinity

![[PDF] Support pour débuter avec INKSCAPE étape par étape | Cours Informatique](data:image/gif;base64,R0lGODlhAQABAIAAAP///wAAACH5BAEAAAAALAAAAAABAAEAAAICRAEAOw==)