HAL Id: hal-00330233
https://hal.archives-ouvertes.fr/hal-00330233
Submitted on 7 Mar 2007HAL is a multi-disciplinary open access
archive for the deposit and dissemination of sci-entific research documents, whether they are pub-lished or not. The documents may come from teaching and research institutions in France or abroad, or from public or private research centers.
L’archive ouverte pluridisciplinaire HAL, est destinée au dépôt et à la diffusion de documents scientifiques de niveau recherche, publiés ou non, émanant des établissements d’enseignement et de recherche français ou étrangers, des laboratoires publics ou privés.
Long-term steady state 13C labelling to investigate
carbon turnover in plant soil systems
K. Klumpp, J. F. Soussana, R. Falcimagne
To cite this version:
K. Klumpp, J. F. Soussana, R. Falcimagne. Long-term steady state 13C labelling to investigate carbon turnover in plant soil systems. Biogeosciences Discussions, European Geosciences Union, 2007, 4 (2), pp.797-821. �hal-00330233�
BGD
4, 797–821, 2007 Steady state 13C labelling to investigate soil C turnover K. Klumpp et al. Title Page Abstract Introduction Conclusions References Tables Figures ◭ ◮ ◭ ◮ Back CloseFull Screen / Esc
Printer-friendly Version Interactive Discussion Biogeosciences Discuss., 4, 797–821, 2007
www.biogeosciences-discuss.net/4/797/2007/ © Author(s) 2007. This work is licensed under a Creative Commons License.
Biogeosciences Discussions
Biogeosciences Discussions is the access reviewed discussion forum of Biogeosciences
Long-term steady state
13
C labelling to
investigate carbon turnover in plant soil
systems
K. Klumpp, J. F. Soussana, and R. Falcimagne
INRA, UR874 Grassland Ecosystem Research, Clermont-Ferrand, France
Received: 2 February 2007 – Accepted: 28 February 2007 – Published: 7 March 2007 Correspondence to: K. Klumpp ([email protected])
BGD
4, 797–821, 2007 Steady state 13C labelling to investigate soil C turnover K. Klumpp et al. Title Page Abstract Introduction Conclusions References Tables Figures ◭ ◮ ◭ ◮ Back CloseFull Screen / Esc
Printer-friendly Version Interactive Discussion
Abstract
We have set up a facility allowing steady state 13CO2 labeling of short stature vege-tation (12 m2) for several years. 13C labelling is obtained by scrubbing the CO2 from outdoors air with a self-regenerating molecular sieve and by replacing it with13C de-pleted (−34.7±0.03‰) fossil-fuel derived CO2The facility, which comprises 16 replicate
5
mesocosms, allows tracing the fate of photosynthetic carbon in plant-soil systems in natural light and at outdoors temperature.
This method was applied during 2 yrs to temperate grassland monoliths (0.5×0.5×0.4 m) sampled in a long term grazing experiment. During daytime, the canopy enclosure in each mesocosm was supplied in an open flow (0.67–0.88 volume
10
per minute) with modified air (43% scrubbed air and 57% cooled and humidified am-bient air) at mean CO2 concentration of 425µmol mol−1 and δ
13
C of −21.5±0.27‰. Above and belowground CO2 fluxes were continuously monitored. The difference in
δ13C between the CO2 at the outlet and at the inlet of each canopy enclosure was not significant (−0.35±0.39‰). Due to mixing with outdoors air, the CO2
concentra-15
tion at enclosure inlet followed a seasonal cycle, often found in urban areas, where
δ13C of CO2is lower in winter than in summer. Mature C3grass leaves were sampled monthly in each mesocosm, as well as leave from pot-grown control C4(Paspalum
di-latatum). The meanδ13C of fully labelled C3and C4 leaves reached −41.4±0.67 and −28.7±0.39‰ respectively. On average, the labelling reduced by 12.7‰ the δ13C of C3
20
grass leaves. The isotope mass balance technique was used to calculate the fraction of “new” C in the soil organic matter (SOM) above 0.2 mm. A first order exponential decay model fitted to “old” C data showed that reducing aboveground disturbance by cutting increased from 22 to 31 months the mean residence time of belowground organic C (>0.2 mm) in the top soil.
25
BGD
4, 797–821, 2007 Steady state 13C labelling to investigate soil C turnover K. Klumpp et al. Title Page Abstract Introduction Conclusions References Tables Figures ◭ ◮ ◭ ◮ Back CloseFull Screen / Esc
Printer-friendly Version Interactive Discussion
1 Introduction
About two-thirds of terrestrial C is found belowground and the amount of organic carbon that is stored in the soil (1.5×10¹⁸ g C) is globally about twice that of the total C in atmosphere (Schlesinger, 1997). Below-ground C generally has slower turnover rates than above-ground carbon, as most of the organic carbon in soils (humic substances)
5
is produced by the transformation of plant litter into more persistent organic compounds (Jones and Donelly, 2004).
Carbon sequestration can be determined directly by measuring changes in C pools (Conant et al., 2001) and, or by simulation (e.g. Smith et al., 2005). However, to gain further understanding on C turnover in different soil fractions, the use of radiocarbon
10
tracers and of stable isotopes has proven to be essential (e.g. Trumbore, 2000; Verburg et al., 2004). Isotope techniques, often in combination with other methods (e.g. gas ex-change) stand out among the few tools available to track C fluxes in terrestrial ecosys-tems. Carbon isotopes have been used as tracers including radioactive short lived11C (half time 20.5min) and long lived 14C (5760 yr) (Stevenson, 1986), as well as stable
15
13
C (Balesdent et al. 1988). The natural atmospheric14C activity can be used to date the accumulation of C in fractions with slow turnover time (>50 year). Artificial
atmo-spheric14C activity, such as the “bomb14C” studies, can date shorter lived (>10 years)
C pools from undisturbed soils (e.g. Trumbore, 2000).
Under the Kyoto Protocol (available athttp://www.unfccc.de), biospheric sinks and
20
sources of C can be taken into account in attempts to meet “Quantified Emission Lim-itation or Reduction Commitments” (QELRCs) for the first commitment period (2008– 2012). To better understand how land use and management factors affect carbon turnover in the short-term (<5 yrs), the fate of photosynthates in plant-soil systems
should be traced at this time scale.
25
The development of the13C isotope mass balance technique has allowed to calculate the amount of “new” carbon in soils after shifting cultivation from C3to C4plant species (or conversely from C4to C3) (Balesdent et al., 1988; Conen et al., 2006; Derner et al.,
BGD
4, 797–821, 2007 Steady state 13C labelling to investigate soil C turnover K. Klumpp et al. Title Page Abstract Introduction Conclusions References Tables Figures ◭ ◮ ◭ ◮ Back CloseFull Screen / Esc
Printer-friendly Version Interactive Discussion 2006). However, this method cannot be applied to temperate and high latitude/altitude
ecosystems which lack C4species.
Recently, novel techniques were developed by making use of the13C depleted sig-natures obtained in CO2 enrichment experiments (e.g. Loiseau and Soussana, 1999; Personeni et al., 2004; Trueman and Gonzales-Meler, 2005; Dijkstra et al., 2004).
5
However, this method cannot be used to investigate C cycling under ambient CO2. 13
C pulse-labeling experiments in the field allow detailed studies of the temporal relationships between carbon fixation and its delivery to a defined sink (e.g. exudates, soil biota) (Ostle et al., 2000). However, pulse labeling studies cannot be used to understand multi-year processes as the pulse is diluted over time.
10
To investigate the fate of carbon in plant-soil systems, we have further developed a steady-state13CO2 labeling technique, which has first been used in plant physiology (Del ´eens et al., 1983; Schnyder et al., 1992, 2003). Hence, for the first time, we have been able to change in natural light and at outdoors temperature the13C isotope sig-nature of photosynthates during two and half years, thereby gradually replacing with
15
“new”13C labeled carbon the “old” plant and soil carbon. This method has been ap-plied to the experiment previously described by Klumpp et al. (2007), who reported the role of past and current disturbance level for belowground carbon storage in grassland mesoscoms.
The aim of the present study was: i) to setup a controlled system for continuous long
20
term13CO2labeling which can trace the fate of carbon in soil organic matter fractions; ii) to assess the role of disturbance for below-ground soil carbon turnover in grassland ecosystems.
BGD
4, 797–821, 2007 Steady state 13C labelling to investigate soil C turnover K. Klumpp et al. Title Page Abstract Introduction Conclusions References Tables Figures ◭ ◮ ◭ ◮ Back CloseFull Screen / Esc
Printer-friendly Version Interactive Discussion
2 Materials and methods
2.1 13CO2/ 12
CO2labelling system
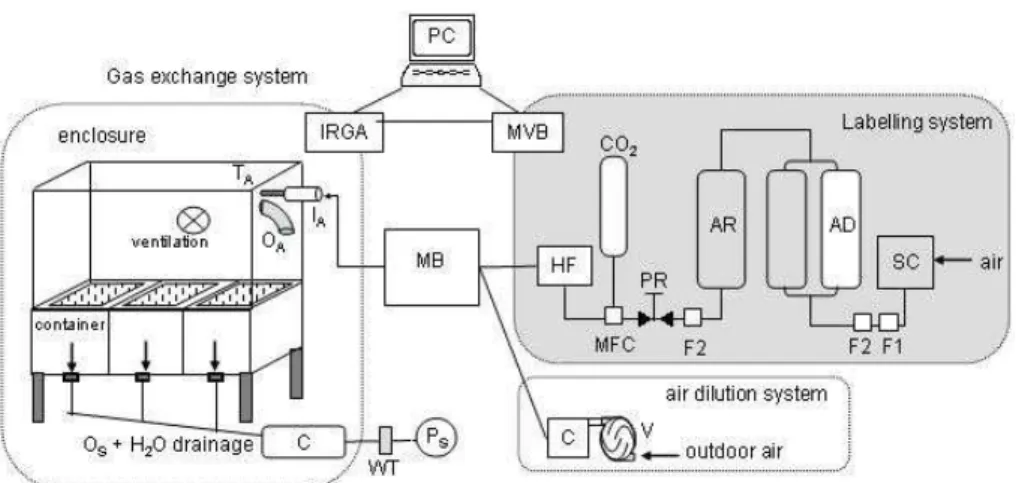
The facility is shown schematically in Fig. 1 and comprises four components: labeling, air dilution, 16 mesocosms and a gas exchange system. Ambient air is compressed, CO2 and H2O of ambient air is scrubbed by passing through a molecular sieve and
5
then replaced by fossil-fuel derived CO2 being depleted in 13C (δ13C−34.7±0.03‰). Thereafter, the13C depleted air is humidified and mixed with ambient temperature reg-ulated air and distributed to canopy enclosures. The main parts of the labeling system are: i) a screw compressor (Air Worthington-Creyssenac, 50AX6, Lyon, France), ii) a self-regenerating adsorption dryer (Schnyder et al., 1992) (KEN 300, Zander, Essen,
10
Germany) which generates CO2 free dry air (residual CO2 below 1µmol CO2 mol−1, pressure dew point −70◦C) at a rate of up to 5000 standard liters per minute (SLPM) regulated by a pressure regulator, iii) an air tank, iv) gas cylinders containing fossil fuel derived CO2 and v) a humidifier (1 m
3
; 1 m2 cross corrugated cellulosic pads, CMF, Varades, France). The flow rates of the labeling system are controlled by pressure
15
regulators and the CO2injection rate by a mass flow meter (Tylan, 0–3 SLPM). To re-generate the molecular sieve, approximately 30% of the CO2 free dry air is diverted to the adsorber chamber. For each of the two adsorber chambers, drying and regenera-tion were alternated during a 6 min cycle. At night time (one hour after sunset until one hour before sunrise), the supply of CO2 free dry air was stopped which allowed for a
20
full regeneration of the labeling system.
The labeling system was coupled to an air dilution system. This allowed to vary the degree of13C labeling by mixing13C depleted air with ambient air in variable pro-portions and to apply the labeling system to continental climate with hot summers (e.g. 38◦C during summer 2003). For air dilution, ambient air was sampled at a height
25
of 3 m by a centrifuge fan at flow rates up to 400 L min−1. Then ambient air passed through a cooler (378 kWh) being automatically regulated by the temperature
differ-BGD
4, 797–821, 2007 Steady state 13C labelling to investigate soil C turnover K. Klumpp et al. Title Page Abstract Introduction Conclusions References Tables Figures ◭ ◮ ◭ ◮ Back CloseFull Screen / Esc
Printer-friendly Version Interactive Discussion ence between enclosure outlets and ambient air. Finally, ambient air and13C-depleted
air were mixed in a 1 m3 metal box (Fig. 1). At the outlet of the mixing box, thermally insulated PVC pipes delivered the air to the 16 canopy enclosures.
2.1.1 Gas exchange measurement system
Each open-flow canopy enclosure (Fig. 1) had an average flow rate between 500 and
5
650 L min−1 during day, which gave with the internal volume of 742 L per enclosure an air exchange rate of 40–50 times per hour and a mean air residence time of 1 min 30 s (Klumpp et al., 2007). During night (one hour after sunset until one hour before sunrise), the flow rate was automatically reduced to 150–250 L min−1to regenerate the molecular sieves of the labeling system. The air flow in each enclosure was monitored
10
continuously by an Averaging Pitot tube connected to a differential pressure gauge (Annubar Rosemount, Dietrich Standard Inc., North, USA).
From start of growing season, in April 2003, the CO2 concentration in enclosures was held from sunrise to sunset at 425±39 µmol mol−1 (mean ± s.d. of 30 min mea-surements, data not shown) by injection of13C depleted CO2(−34.7±0.03‰). During
15
night time, enclosures were provided with ambient air. Following Casella and Sous-sana (1997) and Schapendonk et al. (1997), a fraction of the air flowing through the canopy enclosure of a mesocosms was pumped (KNF, Neuberger, Germany) at a con-stant flow rate (3.5±0.2 L min−1) through the soil column of each monolith. The flow rate though the soil column was adjusted according to preliminary trials (Klumpp et
20
al., 2007). The CO2 concentration between outlet and inlet of each enclosure was measured in differential mode every 20 min for a period of 1 min with an IRGA (LI6262, LICOR Nebraska, USA). Both the ambient air and the inlet air CO2concentrations were measured in absolute mode with a second IRGA (Maihak, UNOR100, Germany). The two IRGAs were calibrated every two weeks with a 480µL CO2L−1standard
(Messer-25
Griesheim, Germany). Soil respiration (Klumpp et al., 2007), soil temperature and air humidity of each enclosure as well as external PAR, temperature and humidity were
BGD
4, 797–821, 2007 Steady state 13C labelling to investigate soil C turnover K. Klumpp et al. Title Page Abstract Introduction Conclusions References Tables Figures ◭ ◮ ◭ ◮ Back CloseFull Screen / Esc
Printer-friendly Version Interactive Discussion monitored every 30 and 40 min, respectively.
2.1.2 Mesocosms
A mesocosm consists of an aboveground canopy enclosure of 0.74 m3 (L 1.8×W 0.55×H 0.75 m) and a belowground compartment of 0.30 m3 (1.5×0.5×0.4 m). The canopy enclosure consists of a metal frame covered with a transparent polyethylene
5
film (60µ). One side in polycarbonate was equipped with two plastic tubes of 20 cm
length and 8cm inner diameter, used as air inlet and outlet (Fig. 1). A temperature sen-sor and a gas sample tube connected to an IRGA through a multi valve block allowed to monitor air temperature and CO2concentration at the outlet.
The belowground compartment consisted of three metal containers, each with a
10
volume of 0.14 m3(0.6×0.6×0.4 m) and a hole at the bottom for drainage water (Fig. 1). Each of these containers contained a grassland monolith (0.5×0.5×0.4 m) framed in a 5 side stainless steel box with drain holes at the bottom. Spaces between monolith and box were airtight sealed. The drainage holes of the three boxes were connected to a 20 L canister (Fig. 1). A pump connected to the canister pumped air continuously
15
through the soil column (see gas exchange measurements). 2.2 Grassland monoliths and management
The grassland (soil, plant community structure) type and procedures to select and ex-tract grassland monoliths were described by Klumpp et al. (2007). Briefly, in June 2002, 56 monoliths (0.5×0.5×0.4 m) were extracted from two semi-natural grassland
20
plots, being subjected to two contrasted sheep grazing treatments during the last 14 years (Louault et al., 2005): one grazing event per year (extensive plot), and 5 graz-ing events per year and one cut (intensive plot). 24 monoliths of each treatment were placed in the 16 mesocosms. The enclosures were placed in natural light and at out-doors temperature and air humidity was adjusted to field conditions. 4 monoliths of
25
wa-BGD
4, 797–821, 2007 Steady state 13C labelling to investigate soil C turnover K. Klumpp et al. Title Page Abstract Introduction Conclusions References Tables Figures ◭ ◮ ◭ ◮ Back CloseFull Screen / Esc
Printer-friendly Version Interactive Discussion tered to provide a soil water potential of approximately 30 kPa.
On five occasions per year the monoliths of the intensive field treatment were cut simultaneously at 5 cm stubble height (high disturbance treatment, H) and artificial urine was applied evenly after each cut in order to simulate N returns at grazing. The remaining monoliths (24 monoliths in enclosures and 4 outdoor controls) sampled in
5
the extensive field treatment were neither cut nor fertilised (low disturbance treatment, L). The harvested phytomass was separated into live and dead plant parts, oven dried and analysed forδ13C.
2.3 Monitoring of13C labeling 2.3.1 Supplied CO2
10
To determine δ13C of CO2 in canopy enclosures, air was sampled every 14 days at enclosure outlets during daytime. Air samples were collected in 10 ml air-tight vials (BD Vacutainer, UK) through a y-branch-connection (equipped with 2 needles) which was inserted in the continuous air flow going to the IRGA. Vials were flushed for 2 min and CO2concentration was measured at the same time. Vials were analyzed forδ
13 C
15
(see13C isotope analyses). 2.3.2 Plant material
To monitor the13C-signature of the aboveground vegetation, last mature green grass leaves were harvested monthly in each enclosure and in outdoor controls. Harvested leaves were oven dried and analyzed for theirδ13C signature.
20
2.3.3 C4control
In April 2004, a pot (∅ 30 cm) with a C4 grass (Paspalum dilatatum) was placed in each enclosure to monitor labeling quality (Loiseau and Soussana, 1999). During the
BGD
4, 797–821, 2007 Steady state 13C labelling to investigate soil C turnover K. Klumpp et al. Title Page Abstract Introduction Conclusions References Tables Figures ◭ ◮ ◭ ◮ Back CloseFull Screen / Esc
Printer-friendly Version Interactive Discussion growing season, young grass leaves were harvested every 3 weeks and analyzed for
theirδ13C content.
2.4 Soil organic matter fractions
Soil harvest and analyses were described by Klumpp et al. (2007). Briefly, soils were sampled once before start of13C labeling and then 5 times during the experiment (in
5
June and September 2003, April and September 2004 and April 2005). At each soil harvest a vertical soil slice (40×6×10 cm) was split into horizontal layers (0–10, 10–20 and 20–30 cm depth) in each mesocosm. The soil layers were air dried and the organic matter (OM) fractions were separated with water by passing through a series of three brass sieves with successive mesh sizes (1.0, 0.2 and 0.05 mm) (wet sieving). The
10
remaining material in each sieve was separated into the organic and mineral fraction by density flotation in water (Loiseau and Soussana, 1999). Organic fractions were oven dried and analyzed forδ13C.
Theδ13C of the total soil organic matter (SOM) above 0.2mm, containing roots, rhi-zomes, coarse (>1 mm) and fine (1 mm>×>0.2 mm) particulate organic matter (POM)
15
and aggregated organic matter (AOM, 0.2 mm>×>0.05 mm) was calculated by
weigh-ing theδ13C signature of each organic fraction by its dry weight. 2.5 13C- samples
2.5.1 13C-isotope analyses
Soil and vegetation samples were oven dried for 48 h at 60◦C, grounded to
homoge-20
nous powder and analyzed for C-content andδ13C by elemental analyzer (EA1110, Carlo Erba, Milano, Italy) coupled (Conflo III) with a mass spectrometer (Delta plus; FinniganMAT, Bremen, Germany). The δ13C in CO2 from outdoors and labelling at-mosphere were measured on a gas chromatography isotope ratio mass spectrometer (Gas system, Fisons, Loughborough, UK).
BGD
4, 797–821, 2007 Steady state 13C labelling to investigate soil C turnover K. Klumpp et al. Title Page Abstract Introduction Conclusions References Tables Figures ◭ ◮ ◭ ◮ Back CloseFull Screen / Esc
Printer-friendly Version Interactive Discussion 2.5.2 13C methods and terminology
Isotope ratios are reported as δ13C values relative to V-PDB standard (‰) and ex-pressed as:
δ13C=[(Rsample−Rstandard)/Rstandard] ∗ 103 (1)
where R is13C/12C ratio of the standard and sample. The discrimination (∆) between
5
product (δ13Csample) and source was:
∆=[(δ13Csource−δ13Csample)/(1000 + δ13Csample)] × 103 (2) Gas samples and solid samples (soil and plant material) were measured against work-ing laboratory standard gases, previously calibrated against IAEA secondary stan-dards. The fraction of “new” C derived from13C-labelling (f Cnew) in soil organic
frac-10
tions was calculated by a mass balance equation:
f Cnew=(δ13Csample−δ13Ccontrol)/(δ13Cinput−δ13Ccontrol) (3) Whereδ13Csample is theδ
13
C of the sample, δ13Ccontrol is theδ 13
C value before start of labelling and δ13Cinput is the δ
13
C value of a fully labelled plant derived material entering the soil (see Results).
15
3 Results and discussion
3.1 System accuracy andδ13C signature 3.1.1 13C labelling
After scrubbing CO2 and H2O from ambient air, the residual CO2 concentration in CO2-free air was below 1 ppm, except for some hours of high outdoor air
tempera-20
ture (>35◦C) during summer 2003 heat wave where residual CO
2concentration could reach 10 ppm (data not shown).
BGD
4, 797–821, 2007 Steady state 13C labelling to investigate soil C turnover K. Klumpp et al. Title Page Abstract Introduction Conclusions References Tables Figures ◭ ◮ ◭ ◮ Back CloseFull Screen / Esc
Printer-friendly Version Interactive Discussion Inlet and outlet δ13C values were compared for enclosures with vegetation during
the experiment (i.e. monthly air sampling at noon) and for enclosures without vegeta-tion. In the latter case, an enclosure was placed on an even solid surface under the same conditions (air flow, natural light and temperature). The comparison resulted in a mean absoluteδ13C-difference between enclosure inlet and outlet of −0.35±0.39‰
5
(P>0.5, repeated measure ANOVA) and −0.19±0.47‰ (P>0.5) for enclosures with and without vegetation, respectively (data not shown). These non significant δ13 C-differences between enclosure inlet and outlet indicated that: i) seasonal variations in
δ13C fractionation processes caused by photosynthesis (e.g. Pataki et al., 2004) were not measurable due to high air flows and ii) enclosures were not causing leaks that
10
could changeδ13C values.
The CO2 concentration delivered by the labelling system reached, on average, 425±5 µmol mol−1 (daily mean, ±s.e.). However, due to mixing with outdoors air, the CO2 concentration at enclosure inlet followed a seasonal cycle often found in urban areas, where due to fossil fuel combustion and lack of plant photosynthesis CO2
con-15
centration is higher in winter than in summer (e.g. Pataki et al., 2004) (Fig. 2a). 13
C fractionation processes during photosynthesis modify instantly theδ13C of CO2 (O’Leary, 1981), thereby the CO2 in the atmosphere surrounding the plants becomes 13
C enriched relative to the CO2at the inlet. In a well-mixed gas exchange enclosure, the13C signature of CO2 sensed by plants during photosynthesis corresponds to the
20
δ13C measured at the enclosure outlet (Evans et al., 1986; Schnyder et al., 2003). In our experiment, the δ13C measured at enclosure outlet indicated 13C depletion in winter and enrichment in summer time (Fig. 2b). This was explained by CO2 mixing with outdoors air, which contributed on average to 57% of the CO2 flux supplied to the enclosures. The CO2 from outdoors air (mean δ
13
C−11.4) had a depleted 13C
25
signature from fossil fuel combustion and plant/soil respiration in winter time and an enriched13C signature from plant photosynthesis in summer and spring time (Pataki et al., 2004). The plant supplied CO2 had on average a δ
13
Coffered of −21.5±0.27‰ during the two growth periods.
BGD
4, 797–821, 2007 Steady state 13C labelling to investigate soil C turnover K. Klumpp et al. Title Page Abstract Introduction Conclusions References Tables Figures ◭ ◮ ◭ ◮ Back CloseFull Screen / Esc
Printer-friendly Version Interactive Discussion Additional to the monthly air sampling, we checked the labelling by calculating (in
30 min time steps) the13C signature of CO2provided to enclosures inlet (δ13Cestimated) with a mass balance equation:
δ13Cestimated=qCO2air· δ 13
Cair+ qCO2inject· δ 13
Cinject+ qCO2decarb· δ 13
Cdecarb
qCO2air+ qCO2inject+ qCO2decarb
whereδ13Cair, δ13Cinject and δ13Cdecarb are the measured δ13C values of CO2 from
5
outdoors air, from CO2 cylinders and from decarbonated air, respectively. qCO2air,
qCO2injectand qCO2decarb are the flow rates of CO2supplied by outdoors air, by CO2 injection from cylinders and by decarbonated air, respectively. qCO2injectwas adjusted to 1.55 standard L min−1 by a mass flow-meter. qCO2airreached 2.01±0.14 standard L min−1 and qCO
2decarb was equal to zero (except during some days above 35◦C in
10
summer 2003).
The δ13Cestimated (Fig. 2c) and the measured δ 13
C at the enclosure outlet did not differ significantly during the time course of the experiment (P>0.1; repeated measure ANOVA, data not shown, absolute δ13C difference of −0.47±0.5‰). Therefore, even during periods without direct δ13C analyses, the labelling intensity was monitored by
15
calculatingδ13Cestimated. The seasonal pattern ofδ13Cestimated, which was close to the monthly measuredδ13C at enclosure outlet (Fig. 2b) also, indicated thatδ13Cestimated was most susceptible to changes inδ13C of outdoor air (δ13Cair). In our experiment theδ13C of outdoors air was in average −11.4‰ due to urban activity and could not be controlled by the experimental set up.
20
3.1.2 Plant material
The C3 grass leaves harvested each month had mean δ 13
C values of −41.4±0.67 and −28.7±0.39‰ for13C-labelled and control monoliths, respectively (Fig. 2d, means of April to November 2004). The C3grass leaves grown in labelled mesocosms were
BGD
4, 797–821, 2007 Steady state 13C labelling to investigate soil C turnover K. Klumpp et al. Title Page Abstract Introduction Conclusions References Tables Figures ◭ ◮ ◭ ◮ Back CloseFull Screen / Esc
Printer-friendly Version Interactive Discussion therefore significantly (P<0.001; repeated measure ANOVA) more depleted in13C than
unlabelled controls grown outdoors. δ13C values of C3 leaves were significantly lower than that of the air surrounding the leaves, indicating the selectivity for 12C (i.e. dis-crimination ∆, O’Leary, 1981) of the carbon fixing enzyme Rubisco. The C4 grass leaves were less depleted (−23.2±0.2‰) than the C3grasses (−41.4±0.7‰) because
5
C3 plants discriminate more against 13
CO2 (∆ 20–28‰) than C4 plants (∆2–15‰) (O’Leary, 1981). The mean discrimination (∆13C) over the experimental period reached 17.0±0.6 and 1.6±0.3‰ for the C3 (April 2003 to April 2005) and C4 (April 2004 to 2005) grasses, respectively. This was irrespective of the disturbance level by cutting in the mesocosms (P>0.1, repeated measure ANOVA, data not shown).
10
Both, labelled (C3 and C4) and unlabelled control leaves showed a small seasonal pattern (Fig. 2d), being isotopically enriched in summer (−40.4±0.3‰ in the second year) and depleted in winter (−49.9±0.1‰) (P<0.001, data not shown), indicating changes in plant metabolism induced by abiotic factors such as water stress, high temperatures and high radiation intensities which decrease stomatal conductance
(Far-15
quhar et al., 1989; Brugnoli and Farquhar, 2000). Interestingly, seasonal changes in
δ13C were similar inside and outside (controls) of the labelled mesocosms (Fig. 2d). Hence, during the experiment, the mean change inδ13C signature of C3grass leaves caused by labelling was equal to −13.6±0.7‰. This shows that the labelling facility generated a fairly constant change in delta13C signature of leaves, despite seasonal
20
variations, occurring in both, outdoors and inside the mesocosms.
The mean δ13C of fully labelled plant shoots reached −41.4‰.Several studies re-ported aδ13C difference of 1–2‰ between roots and shoots in grass plants (Klumpp et al., 2005; Hobbie and Werner, 2004; Schweizer et al., 1999), showing that roots are isotopically enriched compared to shoots. Accordingly, we set theδ13Cinputof “new” C
25
entering the belowground compartment at aδ13C of −40.4‰, which corresponds to a 13
BGD
4, 797–821, 2007 Steady state 13C labelling to investigate soil C turnover K. Klumpp et al. Title Page Abstract Introduction Conclusions References Tables Figures ◭ ◮ ◭ ◮ Back CloseFull Screen / Esc
Printer-friendly Version Interactive Discussion 3.2 Effects of grassland disturbance level on soil carbon turnover
Klumpp et al. (2007) have shown that belowground carbon storage was higher for monoliths previously acclimated for 14 yrs to low disturbance by grazing and cutting. Notably, values for belowground carbon storage calculated from the balance of gas exchanges were consistent with the increment in soil organic carbon content directly
5
measured during the experiment. Moreover, the belowground carbon storage was positively correlated to tissue density and diameter of roots and rhizomes (R=0.50; P<0.05; data not shown). These results confirm that root diameter and root density
are plant functional traits that control the decomposition rate and the mean residence time of carbon in the soil litter continuum (Personeni and Loiseau, 2005)
10
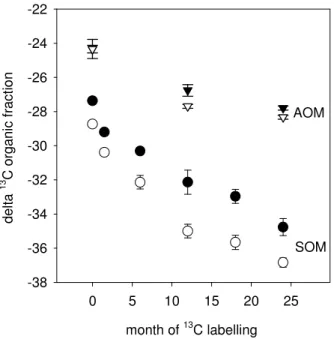
Changes in δ13C values of SOM>0.2 mm (i.e. roots, rhizomes and particulate
or-ganic matter) and of aggregated soil oror-ganic matter (AOM, 0.2>×>0.05 mm) in the top
soil layer (0–10 cm) during the labelling experiment are shown in Fig. 3. Interestingly, initial δ13C values of SOM >0.2 mm were significantly different (P<0.001) between
monoliths adapted to high (−28.7±0.10‰) and to low (−27.4±0.14‰) disturbance.
15
Possible reasons for these differences in isotopic signatures are: i) different decom-position rates of distinct biochemical components of plant litter (Melillo et al., 1989; Agren et al., 1996) and ii) the contribution andδ13C values of different particle sizes (e.g. 1 mm, 0.2 mm) to soil OM (Balesdent et al., 1988; Personeni and Loiseau, 2004). Findings from the same field site, showing a higher cellulose content in the plant
ma-20
terial from the light (low disturbance) compared to heavy (high disturbance) grazing treatments (Picon-Cochard et al., 2004) confirm the role of differences in biochemi-cal components such as cellulose, which is enriched in13C (Schweizer et al., 1999; Gleixner et al., 1993). Moreover, monoliths adapted to high disturbance in the field during the last 14 yrs had a higher fraction of particulate OM (1.0>×>0.2 mm)(P<0.01,
25
data not shown) with a more depletedδ13C value than monoliths adapted to high dis-turbance (data not shown). Personeni and Loiseau (2004) reported more depleted
δ13C values for particulate organic matter fractions of Lolium perenne compared to
BGD
4, 797–821, 2007 Steady state 13C labelling to investigate soil C turnover K. Klumpp et al. Title Page Abstract Introduction Conclusions References Tables Figures ◭ ◮ ◭ ◮ Back CloseFull Screen / Esc
Printer-friendly Version Interactive Discussion
Dactylis glomerata, suggesting that plant community structure also has a large impact
on13C signature of root litter in grasslands (Dijkstra et al., 2004).
During the 24 months of labelling, the gradual δ13C depletion of SOM (>0.2 mm)
and of AOM in the upper most 10 cm (Fig. 3) indicated that the soil litter continuum was steadily filled with “new”13C-depleted carbon (P<0.001). Similar trends were found for
5
the 10–20 cm and 20–30 cm soil depths, where theδ13C also declined towards more 13
C depleted values (P<0.001, data not shown). Both, SOM above 0.2 mm (P<0.001)
and AOM (P<0.05) had less negative δ13C values in monoliths adapted to low com-pared to high disturbance, indicating a higher fraction of “new” (13C depleted) carbon in the high compared to low disturbance treatment (Fig. 3).
10
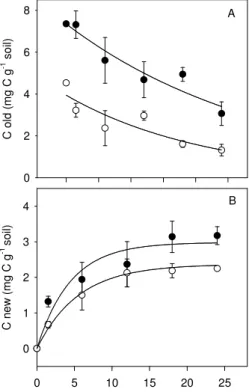
The fate of “old” C (Fold) and the input of “new” C (Fnew) into SOM (>0.2 mm) were
fitted to first order exponential decay (Loiseau and Soussana, 1999; Personeni and Loiseau, 2005) and rise to maximum models, respectively (Fig. 4):
Cold=ae−k.t (4)
Cnew=a′(1−e−k
′.t
) (5)
15
wheret is time in months; a is the initial amount of old C at t=0 (start of the labelling
experiment); a′ is the potential accumulation of “new” C (mg C g−1 soil) in the com-partment. k is the first order decay constant of “old” organic C that leaves the OM
compartment above 0.2 mm. k′ is the rate constant of accumulation of “new” C in the soil in SOM above 0.2 mm. The mean residence time of “old” C (MRTold, months) was
20
calculated as:
MRTold=1/k (6)
The time for half-potential accumulation of “new” C in the SOM above 0.2 mm (MT1/2−new) was calculated as:
MT1/2−new=− ln(1/2)/k′ (7)
BGD
4, 797–821, 2007 Steady state 13C labelling to investigate soil C turnover K. Klumpp et al. Title Page Abstract Introduction Conclusions References Tables Figures ◭ ◮ ◭ ◮ Back CloseFull Screen / Esc
Printer-friendly Version Interactive Discussion
k values of 0.032 and 0.045 were found, giving mean residence time of C of 31.2
and 22.0 months (Fig. 4; Table 1) for low and high disturbance levels, respectively. These values show a fast decay of OM through the breakdown of particulate OM in fractions below 0.2 mm and the respiration and mineralization of part of the root and litter carbon. Since k values were significantly different (P<0.05, data not shown),
5
the decay was slower at low compared to high disturbance level. Low disturbance treatment was dominated by plant species with coarse and dense roots and rhizomes, which are likely to last longer and decompose slower than the fine roots observed at high disturbance level (data not shown).
First order exponential models indicated that the potential accumulation (a′, 3.0 and
10
2.3 mg C g−1soil, at L and H) of “new C” was substantially lower than the initial amount of “old” C at the start of the experiment (a, 7.4 and 4.0 mg C g−1 soil at L and H) (Table 1). Likewise,k′values indicated that half of the potential accumulation of “new” C was reached after 3.5 month in both disturbance levels.
During the experiment, “new” C entered first the roots and rhizomes, before being
15
released in the soil through rhizodeposition (i.e. root exudates, root and rhizome lit-ter). Furthermore, at the low compared to high disturbance level, shoot litter may also contribute to the supply of “new” C to the soil. The “new” C remained in the litter con-tinuum above 0.2 mm until its breakdown into smaller particle sizes and its respiration and mineralization. Another factor contributing to the disappearance of both “old” and
20
“new” carbon is the activity of the soil fauna (macro-decomposers, e.g. earthworms) (Hoope et al., 2000; Seeber et al., 2006), which was able to transport part of the litter to deeper soil layers and which contributed to the breakdown of coarse litter into finer fractions.
Given the short residence time of “old” C (below 36 months), it is likely that a large
25
part of the “new” C which was deposited into the soil compartment vanished into smaller particle sizes (<0.2 mm) before the end of the 2 years of the experiment. This
explains why the potential accumulation of “new” C (a′) was found to be much lower than the initial amount of “old” C (a; Table 1). For the same reason, half the
BGD
4, 797–821, 2007 Steady state 13C labelling to investigate soil C turnover K. Klumpp et al. Title Page Abstract Introduction Conclusions References Tables Figures ◭ ◮ ◭ ◮ Back CloseFull Screen / Esc
Printer-friendly Version Interactive Discussion mum accumulation of “new” C was reached within a few months only, as some “new”
C started to escape the compartment above 0.2 mm after a few months only.
4 Conclusion
These results show the potential of13C steady state labelling for investigating the fate of carbon in the plant-soil continuum. By combining isotope analyses of soil OM
com-5
partments and of soil CO2efflux, a detailed understanding of the fate of carbon can be gained for model ecosystems that can be subjected to contrasted management and en-vironmental treatments. The labelling facility presented here represents a compromise between the costs of the equipment (which scales with the decarbonated air flow) and the intensity and accuracy of the13C labelling (which declines with increasing outdoors
10
air supply). A large array of applications at different time scales can be envisaged, ranging from short-term labelling of plant and soil carbon to long-term labelling of more stable soil OM fractions. The method does not involve the need for continuous mea-surements of the13C signature of the labelling atmosphere, as we have shown that this signature can be calculated with sufficient accuracy.
15
Acknowledgements. We thank H. Schnyder, F. Teyssonneyre and P. Pichon for their scientific
and technical contributions during planning and set up of the labelling facility. We also thank and R. Sch ¨aufele for helpful comments on an earlier version of this manuscript. This work was supported by a Marie Curie Individual Fellowship (EVK2-CT2002-50026) for K. Klumpp and the European GREENGRASS project (EVK2-CT2001-00105) and was part of the “ACI
20
Ecologie Quantitative” (French Ministry of Research and Technology) program: “Interactions entre biodiversit ´e et fonctionnement dans les ´ecosyst `emes terrestres: aspects fondamentaux et appliqu ´es”.
References
Agren, G. I., Bosatta, E., and Balesdent, J.: Isotope discrimination during decomposition of
25
BGD
4, 797–821, 2007 Steady state 13C labelling to investigate soil C turnover K. Klumpp et al. Title Page Abstract Introduction Conclusions References Tables Figures ◭ ◮ ◭ ◮ Back CloseFull Screen / Esc
Printer-friendly Version Interactive Discussion
Balesdent, J., Wagner, G. H., and Mariotti, A.: Soil organic matter turnover in long-term field experiment as revealed by carbon-13 natural abundance, Soil Sci. Soc. Am. J., 52, 118–124, 1988.
Brugnoli, E. and Farquhar, G. D.: Photosynthetic fractionation of carbon isotopes, in: Advances in photosynthesis, Vol 9, Photosynthesis: Physiology and metabolism, edited by: Leegood,
5
R. C., Sharkey, T. D., and von Caemmerer, S., Kluwer Academic Publisher, Dordrecht, The Netherlands, 2000.
Casella, E. E. and Soussana, J. F.: Long-term effects of CO2 and temperature increase on the carbon balance of a temperate grass sward, J. Exp. Bot., 48, 1309–1321, 1997.
Conen, F., Leifeld, J., Seth, B., and Alewell, C.: Warming mineralises young and old carbon
10
equally, Biogeosciences, 3, 515–519, 2006,
http://www.biogeosciences.net/3/515/2006/.
Contant, R. T., Paustian, K., and Elliot, E. T.: Grassland management and can conversion into grassland, Effects on soil carbon, Ecol. App., 11, 343–355. 2001.
Del ´eens, E., Pavlides, D., and Queiroz, O.: Application du trac¸age isotopique naturel par le C13
15
`a la mesure du renouvellement de la mati `ere foliaire chez les plantes en C3, Physiol. Veg., 21, 723–729, 1983.
Derner, J. D., Boutton, T. W., and Briske, D. D.: Grazing and ecosystem carbon storage in the North American Great Plains, Plant and Soil, 280, 77–90, 2006.
Dijkstra, F. A., Hobbie, S. E., Knops, J. M. H., and Reich, P. B.: Nitrogen deposition and plant
20
species interact to influence soil carbon stabilization, Ecol. Letters, 7, 1192–1198, 2004. Evans, J. R., Sharkey, T. D., Berry, J. A., and Farquhar, G. D.: Carbon isotope discrimination
measured concurrently with gas exchange to investigate CO2 diffusion in leaves of higher
plants, Aust. J. Plant Physiol., 13, 281–292, 1986.
Farquhar, G. D., Ehleringer, J. R., and Hubick, K. T.: Carbon isotope discrimination and
photo-25
synthesis, Annu. Rev. Plant Physiol. Mol. Biol., 40, 403–437, 1989.
Gleixner, G., Danier, J., Werner, R. A., and Schmidt, L.: Correlation between the13C content
of primary and secondary products in different cell compartments and that in decomposing basidiomycetes, Plant Physiol., 102, 1287–1290, 1993.
Hobbie, E. A., Johnson, M. G, Rygiewicz, P. T., Tingey, D. T., and Olszyk, D. M.: Isotopic
30
estimates of new carbon inputs into litter and soils in a four-year climate change experiment with Douglas-fir, Plant and Soil, 259, 331–343, 2004.
Hooper, D. U., Bignell, D. E., Brown, V. K., Brussaard, L., Dangerfield, D. M., and Wall, D. H.:
BGD
4, 797–821, 2007 Steady state 13C labelling to investigate soil C turnover K. Klumpp et al. Title Page Abstract Introduction Conclusions References Tables Figures ◭ ◮ ◭ ◮ Back CloseFull Screen / Esc
Printer-friendly Version Interactive Discussion
Interactions between aboveground and belowground biodiversity in terrestrial ecosystems: Patterns, mechanisms, and feedbacks, Bioscience, 50, 1049–1061, 2000.
Jones, M. B. and Donelly, A.: Carbon sequestration in temperate grassland ecosystems and
the influence of management, climate and elevated CO2, New Phytol., 164, 423–439, 2004.
Klumpp, K., Soussana, J. F., and Falcimagne, R.: Effects of past and current
distur-5
bance on carbon cycling in grassland mesocosms, Agric. Ecosyst. Environ., 121, 53–71, doi:10.1016/j.agee.2006.12.005, 2007.
Klumpp, K., Sch ¨aufele, R., L ¨otscher, M., Lattanzi, F. A., Feneis, W., and Schnyder, H.: C-isotope
composition of CO2 respired by shoots and roots: fractionation during dark respiration?,
Plant Cell Environm., 28, 241–250, 2005.
10
Loiseau, P. and Soussana, J. F.: Elevated [CO2], temperature increase and N supply effects on the accumulation of below-ground carbon in a temperate grassland ecosystem, Plant and Soil, 212, 123–134, 1999.
Louault, F., Pillar, V. D., Aufrere, J., Garnier, E., and Soussana, J. F.: Plant traits and function types in response to reduced disturbance in a semi-natural grassland, J. Veg. Sci., 16, 151–
15
160, 2005.
Mellilo, J. M., Aber, J. D., Linkins, A. E., Ricca, A., Fry, B., and Nadelhoffer, K. J.: Carbon and nitrogen dynamics along the decay continuum: plant litter to soil organic matter, Plant and Soil, 115, 189–198, 1989.
O’Leary, M. H.: Carbon isotope fractionation in plants, Phytochemistry, 20, 553–567, 1981.
20
Ostle, N., Ineson, P., Benham, D., and Sleep, D.:Carbon assimilation and turnover in grassland
vegetation using an in situ (CO2)-C-13 pulse labelling system, Rap. Comm. Mass. Spec., 14,
1345–1350, 2000.
Pataki, D. E., Bowling, D. R., and Ehleringer, J. R.: Seasonal cycle of carbon dioxide and its isotopic composition in an urban atmosphere: anthropogenic and biogenic effects, J.
25
Geophys. Res., 108, 1–8, 2004.
Personeni, E. and Loiseau, P.: How does the nature of living and dead roots affect the residence time of carbon in the root litter continuum?, Plant and Soil, 267, 129–141, 2004.
Personeni, E. and Loiseau, P.: Species strategy and N fluxes in grassland soil – A question of root litter quality or rhizosphere activity?, European J. Agr., 22, 217–229, 2005.
30
Picon-Cochard, C., Teyssonneyre, F., Besle, J. M., and Soussana, J. F.: Effects of elevated CO2 and cutting frequency on the productivity and herbage quality of a semi-natural grassland, Europ. J. Agro., 20, 363–377, 2004.
BGD
4, 797–821, 2007 Steady state 13C labelling to investigate soil C turnover K. Klumpp et al. Title Page Abstract Introduction Conclusions References Tables Figures ◭ ◮ ◭ ◮ Back CloseFull Screen / Esc
Printer-friendly Version Interactive Discussion
Schapendonk, A. H. C. M., Dijkstra, P., Groenwold, J., Pot, C. S., and Van de Geijn, S. C.: Carbon balance and water use efficiency of frequently cut Lolium perenne L. Swards at elevated carbon dioxid, Global Change Biol., 3, 207–216, 1997.
Schlesinger, W. H.: Biochemistry: an Analysis of global Change, 2nd eds. Academic Press, San Diego, CA, 1997.
5
Schnyder, H., Sch ¨aufele, R., L ¨otscher, M., and Gebbing, T.: Disentangling CO2 fluxes:
di-rect measurements of mesocosm-scale natural abundance13CO2/12CO2gas exchange,13C
discrimination, and labelling of CO2exchange flux components in controlled environments,
Plant, Cell and Environ., 26, 1863–1874, 2003.
Schnyder, H.: Long-term steady-state labelling of wheat plants by use of natural13CO2/12CO2
10
mixtures in an open, rapidly turned-over system, Planta, 187, 128–135, 1992.
Schweizer, M., Fear, J., and Cadisch, G.: Isotopic (13C) fractionation during plant residue
de-composition and its implication for soil organic matter studies, Rap. Comm. Mass. Spec., 13, 1284–1290, 1999.
Seeber, J., Scheu, S., and Meyer, E.: Effects of macro-decomposers on litter decomposition
15
and soil properties in alpine pastureland: A mesocosm experiment, Appl. Soil Ecol., 34, 168–175, 2006.
Smith, J., Smith, P., Wattenbach, M., Zaehle, S., Hiederer, R., Jones, R. J. A., Montanarella, L., Rounsevell, M. D. A., Reginster, I., and Ewert, F.: Projected changes in mineral soil carbon of European croplands and grasslands, 1990–2080, Global Change Biol., 11, 2141–2152,
20
2005.
Stevenson, F. J.: Cycles of soil; carbon nitrogen, phosphorus, sulphur, micronutrients, John Wiley & Sons, Inc, New York, p. 23–33, 1986.
Trueman, R. J. and Gonzales-Meler, M. A.: Acceleration belowground C cycling in a managed agriforest ecosystem exposed to elevated carbon dioxide concentration, Glob. Chang. Biol.,
25
11, 1258–1271, 2005.
Trumbore, S. E.: Carbon respired by terrestrial ecosystems – recent progress and challenges, Glob. Chang. Biol., 12, 141–153, 2000.
Verburg, P. S. J., Arnone, J. A., Obrist, D., Schorran, D. E., Evans, R. D., Leroux-Swarthout, D., Johnson, D. W., Luo, Y., and Coleman, J. S.: Net ecosystem carbon exchange in two
30
experimental grassland ecosystems, Global Change Biol., 10, 498–508, 2004.
BGD
4, 797–821, 2007 Steady state 13C labelling to investigate soil C turnover K. Klumpp et al. Title Page Abstract Introduction Conclusions References Tables Figures ◭ ◮ ◭ ◮ Back CloseFull Screen / Esc
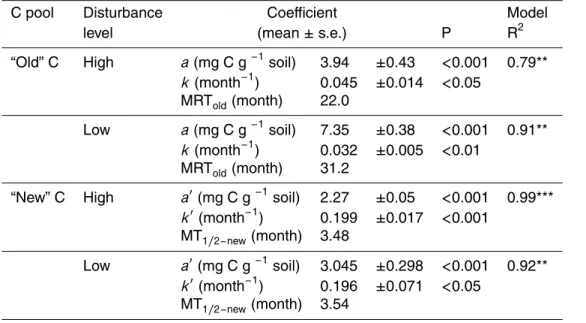
Printer-friendly Version Interactive Discussion Table 1. First order exponential models of “old” C decay and “new” C accumulation in pasture
monoliths adapted to low (L) and high (H) disturbance and continuously labelled with13C. The
fate of “old” C (Cold) and the accumulation of “new” C (Cnew) into SOM (>0.2 mm) in 0–10 cm
soil layer were fitted to first order exponential decay and rise to maximum models, respectively: Cold=a.e−k.t; Cnew=a′.(1 − e−k′.t
), wheret is time in months; a is the initial amount of old C at
t=0 (start of the labelling experiment); a′ is the potential accumulation of “new” C (mg C g−1
soil) in the compartment. k is the first order decay constant of “old” organic C. k′ is the rate
constant of accumulation of “new” C. Mean residence time of “old” C (MRTold, months) was
calculated as: MRTold=1/k; the time for half-potential accumulation of “new” C (MT1/2−new) was
calculated as: MT1/2−new=− ln(1/2)/k′. Results are means of 8 replicates per treatment.
C pool Disturbance Coefficient Model
level (mean ± s.e.) P R2
“Old” C High a (mg C g−1soil) 3.94
±0.43 <0.001 0.79** k (month−1) 0.045 ±0.014 <0.05 MRTold(month) 22.0 Low a (mg C g−1soil) 7.35 ±0.38 <0.001 0.91** k (month−1 ) 0.032 ±0.005 <0.01 MRTold(month) 31.2
“New” C High a′(mg C g−1 soil) 2.27
±0.05 <0.001 0.99*** k′(month−1) 0.199 ±0.017 <0.001 MT1/2−new(month) 3.48 Low a′(mg C g−1 soil) 3.045 ±0.298 <0.001 0.92** k′(month−1) 0.196 ±0.071 <0.05 MT1/2−new(month) 3.54
BGD
4, 797–821, 2007 Steady state 13C labelling to investigate soil C turnover K. Klumpp et al. Title Page Abstract Introduction Conclusions References Tables Figures ◭ ◮ ◭ ◮ Back CloseFull Screen / Esc
Printer-friendly Version Interactive Discussion Fig. 1. Long term steady state 13C labelling facility to investigate carbon turnover in
plant-soil system. SC, Screw compressor (Air Worthington-Creyssenac, 50AX6, Lyon, France); AD, adsorption dryer (KEN300, Zander Essen, Germany, molecular sieve with zeolith, activated
aluminum oxide); AR, air reservoir (1 m3); F1, Oil and water condensate drain; F2, oil-,
water-and particle filter (Zwater-ander, Essen, Germany); PR, pressure regulator; HF, humidificator; C,
tem-perature regulated cooler; IA, inlet aboveground; MFC, mass flow controller 0–5 l min−1 (Tylan
General, Eching Germany); MB, mixing vessel (1 m3); MVB, multi valve block; CO2, cylinder
containing CO2of fossil origin (Messer, Lyon, France); canopy enclosure, cuvette with plastic
film (180×55×75) cm; OA, outlet aboveground; Os outlet soil; IRGA, infrared gas analyzers
(LI6262, LICOR, Nebraska, USA; Maihak, Unor 100, Germany); PC, central control and data
acquisition system; Ps pump for sampling of soil compartment; TA, temperature sensor
above-ground; V, air flow controllable ventilation; WT, water trap.
BGD
4, 797–821, 2007 Steady state 13C labelling to investigate soil C turnover K. Klumpp et al. Title Page Abstract Introduction Conclusions References Tables Figures ◭ ◮ ◭ ◮ Back CloseFull Screen / Esc
Printer-friendly Version Interactive Discussion d e lt a 13 C O2 (p e rm ill ) -35 -30 -25 -20 -15 C O2 ( µ m o l m o l -1) 350 400 450 -24 -22 -20 -18 A B C year 2003 - 2005
Mar Jul Nov Mar Jul Nov Mar -49 -42 -35 -28 -21 labelled C3 labelled C4 control C3 D
measured CO2 at inlet
measured δ 13
C at oulet
estimated δ 13C at oulet
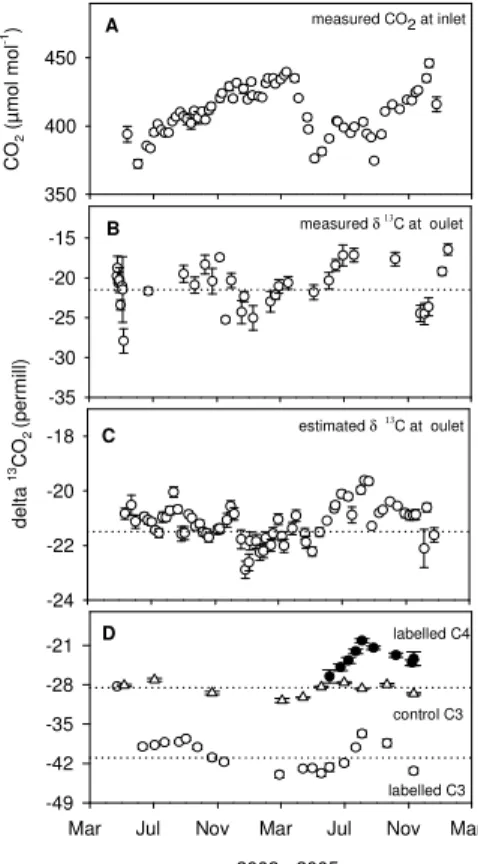
Fig. 2. (A) Measured CO2 concentration at the canopy enclosure inlet, (B) δ13C at canopy
enclosure outlet, (C) estimatedδ13C of CO2supplied to canopy enclosure inlet and (D)δ13C of
labelled C3and C4 (Paspalum dilatatum) grass leaves during experimental period (April 2003
to March 2005) and of unlabelled C3 control grasses grown outdoors. Data are means (±SE)
of 16, 14 and 4 replicates for labelled C3, labelled C4and unlabelled C3controls, respectively.
Dotted lines represent the meanδ13C values of supplied CO2(−21.5‰) (B, C) and of C3leaves
BGD
4, 797–821, 2007 Steady state 13C labelling to investigate soil C turnover K. Klumpp et al. Title Page Abstract Introduction Conclusions References Tables Figures ◭ ◮ ◭ ◮ Back CloseFull Screen / Esc
Printer-friendly Version Interactive Discussion month of 13C labelling 0 5 10 15 20 25 d e lt a 1 3 C o rg a n ic f ra c ti o n -38 -36 -34 -32 -30 -28 -26 -24 -22 AOM SOM
Fig. 3. Changes of theδ13C of total soil organic matter above 0.2 mm (SOM>0.2 mm,
includ-ing roots, rhizomes and particulate organic matter) (circles) and of aggregated organic matter
(AOM, 0.2>×>0.05 mm)(triangles) in the top soil (0–10 cm) during the labelling experiment.
Monoliths exposed to low (solid symbols) and to high (open symbols) field disturbance. Data are means ±SE of 8 replicate mesocosms.
BGD
4, 797–821, 2007 Steady state 13C labelling to investigate soil C turnover K. Klumpp et al. Title Page Abstract Introduction Conclusions References Tables Figures ◭ ◮ ◭ ◮ Back CloseFull Screen / Esc
Printer-friendly Version Interactive Discussion C o ld ( m g C g -1 s o il) 0 2 4 6 8
month after start of 13C labelling 0 5 10 15 20 25 C n e w ( m g C g -1 s o il) 0 1 2 3 4 A B
Fig. 4. Changes in the contents (mg C g−1 dry soil) of “old” (A) and “new” C (B) in the SOM
above 0.2 mm of the top soil (0–10 cm) layer after start of13C labelling for monoliths adapted
for 14 yrs to low (full symbols) and high (open symbols) disturbance in the field. The fate
of “old” C (Fold) and the input of “new” C (Fnew) were fitted to first order exponential decay
and rise to maximum models, respectively: Cold=a.e−k.t; C
new=a′.(1−e−k
′.t
) (abbreviations and coefficients of regression lines see Table 1).