HAL Id: hal-00331068
https://hal.archives-ouvertes.fr/hal-00331068
Submitted on 14 Apr 2004
HAL is a multi-disciplinary open access
archive for the deposit and dissemination of
sci-entific research documents, whether they are
pub-lished or not. The documents may come from
teaching and research institutions in France or
abroad, or from public or private research centers.
L’archive ouverte pluridisciplinaire HAL, est
destinée au dépôt et à la diffusion de documents
scientifiques de niveau recherche, publiés ou non,
émanant des établissements d’enseignement et de
recherche français ou étrangers, des laboratoires
publics ou privés.
multi-spacecraft perspective
J. S. Pickett, S. W. Kahler, L.-J. Chen, R. L. Huff, O. Santolík, Y.
Khotyaintsev, Pierrette Décréau, D. Winningham, R. Frahm, M. L. Goldstein,
et al.
To cite this version:
J. S. Pickett, S. W. Kahler, L.-J. Chen, R. L. Huff, O. Santolík, et al.. Solitary waves observed in the
auroral zone: the Cluster multi-spacecraft perspective. Nonlinear Processes in Geophysics, European
Geosciences Union (EGU), 2004, 11 (2), pp.183-196. �hal-00331068�
SRef-ID: 1607-7946/npg/2004-11-183
Nonlinear Processes
in Geophysics
© European Geosciences Union 2004
Solitary waves observed in the auroral zone: the Cluster
multi-spacecraft perspective
J. S. Pickett1, S. W. Kahler1, L. -J. Chen1, R. L. Huff1, O. Santol´ık2,1, Y. Khotyaintsev3, P. M. E. D´ecr´eau4, D. Winningham5, R. Frahm5, M. L. Goldstein6, G. S. Lakhina7, B. T. Tsurutani8, B. Lavraud9, D. A. Gurnett1, M. Andr´e3, A. Fazakerley10, A. Balogh11, and H. R`eme9
1Department of Physics and Astronomy, The University of Iowa, Iowa City, IA, USA 2Faculty of Mathematics and Physics, Charles University, Prague, Czech Republic 3Swedish Institute of Space Physics, Uppsala Division, Uppsala, Sweden
4LPCE et Universit´e d’Orl´eans, Orl´eans, France 5Southwest Research Institute, San Antonio, TX, USA 6Goddard Space Flight Center, Greenbelt, MD, USA 7Indian Institute of Geomagnetism, Colaba, Mumbai, India
8Jet Propulsion Laboratory, California Institute of Technology, Pasadena, CA, USA 9CESR, 9 ave. du Colonel Roche, 32018 Toulouse C´edex 4, France
10Mullard Space Science Laboratory, University College London, London, UK 11The Blackett Laboratory, Imperial College, London, UK
Received: 2 July 2003 – Revised: 14 January 2004 – Accepted: 16 January 2004 – Published: 14 April 2004 Part of Special Issue “International Workshops on Nonlinear Waves and Chaos in Space Plasmas”
Abstract. We report on recent measurements of solitary
waves made by the Wideband Plasma Wave Receiver located on each of the four Cluster spacecraft at 4.5–6.5 RE (well
above the auroral acceleration region) as they cross field lines that map to the auroral zones. These solitary waves are ob-served in the Wideband data as isolated bipolar and tripo-lar waveforms. Examples of the two types of pulses are provided. The time durations of the majority of both types of solitary waves observed in this region range from about 0.3 up to 5 ms. Their peak-to-peak amplitudes range from about 0.05 up to 20 mV/m, with a few reaching up to almost 70 mV/m. There is essentially no potential change across the bipolar pulses. There appears to be a small, measurable po-tential change, up to 0.5 V, across the tripolar pulses, which is consistent with weak or hybrid double layers. A limited cross-spacecraft correlation study was carried out in order to identify the same solitary wave on more than one space-craft. We found no convincing correlations of the bipolar solitary waves. In the two cases of possible correlation of the tripolar pulses, we found that the solitary waves are propagat-ing at several hundred to a few thousand km/s and that they are possibly evolving (growing, decaying) as they propagate from one spacecraft to the next. Further, they have a perpen-dicular (to the magnetic field) width of 50 km or greater and a parallel width of about 2–5 km. We conclude, in general,
Correspondence to: J. S. Pickett
however, that the Cluster spacecraft at separations along and perpendicular to the local magnetic field direction of tens of km and greater are too large to obtain positive correlations in this region. Looking at the macroscale of the auroral zone at 4.5–6.5 RE, we find that the onsets of the broadband
elec-trostatic noise associated with the solitary waves observed in the spectrograms of the WBD data are generally consis-tent with propagation of the solitary waves up the field lines (away from Earth), or with particles or waves propagating up the field line, which leads to local generation of the solitary waves all along the field lines. A discussion of the impor-tance of these solitary waves in magnetospheric processes and their possible generation mechanisms, through electron beam instabilities and turbulence, is provided.
1 Introduction
A renewed emphasis was placed on the understanding of Broadband Electrostatic Noise (BEN) in 1994 when it was revealed by Matsumoto et al. (1994) that most of the BEN observed in the plasma sheet boundary layer is not contin-uous broadband noise but is composed of a series of soli-tary pulses that they termed “Electrostatic Solisoli-tary Waves”. Their analysis was based on time domain data obtained in high resolution by the Geotail Plasma Wave Instru-ment. An electron two-stream instability that produced nonlinear Bernstein-Greene-Kruskal (BGK) type isolated
potentials was proposed as the generation mechanism for the electrostatic solitary waves. Since then observations of these solitary waves in various regions of Earth have been reported by a number of researchers using waveform data from Polar, FAST, WIND, and Cluster. All of the observations to date have clearly shown that the solitary waves are propagating along, or nearly along, the magnetic field. Many of the soli-tary waves are thought to be electron holes, based on the di-rection of propagation of the solitary waves, the hemisphere in which they are detected, and the initial direction (positive or negative electric field) of the pulses associated with the solitary waves (see Cattell et al., 1999), and on their time du-rations being compatible with electron plasma periods (Ko-jima et al., 1999). Some of the solitary waves, however, are believed to be ion holes, but these have primarily been ob-served in the auroral acceleration region most recently by FAST (McFadden et al., 2003) and Polar (Bounds et al., 1999; Dombeck et al., 2001) and earlier on S3–3 (Temerin et al., 1982) and Viking (Bostr¨om et al., 1988). For a review of the characteristics of isolated solitary waves observed in various regions of Earth and a discussion of the differences between the expected properties of ion and electron solitary waves, see Cattell et al. (1999, 2003) and Kojima et al. (1999) and references therein.
A number of isolated solitary wave form types have been reported in the literature referenced above, i.e. monopolar pulses, bipolar pulses, tripolar pulses, and offset bipolar pulses. The monopolar and tripolar forms have been called weak or hybrid double layers since there is a potential change observed when the electric field of the pulse is integrated from one side of the pulse to the other. The symmetric bipo-lar pulse forms are shown to be consistent with phase space holes since there is no potential change when the electric field is integrated across these pulses.
Although not frequently reported or pointed out in all of the works referenced above, but which the data clearly show, is the fact that although these solitary waves are often ob-served to have symmetric bipolar waveforms, many more of them are found to be asymmetric and oddly shaped, e.g. the positive part of the pulse is much less in amplitude or time duration than the negative part, or vice versa. Omura et al. (1999) concluded that depending on what part of the waveform is observed by an antenna (i.e. ends vs. the center) as the solitary wave propagates past this antenna and how this antenna is oriented with respect to the magnetic field will af-fect the form of the solitary wave that is observed (see Fig. 2 of their paper). On spacecraft where the receiver makes a full three-dimensional measurement of the electric field, thus enabling transformation to a magnetic field-aligned coordi-nate system, the pulses are generally found to be bipolar and symmetric in the direction along the magnetic field and unipolar perpendicular to it (see for example, Franz et al., 1998). Thus, many of the asymmetric pulses that have been observed most likely are a result of a limitation of the hard-ware to measure the full electric field vector. McFadden et al. (2003) have provided further explanations, i.e. that this asymmetry could be due to evolution of the solitary waves
during their transit past the antennas, due to oblique propaga-tion of 3-D structures, or due to a real asymmetry but without the net potential drop. The latter case just requires a nonsym-metric charge distribution along the field. Additionally, small changes in the photoelectron currents to the antennas can dis-tort the waveforms making electric field asymmetries alone suspect in determining any implication of an asymmetry.
The primary observations presented in this paper are from the Cluster Wideband (WBD) Plasma Wave Receiver (Gur-nett et al., 1997). WBD is a high time resolution waveform receiver that senses wave emissions through the use of only one of two 88 m tip-to-tip electric field antennas (both in the spin plane) or magnetic searchcoils (one in the spin plane, one along the spin axis). The 9.5, 19 and 77 kHz bandwidth filters that are available to WBD provide time resolutions be-tween successive samples of about 36.5, 18.2, and 5 µs, re-spectively. This high time resolution is provided by directly downlinking the WBD data to a Deep Space Network ground station at 220 kbits/s. In order to maintain the high time reso-lution with the wider bandwidth filters, the data are sampled only 50% of the time in the 19 kHz filter mode, and only 12.5% in the 77 kHz mode. The 9.5 kHz sampling mode pro-vides continuous sampling. Since many of the solitary waves that are the subject of this paper have such short time dura-tions, it is necessary to observe fully resolved solitary waves with the wider bandwidth filters (the required bandwidth is indicated by the inverse time duration of the pulse). WBD makes only one measurement, that being the average poten-tial difference between the two electric field spheres. Thus, WBD does not have the capability on one spacecraft of deter-mining direction of propagation of the solitary wave, which is required in order to determine directly whether a bipolar solitary wave is an electron or ion hole. The technique that has been used successfully to make this determination on sin-gle spacecraft is to measure the propagation delay from one probe to another, such as from two electric field or Langmuir probes that are spatially separated.
WBD uses an automatic gain control (AGC) system, im-plemented in hardware, providing 75 dB of selectable gain in addition to the 48 dB of instantaneous dynamic range for its measurements. Gain is automatically added or subtracted in steps of 5 dB, with a possible 15 steps (0 to 75 dB), as neces-sary in order to keep the wave amplitude in the mid-range of the instantaneous dynamic range. The rate at which the gain step is updated can be selected by command from a fast rate of 0.1 s to a slow rate of 25.6 s. The gain update rate is usu-ally set at 0.1 s, its fastest rate, when measurements of bursty types of waves, such as solitary waves, are expected.
Receiver saturation will occur at the input at the 2 V level, providing a maximum peak-to-peak measurement of about 100 mV/m. To minimize nonlinear effects due to satura-tion of the amplifiers, the amplifiers were designed so that their maximum amplitude range is greater than the maximum range of the digitized signal output by the A/D converter. Thus waveforms may be clipped (not fully resolved by the 8 bits available) even though the receiver is not in saturation.
Since cross-spacecraft time correlation results are presented in this paper, it is necessary to discuss the issue of the accuracy of the time tags that are applied to the WBD data. The time tags that are applied based on the onboard clocks of the various spacecraft, which are not synchronized with respect to each other, are accurate to only 1–2 ms. Since WBD time correlations are carried out on solitary waves that have time durations of this same order of magnitude, the time tags obtained by the onboard clocks are not used. All time correlations discussed in this paper are based on time tags supplied by the Deep Space Network as the WBD data are received on the ground. These time tags are accurate to about 10 µs, thus providing a means of accurately determining time delays from one spacecraft to the next for solitary waves that are observed with such short time durations.
Supporting data for the WBD measurements are provided by the Cluster Fluxgate Magnetometer, FGM (Balogh et al., 1997), the Spatio-Temporal Analysis of Field Fluctuation experiment, STAFF (Cornilleau-Wehrlin et al., 1997), the Whisper Sounder (D´ecr´eau et al., 1997), the Electric Field and Wave experiment, EFW (Gustafsson et al., 1997), the Plasma Electron And Current Experiment, PEACE (John-stone et al., 1997), and the Cluster Ion Spectrometry experi-ment, CIS (R`eme et al., 2001).
In Sect. 2 we present the observations and analysis of the solitary waves that are detected along field lines that map to the auroral zone, but at altitudes well above the auroral acceleration region, often called the plasma sheet boundary. We provide the first observations and analysis of the tripolar solitary waves observed in the auroral zone outside the au-roral acceleration region. Also, we present the initial results of a cross-spacecraft correlation study of the solitary waves of the type that can only be performed by a multi-spacecraft mission such as Cluster. Section 3 contains a discussion of the results presented in Sect. 2, including comments on pos-sible generation mechanisms, the broader implications of the presence of these solitary waves in the auroral zone outside the auroral acceleration region, and the need for future work. We conclude in Sect. 4 with a summary of our findings.
2 Observations and analysis
A 50 ms sample of the waveforms obtained simultaneously on all four Cluster spacecraft by WBD in the 9.5 kHz band-width, continuous mode on 27 February 2002 starting at 11:17:19.46 UT is shown in Fig. 1a. In this figure time in-creases on the horizontal axis. The WBD data for each of SC1 (spacecraft 1), SC2, SC3 and SC4, panels 1 through 4, respectively, are plotted as a solid black line with the electric field peak-to-peak amplitude scale of the waveforms being given on the left vertical axis. Data points that are possi-bly clipped show up as green asterisks. The red dashed line represents the total angle between the electric field antenna being used and the measured magnetic field using FGM data; its scale is on the right vertical axis. These data were taken
while the spacecraft were at about 4.7 RE, 44◦λM (magnetic
latitude), 23:37 MLT (Magnetic Local Time), L-shell of 9.3, and crossing field lines that map to the northern auroral zone. The spacecraft separations during this time spanned the range of 83 to 220 km, with the closest pair being SC1 and SC4 at 35 km separation along the magnetic field and 75 km sepa-ration in the cross plane. Notice that only SC4 cleanly ob-serves the isolated solitary waves, in this case bipolar pulses, with amplitudes on the order of 4–5 mV/m peak-to-peak and an antenna angle relative to B of 5–10◦. The other three spacecraft primarily observe hiss at frequencies of a few kHz, along with a low frequency wave around 100 Hz (not clearly resolved) on SC2 and SC3. At this time the background mag-netic field is about 478 nT, which sets values of fce(electron
cyclotron frequency) at 13.4 kHz, fcp (proton cyclotron
fre-quency) at 7.3 Hz and the maximum possible value of flhr
(lower hybrid resonance frequency) at 312 Hz.
We have taken a 16 ms sample of the bipolar solitary waves shown in the SC4 data of Fig. 1a and connected the data points of those solitary waves to create a line, assuming all other fluctuations are essentially zero. None of these pulses have clipped data points. The resampled data are plotted in the first panel of Fig. 1b. The purpose of resampling is to allow us to easily integrate over the electric field ampli-tudes in order to come up with the total potential difference across the solitary waves. Since the number of data points that comprise these solitary waves varies from 20 to 25, they are well resolved and very little smoothing was needed. The start of a solitary wave was determined as the last point pre-ceding the first peak of the solitary wave that was either a local maximum or minimum. The end of the solitary wave was determined by finding the first local maximum or mini-mum following the last peak of the solitary wave. The data points between solitary waves were set to zero. The equation we have used to compute the potential difference is shown between the two panels of Fig. 1b. In the computation we have used the speed of 1900 km/s as the solitary wave ve-locity (Vsw). This veve-locity is based on the average speed reported for bipolar solitary waves (electron holes) in a sta-tistical study using Polar data from this region (Cattell et al., 2003). However, we note that Cattell et al. (2003) found that the variability of this speed is as large as the speed itself. Al-though we cannot prove that the bipolar pulses shown in the first panel of Fig. 1b are electron holes, their amplitudes and time durations are similar to those contained in the Cattell et al. (2003) study so that we feel it is justified to use the aver-age velocity of the electron holes from that study. In addition we have assumed that the angle (θV B) between the velocity
of the solitary waves and B is 0◦in calculating the potential change.
The bottom panel of Fig. 1b shows that the total poten-tial difference across all four solitary waves is nearly zero. We would expect the potential difference across these soli-tary waves to be zero based on previous statistical studies of Ergun et al. (1999). However, if the antenna is not exactly lined up with the magnetic field or the solitary wave does not get detected at its center but rather on its ends, an asymmetric
CLUSTER WBD WAVEFORM DATA 9.5 kHz Bandwidth ElectricField(mV/m) Antenna Angleto (deg.) B
Time (Seconds from 11:17:19.46 UT on February 27, 2002) Figure 1a 120 110 100 150 140 130 100 90 80 20 10 0
* clipped data point
5 0 -5 5 0 5 0 -5 5 0 -5 SC1 SC2 SC3 SC4 0 0.005 0.01 0.015 0.02 0.025 0.03 0.035 0.04 0.045 0.05 -5 (a) -4 -2 0 2 4 2002-02-27 11:17:19.488 S/C 4 E(mV/m) 4 6 8 10 12 B-Ez Angle(deg) 0 0.002 0.004 0.006 0.008 0.01 0.012 0.014 0.016 -1 -0.5 0 0.5 1 M(t) = V sw||cos 2VB||It 1 t dJ [E(J)-E4] Vsw= 1900 km/s M (V)
Seconds After Start
Figure 1b
(b)
Fig. 1. (a) Simultaneous Cluster WBD waveforms from all four spacecraft for a 50 ms period of time on 27 Febru-ary 2002 as the spacecraft cross auro-ral field lines that map to the north-ern auroral zone. Note that the bipo-lar pulses are seen clearly only on SC4 whereas the other three space-craft observe primarily auroral hiss. (b) The bipolar pulses from SC4 shown in Fig. 1a for the 16 ms period starting at 11:17:19.488 UT have been fit to a line in the top panel. Integration over the electric field has been performed ac-cording to the equation seen between the two panels, with the resulting poten-tial change being shown in the bottom panel. From this example we find that there is essentially no potential change across these pulses, which are consis-tent with phase space holes.
pulse (not symmetric around 0 mV/m or different time dura-tion of one polarity of the pulse vs. the other) will be ob-served by the spacecraft (Omura et al., 1999). A small error in the angle of the antenna to the magnetic field could also result because the WBD data are transmitted directly to the ground and onboard time tagging of the data is performed at the University of Iowa, whereas the FGM data are stored onboard and then time tagged at the European Space Opera-tions Centre (ESOC) in Germany. Although Iowa is using the
same algorithm as ESOC to obtain its onboard time tags, it is not certain that delays in the onboard system and the indi-vidual instruments have been compensated for in exactly the same fashion. Any differences in the time tagging would be on the order of 1–2 ms, at most, which translates into 0.09– 0.18◦of the spinning antenna (spin period is 4 s). All or any combination of these errors and uncertainties could easily account for the observed potential change with each of the bipolar pulses seen in Fig. 1b.
CLUSTER WBD WAVEFORM DATA 19 kHz Bandwidth
* clipped data point
6 0 -6 20 0 -20 6 0 -6 5 0 -5 ElectricField(mV/m) 130 115 100 35 30 25 80 65 50 160 150 140 Antenna AngletoB(deg.) 0.2 0.18 0.16 0.14 0.12 0.1 0.08 0.06 0.04 0.02 0
Time (Seconds from 08:41:21.00 UT on May 26, 2002) Figure 2a SC1 SC2 SC3 SC4 1 2 3 1 2 3 (a) -20 0 20 2002-05-26 08:41:21.05 S/C 2 E(mV/m) 26 28 30 B-Ez Angle(deg) 0 0.01 0.02 0.03 0.04 0.05 0.06 0.07 -4 -2 0 2 4 6 M(t) = V sw||cos 2VB||It 1 t dJ [E(J)-E4] Vsw= 1000 km/s M (V)
Seconds After Start
Figure 2b
(b)
Fig. 2. (a) Simultaneous Cluster WBD waveforms from all four spacecraft for a 200 ms period of time on 26 May 2002 as the spacecraft cross auroral field lines that map to the southern auroral zone. Some well formed tripolar pulses are observed in the SC2 data, some bipo-lar pulses in SC1, and some assymet-rical pulses in SC 3 and SC4. (b) The tripolar pulses from SC2 shown in Fig. 2a for the 70 ms period starting at 08:41:21.05 UT have been fit to a line in the top panel. Integration over the electric field of these tripolar pulses yields a measurable potential change of about 2.5 V across all four solitary waves, consistent with weak or hybrid double layers.
We now move to an example where all four spacecraft are crossing field lines that map to the southern auroral zone as shown in Fig. 2a. This case is from 26 May 2002, starting at 08:41:21.0 UT while the spacecraft were approximately at 5.0 RE, –47◦λM, 18:48 MLT and L-shell of 10.8. Note the
same format as for Fig. 1a, except that WBD is now sam-pling in the 19 kHz, 50% duty cycle mode, which leads to the data gaps observed in the figure. In this example we see
that solitary waves are observed on all four spacecraft, some of which are mainly tripolar pulses as on SC2, some of which are mainly bipolar pulses as on SC1, and some of which are not clearly one or the other as in SC3 and SC4. The separa-tions of the spacecraft for this example are on the order of 56 to 273 km or greater, with the SC2/SC4 pair being separated by only 25 km along B and 50 km in the cross plane. All the other pairs have separations at least twice as large as this.
Figure 3 (D) (C) (B) (A) Antenna Angle toB= 154o Antenna Angle toB= 163o 6 April 2002 10:23:06.81 UT
Fig. 3. Cross-spacecraft correlation of tripolar pulses observed on 6 April 2002 around 10:23:06 UT. Panels (A) and (B) show the calibrated waveforms from SC1 and SC3, respectively. Panel (C) shows the correlation coefficient reach-ing almost 0.8 at about 10 data point lags. Panel (D) shows the waveform from SC1 overplotted on SC3 after ap-plying the appropriate lag to SC1. Note that the initial large tripolar pulse and the last smaller amplitude pulse nicely line up with each other. Although the initial tripolar pulse in SC1 is clipped, the receiver is not in saturation so that it provides a valid time duration and form.
At this time the background magnetic field is about 423 nT, which sets values of fce at 11.8 kHz, fcp at 6.5 Hz and the
maximum possible value of flhr at 276 Hz.
We have made an initial attempt to perform a cross-spacecraft correlation of the waveforms for this region when the pulses are present and when the spacecraft lie closest to each other along the magnetic field direction using the FGM data, as well as perpendicular to the magnetic field direction. Several issues were considered. In order to be sure that we were observing the same solitary wave on two or more space-craft, we had to limit our cases to those where the angle of the antenna to the magnetic field was about the same on all spacecraft. Imposing this restriction should force the shape of the pulse to be the same between the various spacecraft. The 19 kHz bandwidth filter mode is usually required in or-der to fully resolve the solitary waves in this region, but the 50% duty cycle complicates the cross-correlation determina-tion. We are unable to see the waveforms in the gap
inter-vals, thus preventing us from seeing data where correlations might exist. Also, although wave sampling occurs at the very same time on all four spacecraft so that we might expect that the times of waveform capture would coincide on all space-craft, there is no cross-spacecraft time synchronization and the clocks on all the spacecraft run slightly differently. Thus, their sampling times overlap, but do not occur at precisely the same time in an absolute sense.
A cross-spacecraft correlation routine was applied to the waveforms of SC2 and SC4 shown in Fig. 2a for 26 May 2002 using the Deep Space Network supplied time tags described in the introduction in order to obtain time tag accuracy to 10 µs on all spacecraft. The greatest correla-tion coefficient obtained was –0.25 at a SC2 lag of 605 data points from SC4 at about 08:41:21.06 UT. This implies that the waveforms correlate best when 180◦out of phase, as we would have expected since the angles of the antenna with re-spect to B on each spacecraft are ∼180◦apart. This is not,
Figure 4
Fig. 4. An overview spectrogram of the southern auroral zone crossing of 26 May 2002. The bipolar and tripolar pulses are represented in this spectrogram by the broadband emissions that span nearly the entire bandwidth, with the highest intensities at lowest frequency. The onset, intensity and overall profile of the broadband emissions across all four spacecraft are quite similar, but not exactly the same.
however, a very high correlation coefficient. Based on the number of lags at the time of the best correlation coefficient, we have labeled the pulses 1 through 3 that appear to cor-relate using this time lag. Considering the time delay from detection at SC4 to that on SC2 for each pulse, we have cal-culated a speed along the magnetic field of 926 km/s (25 km divided by a delay time of 0.027 s), in the direction away from Earth. Assuming a velocity of 926 km/s and a tripo-lar pulse duration of 2.5 ms, we find that the parallel width along the magnetic field is about 2 km. The perpendicular width would be at least 50 km since that is the separation of the two spacecraft. The reason that the solitary waves on SC4 look less structured than those on SC2 may be that they are still in the evolutionary process (growing or still evolving to the full nonlinear state) as they propagate to SC2. Since the angle of the antenna to the magnetic field on each of SC2 and SC4 are about the same but in opposite sectors, we would ex-pect to see the initial pulse direction be opposite on the two spacecraft. Although it is difficult to make this determination in the case of SC4, it appears that this is the case, which is backed up by the negative correlation coefficient.
We have applied the same potential change analysis as in Fig. 1b to the series of clearly defined tripolar solitary waves on SC2 starting at about 08:41:21.07 UT. The results are seen in Fig. 2b. The solitary waves in this example are extremely well resolved, each one containing as many as 125 data points so that essentially no smoothing was required except between the solitary waves. Using the speed of 1000 km/s (which is a rounded value obtained from the cross spacecraft correlation discussed above), we find that a moderate poten-tial change, ∼2.5 V, has occurred across this series of pulses. Because of this measurable potential change, we expect that tripolar solitary waves are similar to the weak double lay-ers as described by Temerin et al. (1982) and Bostr¨om et al. (1988) for the auroral acceleration region, and Mangeney et al. (1999) for the solar wind.
The only other case that we have been able to identify of a possible correlation of solitary waves on one spacecraft be-ing the same as on another is also for tripolar pulses. Figure 3 shows this case for a southern auroral zone crossing where the spacecraft are located at 4.8 RE, −36◦λM, 22:09 MLT
Figure 5
Fig. 5. Relative positions of the four Cluster spacecraft in a magnetic field-aligned coordinate system where the center of mass of the four spacecraft is the origin, 1Z is parallel to the magnetic field and 1Y and 1X are perpendicular to this direction (see text for details). The direction to Earth is shown in the far right panel.
13 ms time period around 10:23:06 UT on 6 April 2002 are shown in panels (A) and (B). Note that the angles of the an-tenna with respect to the magnetic field are within 10◦of each other for this example. Note also that the first tripolar pulse observed on SC1 is highly clipped, but the receiver is not sat-urated so that the time duration and shape of the pulse (aside from the clipped portions) are valid. Panel (C) shows a large correlation coefficient of 0.78 at about 10 lags of SC1 from SC3, amounting to a 0.02 s time delay. Panel (D) shows the two 13 ms waveforms plotted on top of each other using the number of lags obtained at the highest correlation coefficient. Here it is evident that both of the solitary waves that are ob-served on both spacecraft fit nicely on top of each other and have the very same forms. Based on a separation distance of 56 km along B and 251 across B, we obtain a propaga-tion velocity of 2800 km/s away from Earth, a parallel size of 4.5 km (time duration of pulse = 1.6 ms) and a perpendic-ular size of at least 251 km. We have found no examples of a positive cross correlation with the bipolar solitary waves as of this date, possibly implying that these solitary waves are smaller in size than the tripolar solitary waves and/or that they do not propagate as far before decaying or becoming indistinguishable.
From about 1 February 2002 through 15 June 2002, the Cluster spacecraft were configured such that the average
sep-aration between the spacecraft was about 100 km. During this time the Cluster quartet crossed field lines that map to the northern and southern auroral zone well above the auro-ral acceleration region at about 4.5–6.5 RE and at MLTs of
0 to 3 and 16 to 24 (all MLTs with small separations have not yet had orbital coverage by Cluster). An example of just such a crossing is shown in Fig. 4. This is a usual spec-trogram in which frequency is plotted on the vertical axis, increasing time on the horizontal axis, and color denotes in-tensity, or electric field power spectral density. Ephemeris data are provided in columnar form at the bottom, show-ing that on this pass the spacecraft were crossshow-ing field lines that map to the southern auroral zone. These data are typi-cal of Cluster auroral zone (plasma sheet boundary) cross-ings occurring during the first half of 2002. Background hiss is observed throughout the spectrogram from its low-est frequency to about 3–5 kHz. Narrowband emissions at or slightly above the electron cyclotron frequency are occasion-ally observed (at about 12 kHz in the case of Fig. 4). Broad-band noise is the primary observed emission as it is seen to span nearly the entire frequency range with the greatest in-tensity being at lowest frequency. The broadband emission signature usually results from two types of wave forms: 1) solitary waves in the form of bipolar or tripolar pulses, and 2) random fluctuations that appear to look similar to
Table 1. Bipolar pulse statistics.
Date Time Period* (UT) Total bipolar Total pulses with Percent of pulses with
pulses detected no clipped data points no clipped data points
10 February 2002 17:00–17:40 2199 1487 67.6 27 February 2002 10:49–11:24 1189 860 72.3 6 April 2002 10:03–10:29 2371 1464 61.7 26 May 2002 08:31–08:57 872 645 74.0 12 June 2002 02:41–02:53 440 285 64.8 Total 7071 4741 67.0
* 20 s sampled out of every 52-second time period
turbulence. Both types of waveforms when analyzed with an FFT will produce a spectrum which contains all frequencies such as seen in Fig. 4. We have examined the waveforms for this particular auroral zone crossing and find that the major-ity of the broadband emission is the result of solitary waves. Immediately obvious in Fig. 4 is the fact that the overall pro-file of the broadband emission (frequency extent, intensity, onset) looks quite similar from one spacecraft to the next; however, there are differences in the data observed by the various spacecraft. The electron density for the 26 May 2002 example presented in Fig. 4, based on Whisper Sounder and EFW spacecraft potential measurements, ranges from less than about 0.02 to 0.1 cm−3. This implies electron plasma oscillation periods on the order of 10 µs. Thus, the solitary waves observed by WBD in this region do not clearly fall into the category of either electron or ion dynamics (see Ko-jima et al., 1999) even though their time durations are closer to electron plasma oscillation periods than ion. We therefore conclude that we cannot make a judgment as to whether the solitary waves observed by WBD in the auroral zone are elec-tron or ion holes based on the time durations of the pulses.
In order to view the spacecraft positions with respect to the magnetic field, we have transformed the position of each spacecraft into a B-field aligned coordinate system as shown in Fig. 5 for 26 May 2002 (the same time as Fig. 2 and con-tained within Fig. 4). The origin of this system is the center of mass of the four spacecraft and 1Z is parallel to the mag-netic field, 1Y is in the B × Rcm direction with Rcm the
radius vector from the Earth to the center of mass of the four spacecraft, and 1X completes the right-handed coordinate system. The direction to Earth is shown in the right-hand plot. It is clear in this figure that for solitary waves that may be propagating up the magnetic field from the earth, the or-der of arrival would be SC1, SC4, SC2 and SC3. When we look at the onset of some of the broadband emissions where solitary waves have been positively identified in the wave-forms, for example at 08:46 to 08:48 UT in Fig. 4, we find that this is precisely the order in which the emissions are ob-served. There are two possibilities based on this observation: 1) the solitary waves are generated below the spacecraft and
are propagating away from the earth along auroral field lines, but continue to evolve such that it is usually impossible to identify the same solitary waves on two or more spacecraft at Cluster’s location, and 2) the solitary waves are generated locally in response to particles or waves that travel up the field line, it taking longer for these particles or waves to reach the spacecraft farther from earth. These possibilities will be discussed further in the next section.
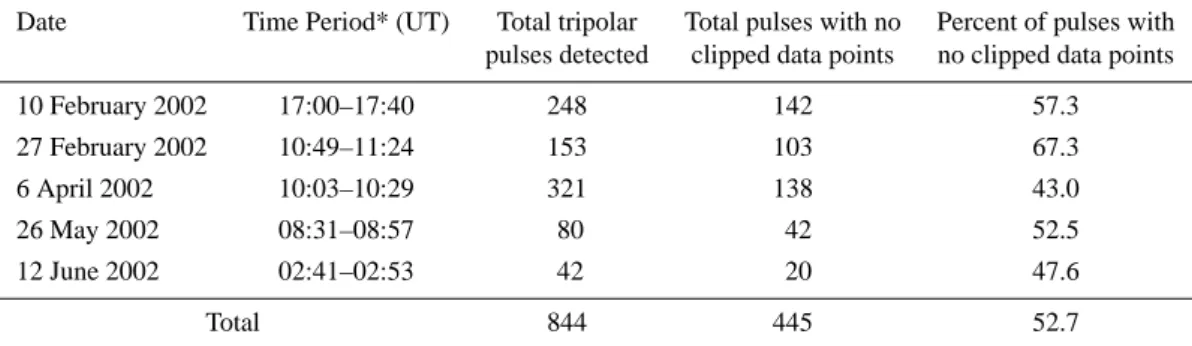
The last observational topic that we will address is that of the characteristics of the solitary waves observed by Cluster WBD in the Earth’s auroral zone at 5–7 RE. Tables 1 and 2
show the various dates and time periods for which we per-formed a statistical study of the bipolar and tripolar pulses, respectively, while the various spacecraft were crossing field lines that map to the auroral zone. The last three columns of these two Tables show the number of pulses of each type that were automatically detected in the waveforms, the num-ber of these detected pulses that contained no clipped data points, and the percentage of detected pulses that did not con-tain clipped data points. Note that the automatic bipolar and tripolar pulse detection algorithm was run only across a 20 s period of time out of every 52 s for each of the time peri-ods shown in order to speed up the run time and decrease the amount of hand checking for false positive pulses. The algorithm used to detect the pulses is described in Pickett et al. (2004). Table 1 shows that WBD is able to detect a high percentage of bipolar pulses without clipping while obtain-ing about half of its tripolar pulses with clipped data points. The reason for this may lie in the observation that tripolar pulses are somewhat less prevalent than bipolar pulses in any given sample.
The data obtained from the time periods shown in Ta-bles 1 and 2 are presented in Fig. 6. We point out that wave-forms with clipped data points have strictly been omitted from Fig. 6 even though in most cases of clipped waveforms the time durations are valid and the amplitudes determinis-tic based on the slopes of the rising and falling parts of the pulses. Even though we have omitted the clipped waveforms from Fig. 6, their absence will not affect the statistics since the automatic gain control of the instrument adjusts quickly
Table 2. Tripolar pulse statistics.
Date Time Period* (UT) Total tripolar Total pulses with no Percent of pulses with pulses detected clipped data points no clipped data points
10 February 2002 17:00–17:40 248 142 57.3 27 February 2002 10:49–11:24 153 103 67.3 6 April 2002 10:03–10:29 321 138 43.0 26 May 2002 08:31–08:57 80 42 52.5 12 June 2002 02:41–02:53 42 20 47.6 Total 844 445 52.7
* 20 s sampled out of every 52-second time period
to compensate for the clipping. As shown in Fig. 6 plots A and B, the time durations of the majority of the bipolar and tripolar pulses are about the same and range from 0.05 to 5 ms. Thus, they most likely are generated by similar types of processes that occur on similar types of time scales. The small differences in the overall forms of the distributions be-tween the tripolar and bipolar pulse time durations may be a result of the sampling. Many more bipolar pulses than tripo-lar are detected in any given sample set as shown by Tables 1 and 2. However, we do not rule out the possibility that there is a physical explanation for why the tripolar pulses have a flatter time duration distribution.
Plots C and D in Fig. 6 show that the amplitudes of the majority of both types of pulses vary from less than 1 to about 10 mV/m peak-to-peak, with a few (not shown here) ranging up to almost 100 mV/m. These values are compa-rable to those reported by Cattell et al. (2003) for this re-gion. Amplitudes as large as 750 mV/m, as reported by Cat-tell et al. (2003), could not be measured by WBD on Cluster since the receiver would probably be in saturation. However, such large amplitude solitary waves would probably be spe-cial cases as shown by the statistics in Fig. 6, plots C and D.
3 Discussion
We conclude from our cross-spacecraft correlation study that for spacecraft separations of several tens to a few hundreds of km the solitary waves are evolving (growing or decay-ing) over the distance from one spacecraft to the next such that they are almost always unrecognizable from one space-craft to the next. By decaying we mean that their potential is transferred to other waves, structures or particles and they no longer exist in the same form, if at all. Our cross-spacecraft correlation analysis is complicated greatly by the possibility that the solitary waves may be propagating at different speeds and in opposite directions. Thus, our attempt to identify the same solitary waves from one spacecraft to the next by lo-cating a distinct series of two or more pulses on both was also not very successful. For the two tripolar cases where we
have shown a possibility of correlation (Figs. 2a and 3), we obtained a parallel width along the magnetic field of 2–5 km. This is comparable to, or slightly larger than, the parallel size of the bipolar solitary waves observed on Polar (Franz et al., 1998; Cattell et al., 2003). Thus, the perpendicular width of the tripolar solitary waves of at least 50 km, based on the sep-arations of the two spacecraft cross field, is much larger than the parallel width. Further investigation of the reasons for the differences in these parallel and perpendicular sizes to previ-ous measurements made on single spacecraft is beyond the scope of this paper since it requires a considerable amount of time and resources to analyze such huge volumes of data. We simply point out that our measurements of size are appli-cable only to tripolar pulses, and all recently reported mea-surements are applicable to bipolar pulses.
It is unlikely that the solitary waves observed by Cluster are the very same solitary waves that are generated in the au-roral acceleration region as reported by Ergun et al. (1998a) which then propagate up to the location of Cluster along au-roral field lines. Two-dimensional simulation studies of bipo-lar solitary waves with characteristics simibipo-lar to those found in the auroral acceleration region were found to have life-times of 10 ms, which is long enough to travel tens of km (Goldman et al., 1999). However, Cluster is located 0.5– 2.5 REabove that region. Thus, it is unlikely that the solitary
waves observed by Cluster were generated in the auroral ac-celeration region. However, if the solitary waves were gen-erated just several tens to a few hundreds of km below (or above) the Cluster spacecraft, the Singh et al. (2000) sim-ulation results provide some insight into their possible evo-lution. Unipolar and bipolar pulses emerge from the high frequency waves within 120 plasma periods (approximately 42 ms at a density of 0.1 cm−3). Further, the bipolar pulses continue to grow for about 500 plasma periods and begin to decay or fragment substantially after 1000 plasma periods. Time periods such as these are compatible with our Cluster results, i.e. generation region at or several tens to a few hun-dreds of km below (above) the spacecraft, and growth and/or decay in the time it takes to propagate from one spacecraft to the next.
Figure 6
0 1 2 3 4 5 0 2 4 6 8 Time (ms) P e rc e n ta g e (A) 0 5 10 15 20 25 0 5 10 15 20 P-P Amplitude (mV/m) P e rc e n ta g e 0 5 10 15 20 25 0 5 10 15 20 P-P Amplitude (mV/m) P e rc e n ta g e (C) (D) (B)Fig. 6. Characteristics of the bipolar and tripolar pulses observed by Cluster WBD during several auroral zone (plasma sheet boundary) crossings at 4.5–6.5 RE. Plots (A) and (B) show the time durations of the bipolar and tripolar pulses, respectively, and plots (C) and (D)
show corresponding amplitudes. Note that the plots for amplitudes have been cut off above 25 mV/m, even though a few of the pulses are observed at amplitudes up to almost 100 mV/m.
We have shown that the potential difference across bipolar pulses is zero or nearly so, which is consistent with obser-vations of bipolar pulses described as electron holes using FAST data in the auroral acceleration region (Ergun, et al., 1999). The seeming potential change across these solitary waves as shown in Fig. 1a is due to the fact that WBD does not always measure strictly along the magnetic field direc-tion, which leads to a detection of pulses that are not symmet-ric around 0 mV/m, or measures across the ends or fringes of the solitary waves rather than across their centers. In addi-tion, we have shown that the integration of the electric field of the tripolar pulses over the duration of the pulse usually yields a dip and a hump in potential with a resultant potential change. Regardless of whether we measure across the center of one of these solitary waves or not, the introduction of the third peak in the waveforms will almost always ensure that there will be a potential change. Although we cannot be cer-tain of the magnitude of this potential change since we cannot determine with a high degree of confidence the magnitude of
the velocity at which these solitary waves are propagating, we can say that there is a measurable potential change across all of these solitary waves. The potential change is on the order of one half of one Volt or less, similar to solitary waves observed in the solar wind (Mangeney et al., 1999). For our case of 26 May 2002, where we observe a correlation of the tripolar solitary waves on SC2 with SC4, a speed of about 1000 km/s leads to a moderate total potential change across a series of 4 pulses of about 2.5 V.
What is the significance of the presence of the solitary waves in the data observed in the Earth’s auroral zone at 4.5– 6.5 RE, well outside the auroral acceleration region? We can
imagine that if there is a series of the tripolar solitary waves propagating along the auroral field lines, they could account for some part of the potential change observed between the ionosphere and magnetosphere. A similar conclusion was put forth by Koskinen et al. (1990). This potential geophys-ical aspect of the weak or hybrid double layers has never been fully explored, whether by observations, simulations
or theory. Chen et al. (2003) have suggested that the soli-tary waves, due to their wide accessibility (continuous range of allowed sizes and shapes) are expected to alter the bulk properties of the plasma medium such as temperature and dc resistivity. Research into this possibility has already begun for certain regions of the magnetosphere, in particular at the magnetopause.
Next we address the issue of how these bipolar and tripolar solitary waves are generated. The electron data for several of these events in which these types of waveforms are observed in the auroral zone have been analyzed. The PEACE elec-tron data in these regions usually show typical elecelec-tron pop-ulations, i.e. electron conics, bi-stream (counter-streaming) electron beams (which could also be unresolved conics), in-verted electron beams (beams traveling away from earth), and up and down depleted electron plasma sheet populations (a double loss cone distribution; however, the empty cone is much larger than the atmospheric loss cone). We note that these types of electron populations are observed in this region even in the absence of solitary waves. The usually favored mechanism for creating the solitary waves are the electron beam instabilities similar to those proposed to be the gener-ation mechanism for the solitary waves observed in the deep magnetotail and auroral zone (Omura et al., 1996; Goldman et al., 1999; Singh et al., 2000; Newman et al., 2001; Ja-vanovic et al., 2002). However, these electron beams are not always present at the exact times when the solitary waves are observed on Cluster, perhaps because the time resolution of the Cluster PEACE instrument is not sufficient when com-pared to solitary waves that occur on time scales on the or-der of 1 ms. Further, the PEACE angular resolution is not narrow enough to determine whether the beams that are oc-casionally observed simultaneously with the solitary waves are actually beams, or whether they are unresolved conics. We also point out that electron beams were not observed at the time of two bipolar pulse onset events in a study carried out by Tsurutani et al. (2003) using Polar data. The electron data used by Tsurutani et al. (2003) were also of much lower time resolution than the time scales of the pulses. FAST is the only spacecraft thus far that has the time resolution nec-essary to correlate solitary waves and electrons. Their re-sults present a consistent picture that associates cold electron beams with solitary waves in the auroral acceleration region (Ergun et al., 1998b). Tsurutani et al. (2003) proposed that the parallel electric field component of obliquely propagating electromagnetic proton cyclotron waves can provide a mech-anism for short duration bi-directional heated electron beams which then produce the bipolar pulses. The proton cyclotron waves arise through the loss cone instability as a result of an anisotropy in the particles caused by greater heating of the electrons than ions by phase-steepened Alfv´en waves. The Cluster wave data have not yet revealed the presence of elec-tromagnetic proton cyclotron waves for the two events pre-sented in this paper, but an exhaustive analysis has not yet been performed on the data.
Ion data from the Cluster CIS instrument have time reso-lutions that are also not sufficient when compared to the time
scales of the solitary waves. Although the typical ion spec-trogram in this region shows a plasma sheet boundary layer-like plasma on the poleward side of the plasma sheet, H+
beams near the plasma sheet boundary layer and the usual plasma sheet population inside the plasma sheet, there is nothing extraordinary in the data on a microscale level to sug-gest that ions are behind the generation of the solitary waves. However, we mention for completeness that an ion beam in the presence of two populations of electrons (cold and hot) can produce electron acoustic waves (Ashour-Abdallah and Okada, 1986), which could appear as bipolar pulses in the wave observations. The effect, if any, of the solitary waves on the ion or electron populations has not been explored with the Cluster data.
One final consideration for the local generation of these solitary waves is through a process that involves turbulence. Chen et al. (2003) proposed that BGK mode solitary waves can be spontaneously generated by turbulence (not restricted to electrostatic) or even thermal fluctuations without the pres-ence of beams or current-driven instabilities. The reason that this is possible is because the continuum of allowed param-eter space is so vast. McFadden et al. (2003) also suggest that ion solitary waves observed by FAST at the lower edge of the acceleration region may arise out of turbulence gen-erated at the lower edge of this region. The solitary waves observed by Cluster WBD well above the auroral accelera-tion region are often accompanied by broadband wave emis-sions as observed by STAFF-SA (usually in the electric field components up to a few kHz), EFW (electric field nents up to 10 Hz) and STAFF-SC (magnetic field compo-nents up to 10 Hz). We have not yet thoroughly analyzed these data, whether through waveforms or higher order anal-ysis results, with respect to exact occurrence times of solitary waves. Thus, we leave this to future work.
Although most of the above discussion with regard to the generation of the solitary waves concerns the bipolar pulses only, we will only briefly comment on the tripolar pulses. Because the potential signature of the tripolar pulses has a potential dip (traps ions) and a hump (traps electrons), as op-posed to just one hump or one dip in the case of the bipolar pulses, it would require both trapped electrons and trapped ions to be sustained. Initial work to explore possible genera-tion mechanisms and evolugenera-tion of the tripolar solitary waves in the auroral zone has just begun and is beyond the scope of the present paper.
4 Summary
Solitary waves in the form of bipolar and tripolar pulses are routinely observed on all four Cluster spacecraft by the Wideband Plasma Wave Receiver as the spacecraft cross field lines that map to the northern and southern auroral zones at 4.5–6.5 RE(plasma sheet boundary), well above the auroral
acceleration region. We do not attempt to classify the bipolar pulses as electron or ion holes since the Wideband instru-ment does not have the capability of determining direction of
propagation on the basis of measurements on a single space-craft. The electric field magnitudes of the solitary waves gen-erally fall into the range of 0.05 to 20 mV/m peak-to-peak and their time durations into the range of 0.3 to 5 ms. The bipolar solitary waves exhibit no potential change, being a characteristic of holes in phase space. The tripolar solitary waves are associated with moderate potential changes, prob-ably on the order of one half of one Volt or less. These poten-tial changes may account for some of the potenpoten-tial difference between the ionosphere and magnetosphere.
Although our initial attempts to identify identical solitary waves on more than one spacecraft was, for the most part, un-successful, we have at least two cases in which there appear to be some possibility that the same tripolar solitary waves are observed to propagate from one spacecraft to the next. Assuming this to be this case, we obtain a velocity of the tripolar solitary waves of several hundred to a few thousand km/s, which is on the order of the average propagation speed associated with the bipolar solitary waves (electron holes) of 1900 km/s found in a Polar study for this region (Cattell et al., 2003). Further, these tripolar solitary waves appear to be propagating away from the earth and evolve (grow and decay) over time, as we would expect. Based on the derived velocities, we find that the perpendicular width of the solitary waves would have to be at least 50 km since this is the min-imum cross field distance between the two spacecraft. The parallel width is about 2–5 km, which is on the order of the parallel size of the bipolar solitary waves observed on Po-lar. The distance solitary waves propagate along B is at least 25–60 km since that is the separation of the spacecraft dur-ing the two correlation events. The general poor success in identifying identical solitary waves on more than one space-craft is most closely tied to the fact that the spacespace-craft are separated by too great a distance so that the solitary waves are unrecognizable from one spacecraft to the next, if indeed they can survive for the time it would take for them to travel from one spacecraft to the next. In order to help answer the extremely difficult questions of how far the solitary waves propagate and how they evolve as they propagate will require the assistance of simulators and theorists using realistic in-puts to their models. Further, a mission such as the upcoming NASA Magnetospheric Multi-Scale should be able to answer some of these questions with smaller spacecraft separations and configurations which routinely place the spacecraft along the same field lines.
We have proposed two types of generation mechanisms for the solitary waves. The first one involves electron beam in-stabilities similar to those proposed by various theorists and simulators over the past several years to explain the presence of the solitary waves in the auroral zone and distant magne-totail. The second type involves electrostatic turbulence that has the capability of trapping particles in the direction paral-lel to B. These generation mechanisms will be examined in more detail in future work associated with Cluster.
Acknowledgements. We thank the organizers of the Nonlinear
Wave Workshop held in Mumbai, India in March 2003 for inviting us to present this work. We thank J. Seeberger and J. Dowell at Iowa for processing the WBD data, C. Abramo at DSN and M. Hapgood at JSOC for planning and scheduling the WBD operations, I. Willis and K. Yearby at Sheffield University for the expert commanding of WBD, R. Paredes and the antenna operators at DSN for the successful retrieval of the transmitted WBD data, and everyone at ESOC for the superb operation of the four Cluster spacecraft. We also thank the reviewers for their excellent comments which helped to make this a better paper. Work at the University of Iowa was carried out under NASA GSFC Grant No. NAG5-9974. Portions of this work were performed at the Jet Propulsion Laboratory, California Institute of Technology under contract with NASA.
Edited by: A. S. Sharma Reviewed by: two referees
References
Ashour-Abdallah, M. and Okuda, H.: Electron-acoustic instabilities in the geomagnetic tail, Geophys. Res. Lett., 13, 366–369, 1986. Balogh, A., Dunlop, M. W., Cowley, S. W., Southwood, D. J., Thomlinson, J., et al.: The Cluster Magnetic Field Experiment, Space Sci. Rev., 79, 65–91, 1997.
Bostr¨om, R., Gustafsson, G., Hollback, B., Holmgren, G., Koski-nen, H., et al.: Characteristics of solitary waves and double lay-ers in the magnetospheric plasma, Phys. Rev. Lett., 61, 82–85, 1988.
Bounds, S. R., Pfaff, R. F., Knowlton, S. F., Mozer, F. S., Temerin, M. A., et al.: Solitary potential structures associated with ion and electron beams near 1 REaltitude, J. Geophys. Res.,
104, 28 709–28 717, 1999.
Cattell, C. A., Dombeck, J., Wygant, J. R., Hudson, M. K., Mozer, F. S., et al.: Comparisons of Polar satellite observations of solitary wave velocities in the plasma sheet boundary and the high altitude cusp to those in the auroral zone, Geophys Rev. Lett., 26, 425–428, 1999.
Cattell, C., Neiman, C., Dombeck, J., Crumley, J., Wygant, J., et al.: Large amplitude solitary waves in and near the Earth’s magneto-sphere, magnetopause and bow shock: Polar and Cluster obser-vations, Nonlinear Proc. Geophys., 10, 13–26, 2003.
Chen, L.-J., Thouless, D. J., and Tang, J.-M.: Width-amplitude re-lation of Bernstein-Greene-Kruskal solitary waves, http://arxiv. org/abs/physics/0303021, 2003.
Cornilleau-Wehrlin, N., Chauveau, P., Louis, S., Meyer, A., Nappa, J. M., et al.: The Cluster Spatio-Temporal Analysis of Field Fluctuations (STAFF) experiment, Space Sci. Rev., 79, 107–136, 1997.
D´ecr´eau, P. M. E., Fergeau, P., Krannosels’kikh, V., L´evˆeque, M., Martin, P., et al.: Whisper, A resonance sounder and wave an-alyzer: performances and perspectives for the Cluster mission, Space Sci. Rev., 79, 157–193, 1997.
Dombeck, J., Cattell, C., Crumley, J., Peterson, W., Collin, H., et al.: Observed trends in auroral zone ion solitary wave structure char-acteristics using data from Polar, J. Geophys. Res., 106, 19 013, 2001.
Ergun, R. E., Carlson, C. W., McFadden, J. P., Mozer, F. S., Muschi-etti, L., et al.: Debye-scale plasma structures associated with
magnetic-field-aligned electric fields, Phys. Rev. Lett., 81, 826– 829, 1998a.
Ergun, R. E., Carlson, C. W., McFadden, J. P., Mozer, F. S., De-lory, G. T., et al.: FAST satellite observations of large-amplitude solitary structures, Geophys Res. Lett., 25, 2041–2044, 1998b. Ergun, R. E., Carlson, C. W., Muschietti, L., Roth, I., and
McFad-den, J. P.: Properties of fast solitary structures, Nonlinear Proc. Geophys., 6, 187–194, 1999.
Franz, J. R., Kintner, P. M., and Pickett, J. S.: POLAR observa-tions of coherent electric field structures, Geophys. Res. Lett., 25, 1277–1280, 1998.
Goldman, M. V., Oppenheim, M. M., and Newman, D. L.: Nonlin-ear two-stream instability as an explanation for auroral bipolar wave signatures, Geophys. Res. Let., 26, 1821–1824, 1999. Gurnett, D. A., Huff, R. L., and Kirchner, D. L.: The Wide-Band
Plasma Wave Investigation, Space Sci. Rev., 79, 195–208, 1997. Gustafsson, G., Bostrom, R., Holback, B., Holmgren, G., Lund-gren, A., et al.: The Electric Field and Wave Experiment for the Cluster mission, Space Sci. Rev., 79, 137–156, 1997.
Johnstone, A. D., Alsop, C., Carter, P. J., Coates, A. J., Coker, A. J., et al.: PEACE: A plasma electron and current experiment, Space Sci. Rev., 79, 351–398, 1997.
Jovanovic, D., Shukla, P. K., Stenflo, L., and Pegoraro, F.: Nonlinear model for electron phase-space holes in mag-netized space plasmas, J. Geophys. Res., 107(A7), doi:10.1029/2001JA900180, 2002.
Kojima, H., Matsumoto, H., and Omura, Y.: Electrostatic solitary waves observed in the geomagnetic tail and other regions, Adv. Space Res., 23, 1689–1697, 1999.
Koskinen, H. E. J., Lundin, R., and Holback, B.: On the plasma en-vironment of solitary waves and weak double layers, J. Geophys. Res., 95, 5921–5929, 1990.
Mangeney, A., Salem, C., Lacombe, C., Bougeret, J.-L., Perche, C., et al.: WIND observations of coherent electrostatic waves in the solar wind, Ann. Geophysicae, 17, 307–320, 1999.
Matsumoto, H., Kojima, H., Miyatake, T., Omura, Y., Okada, M., et al.: Electrostatic solitary waves (ESW) in the magnetotail: BEN wave forms observed by GEOTAIL, Geophys. Res. Lett., 21, 2915–2918, 1994.
McFadden, J. P., Carlson, C. W., Ergun, R. E., Mozer, F. S., Muschi-etti, L., et al.: FAST observations of ion solitary waves, J. Geo-phys. Res., 108(A4), 8018, doi:10.1029/2002JA009485, 2003. Newman, D. L., Goldman, M. V., Ergun, R. E., and Mangeney, A.:
Formation of double layers and electron holes in a current-driven space plasma, Phys. Rev. Lett., 87, 255001–1–25502–4, 2001. Omura, Y., Matsumoto, H., Miyake, T., and Kojima, H.: Electron
beam instabilities as generation mechanism of electrostatic soli-tary waves in the magnetotail, J. Geophys. Res., 101, 2685–2697, 1996.
Omura, Y., Kojima, H., Miki, N., and Matsumoto, H.: Two-dimensional electrostatic solitary waves observed by Geotail in the magnetotail, Adv. Space Res., 24, 55–58, 1999.
Pickett, J. S., Chen, L.-J., Kahler, S. W., Santol´ık, O., Gur-nett, D. A., et al.: Isolated electrostatic structures observed throughout the Cluster orbit: Relationship to magnetic field strength, http://arxiv.org/abs/physics/0402122, 2004.
R`eme, H., Aoustin, C., Bosqued, J. M., Dandouras, J., Lavraud, B., et al.: First multispacecraft ion measurements in and near the Earth’s magnetosphere with the identical Cluster ion spectrome-try (CIS) experiment, Ann. Geophys. 19, 1303–1354, 2001. Singh, N., Loo, S. M., Wells, B. E., and Deverapalli, C.:
Three-dimensional structure of electron holes driven by an electron beam, Geophys. Res. Lett., 27, 2469–2472, 2000.
Temerin, M., Cerny, K., Lotko, W., and Mozer, F. S.: Observations of double layers and solitary waves in the auroral plasma, Phys. Rev. Lett., 48, 1175–1179, 1982.
Tsurutani, B. T., Dasgupta, B., Arballo, J. D., Lakhina, G. S., and Pickett, J. S.: Magnetic field turbulence, electron heating, mag-netic holes, proton cyclotron waves, and the onsets of bipolar pulse (electron hole) events: a possible unifying scenario, Non-linear Proc. In Geophys., 21, 27–35, 2003.