HAL Id: tel-00387097
https://tel.archives-ouvertes.fr/tel-00387097
Submitted on 23 May 2009
HAL is a multi-disciplinary open access archive for the deposit and dissemination of sci-entific research documents, whether they are pub-lished or not. The documents may come from teaching and research institutions in France or abroad, or from public or private research centers.
L’archive ouverte pluridisciplinaire HAL, est destinée au dépôt et à la diffusion de documents scientifiques de niveau recherche, publiés ou non, émanant des établissements d’enseignement et de recherche français ou étrangers, des laboratoires publics ou privés.
Non-linear GaAs/AlOx waveguides for parametric
down-conversion
Marco Ravaro
To cite this version:
Marco Ravaro. Non-linear GaAs/AlOx waveguides for parametric down-conversion. Atomic Physics [physics.atom-ph]. Université Paris-Diderot - Paris VII, 2008. English. �tel-00387097�
UNIVERSITE PARIS DIDEROT ‐ PARIS 7
UFR DE PHYSIQUE
THESE
présentée pour obtenir le grade de
Docteur en Sciences de l'Université Paris 7
Nonlinear GaAs/AlOx waveguides for
parametric down‐conversion
Marco Ravaro
Soutenue publiquement le 30 janvier 2008
JURY
M.
V. Berger
Examinateur
M.
A. Fiore
Rapporteur
M.
A. Godard
Examinateur
M.
G. Leo
Directeur de thèse
M.
J. Tignon
Rapporteur
To my father.
Acknowledgements
This work has been carried out at the MPQ laboratory of the Paris Diderot University. I’m grateful to Vincent Berger for allowing me to work in this young, lively, and stimulating laboratory and for constantly sustaining my research project. Thanks to his experience, creativity, and extensive knowledge of the physics of semiconductors he has been an irreplaceable source of inspiration throughout the years of my thesis.
It is difficult to express here all my gratitude to Giuseppe Leo. He has supported my entire scientific career, leading my first steps in research, at the Roma Tre University, and entrusting me with this ambitious research project under his direction. Besides friendly sustaining me on innumerable occasions, teaching me a lot, and transmitting me a part of his endless energy and determination, he is my example of passion for scientific research and culture. Thank you.
Sara Ducci has been a brilliant and competent co‐worker, and a real friend. Besides her constant support to my experimental activities, her precious teachings and suggestions, she was an inexhaustible source of encouragement and good mood. I acknowledge her talent for didactics, her energy, and her endless availability.
I want to friendly thank Loїc Lanco and Jean‐Pierre Likforman, my optical table partners, with whom I have shared the every‐day difficulties and challenges of the experimental activity. Thank you for the numerous scientific discussions, for the tips exchanged, and for some memorable moment spent together. Working with you has been a real pleasure.
Pascal Filloux, Melanie Le Dû and Cristophe Manquest deserve all my gratitude for dealing with sample processing. Their skills in the clean room, their advice and constant availability have played a crucial role towards the results of this work. Thank you for your every‐ day support and the nice moments spent together as well.
I am grateful to Andrea Fiore, Antoine Godard, Isabelle Sagnes, and Jerome Tignon for accepting to take part to the examination committee. This manuscript has greatly benefited from their suggestions. Their interest in my work was an honour to me.
I want to thank all the members of the DON group that I have not yet mentioned, for their essential help to my experimental activities and their friendship: Alessio Andronico, Xavier Caillet, Lionel Deveaux, Ivan Favero, Aurore Gomez, and Erwan Guillotel. Thanks as well to Angela Vasanelli, Sukhdeep Dhillon, Yanko Todorov, Jean‐Yves Bengloan, Luca Sapienza, Simone De Liberato, Carlo Sirtori, Stefano Barbieri, Edouard Boulat, and all the other members of the MPQ laboratory for the nice atmosphere in the lab.
During two years, while the own site of the Paris Diderot University Physics Department was in construction, my experimental setup was hosted in the laboratories of Thales Research and Technology, where I had the chance to interact with several nice people. I’m grateful in particular to Jean‐Luc Reverchon for his experimental help and his endless availability, Xavier
Marcadet for sample growth, Alfredo De Rossi for scientific discussions, Alexandru Nedelcu, Olivier Guilcher, Eric Costard, Philippe Bois, Mathieu Carras, and Aude Leuliet for their kindness and niceness.
A few measurements presented in this thesis were performed at the Nonlinear Optics and Optoelectronics Laboratory of the Roma Tre University. I’m grateful to Gaetano Assanto, who first introduced me to the domain of nonlinear optics, for giving me the chance to work in his laboratory. In addition, I owe special thanks to Andrea Di Falco, Antonio Amoroso, Marco Peccianti, Andrea Fratalocchi and Lorenzo Colace for their constant support, their teachings, their pleasantry, and, above all, their friendship.
Finally, I’m infinitely grateful to my parents, who have always supported my choices and allowed me to arrive up to this point.
Résumé
Ce travail concerne des guides d'ondes semiconducteurs pour la génération et l'oscillation paramétrique. Dans de tels guides, la conversion de fréquence est accordée en phase grâce à un noyau multicouche biréfringent GaAs/AlOx. Cette technique d'accord de phase a déjà permis la réalisation de plusieurs interactions optiques non linéaires, telles que la génération de seconde harmonique et de différence de fréquence, ainsi que la fluorescence paramétrique. A présent, l'objectif est la réalisation d’un oscillateur paramétrique intégré semiconducteur. Notre travail dans cette direction a porté principalement sur deux points.
Le premier point est l'optimisation du processus de fabrication. Le principal inconvénient des guides d'ondes GaAs/AlOx sont les larges pertes par diffusion provoquées par la rugosité des couches oxydées. Des telles pertes ont pénalisé l'efficacité de dispositifs nonlinéaires intégrés déjà démontrés et empêché jusqu'à présent l'accomplissement de l'oscillation paramétrique. Dans le but d'améliorer la transmission des guides, un nouveau schéma de fabrication et d'oxydation a été introduit, et les résultats obtenus ont été systématiquement vérifiés par des mesures de pertes. Celles‐ci ont été réduites, de manière reproductible, à 0.4 cm‐1.
Le deuxième point est la caractérisation nonlinéaire des guides. Nous avons démontré la fluorescence paramétrique avec une accordabilité entre 1.7 et 2.7 m et une efficacité de conversion comparable à celle des meilleurs guides en niobate de lithium. En plus de cela, nous avons exploité les interactions de génération de seconde harmonique et d'amplification paramétrique pour étudier précisément le gain paramétrique dans nos guides. A la
dégénérescence (S = I ≈ 2 m) nous avons mesuré un coefficient de gain paramétrique
P P /
g ≈ 4 cm‐1 W‐1/2 et démontré une amplification paramétrique G = PS(L)/PS(0) ‐ 1 ≈ 4.5%. Ces résultats sont très encourageants pour la réalisation d'un oscillateur paramétrique intégré. Sur la base de nos valeurs de pertes et de gain paramétrique nous estimons que la réflectivité des facettes requise pour atteindre le seuil d'oscillation dans une configuration doublement résonante est inférieure à 90%. Un premier essai de fabrication de miroirs intégrés a été effectué et le travail dans cette direction se poursuit actuellement au sein du laboratoire MPQ.
MOTS‐CLES: Conversion de fréquence. Guides d'ondes AlGaAs. Accord de phase birefringent. Fluorescence paramétrique. Oscillation paramétrique.
Table of contents
Introduction: infrared generation by frequency down‐conversion ... 1
IR sources based on three‐wave mixing ... 2 Integrated frequency converters for the IR generation ... 4 Outline ... 61 Frequency conversion in AlGaAs waveguides ... 8
1.1 Optical quadratic interactions: fundamental concepts ... 8 1.1.1 The three‐wave‐mixing coupled equations ... 11 1.1.2 Sum‐ and difference‐frequency generation ... 12 1.1.3 Parametric amplification and fluorescence ... 16 1.1.4 Optical parametric oscillation ... 20 1.2 Nonlinear AlGaAs waveguides ... 22 1.2.1 Thin‐film waveguides ... 22 1.2.2 Guided‐wave frequency conversion ... 24 1.2.3 Modal phase matching in AlGaAs waveguides ... 25 1.2.4 Form‐birefringent GaAs/AlOx waveguides ... 27 1.2.5 OP‐AlGaAs waveguides ... 31 1.2.6 Counter‐propagating phase matching ... 332 Form‐birefringent nonlinear waveguides: design and fabrication ... 36
2.1 Device project and expected performances ... 36 2.1.1 Vertical structure design ... 36 2.1.2 Tuning and efficiency: expected performances ... 42 2.2 Waveguide fabrication ... 50 2.2.1 Growth and lithography ... 50 2.2.2 AlAs layers wet oxidation ... 52 2.3 Optical loss measurement ... 56 2.3.1 The Fabry‐Perot technique ... 57 2.3.2 Experimental results ... 602.4 Chapter conclusion ... 63
3 Waveguide nonlinear characterization: conversion efficiency and tuning ... 65
3.1 Parametric fluorescence experiments ... 65 3.1.1 Experimental setup ... 66 3.1.2 Conversion efficiency measurements ... 67 3.1.3 Parametric fluorescence spectra ... 72 3.2 Second‐harmonic generation experiments ... 74 3.2.1 Fundamental frequency source ... 75 3.2.2 Experimental setup ... 76 3.2.3 Results ... 77 3.3 Parametric amplification measurements ... 80 3.3.1 Experimental results ... 81 3.4 Chapter conclusion ... 834 Towards a GaAs/AlOx integrated OPO ... 85
4.1 LiNbO3 integrated OPO: state of the art ... 85 4.2 GaAs/AlOx integrated OPO: design and expected performances ... 87 4.2.1 Cavity configurations and oscillation threshold ... 87 4.2.2 Tunability... 92 4.3 Design and fabrication of the integrated mirrors ... 98 4.3.1 Dielectric mirrors ... 98 4.4 Chapter conclusion ... 1035 Second‐order nonlinear processes as characterization tools ... 105
5.1 Parametric fluorescence for MIR spectroscopy ... 105 5.1.1 MIR absorption spectrum of GaAs form‐birefringent waveguides ... 106 5.2 SESHG for modal birefringence measurements ... 112 5.2.1 Application to counter‐propagating parametric devices ... 113 5.2.2 SESFG generalization ... 116 5.3 Investigation of the efficiency of counterpropagating PF ... 1185.3.1 SESHG conversion efficiency ... 118 5.3.2 Counter‐propagating difference‐frequency generation ... 120 5.4 Chapter conclusion ... 123
Conclusion ... 124
List of symbols ... 127
References ... 129
List of publications ... 142
List of figures
Figure 1.1 Virtual transitions in a two‐energy‐level system ………..………..13 Figure 1.2 SFG conversion efficiency vs. interaction length …………..………15 Figure 1.3 SFG normalized detuning curve ……….15 Figure 1.4 Type I and type II birefringent phase matching in uniaxial crystals ………..……..16 Figure 1.5 Parametric amplification: normalized signal and idler intensity vs. gL ………..17 Figure 1.6 Temperature tuning curve for parametric generation in LiNbO3 …..………19 Figure 1.7 Singly‐ and doubly‐resonant OPO schemes ………..21 Figure 1.8 Ridge waveguide geometries ………....22 Figure 1.9 Momentum conservation in modal phase‐matched AlGaAs waveguides ………...26 Figure 1.10 Modal overlap in modal phase‐matched AlGaAs waveguides ……….27 Figure 1.11 Form birefringence in GaAs heterostructures .………28 Figure 1.12 Scheme of GaAs/AlOx waveguides based on the double‐etched structure ………29 Figure 1.13 DFG experimental detuning curve in a GaAs/AlOx waveguide from Ref. [Bravetti, 1998] ..30 Figure 1.14 Narrow core AlGaAs/AlOx birefringent waveguide from Ref. [Scaccabarozzi, 2006] …..…..31 Figure 1.15 Sketch of process flow for the fabrication of OP‐GaAs by GaAs/Ge heteroepitaxy ….………32 Figure 1.16 Scheme of SESHG ……….34 Figure 2.1 Normalized AlGaAs nonlinear coefficient vs. Al molar fraction ………..37 Figure 2.2 Modal profiles in 3 m and 6 m wide AlGaAs ridge waveguide ……….38 Figure 2.3 Basic guiding structure for the GaAs/AlOx parametric generator ……….39 Figure 2.4 FB of the in GaAs/AlOx parametric generator vs. GaAs/AlOx duty cycle …………..………..……40 Figure 2.5 FB of the GaAs/AlOx parametric generator vs. number of AlOx layers ……….………...40 Figure 2.6 GaAs vs. AlOx thickness for degenerate parametric generation at 1.03 m ……….…………..41 Figure 2.7 Index and modal profiles of the GaAs/AlOx parametric generator at degeneracy ….……....43 Figure 2.8 2D signal modal profile of the GaAs/AlOx parametric generator at degeneracy…..………….43 Figure 2.9 Tuning curve of the GaAs/AlOx parametric generator………..…44 Figure 2.10 PM bandwidth vs. signal wavelength of GaAs/AlOx parametric generator ………..45 Figure 2.11 Dependence of the tuning curve on AlOx refractive index ………46 Figure 2.12 Dependence of the tuning curve on GaAs layer thickness ……….……47 Figure 2.13 Dependence of the tuning curve on AlOx layer thickness ……….…….47 Figure 2.14 Degeneracy wavelength of the GaAs/AlOx parametric generator vs. ridge width ……..…….48 Figure 2.15 Modal profiles of the GaAs/AlOx parametric generator out of degeneracy……….…….49Figure 2.17 SEM image of a GaAs/AlOx parametric generator ………...51 Figure 2.18 SEM image of a GaAs/AlOx parametric generator ….………...53 Figure 2.19 Mesa for the observation of the oxidation progress ………...55 Figure 2.20 Calculated Fabry‐Perot transmission fringes …………..………...58 Figure 2.21 Experimental Fabry‐Perot transmission fringes ………...61 Figure 2.22 Modal facet reflectivity as calculated by 3D FDTD modeling ………..63 Figure 2.23 Experimental propagation losses vs. wavelength ………...63 Figure 3.1 PF experimental setup ………...………...67
Figure 3.2 PF vs. pump power in LiNbO3 waveguide from Ref. [Schreiber, 2001] ………..68
Figure 3.3 Experimental signal vs. pump power (preliminary measurement) ………..69 Figure 3.4 Experimental signal and TM pump power vs. pump polarization ………….………….………..70 Figure 3.5 Experimental signal vs. pump power ……….71 Figure 3.6 Calculated signal vs. pump power ………71 Figure 3.7 PF experimental spectra ……….73 Figure 3.8 Experimental and calculated PF tuning curve ……….73 Figure 3.9 Calculated and experimental temperature tuning curve ………74 Figure 3.10 Tunability and detuning curves of the PPLN DFG source at 2 m ……….………..76 Figure 3.11 Experimental setup for second‐harmonic generation………77 Figure 3.12 Experimental and calculated second‐harmonic generation detuning curve ……….78 Figure 3.13 Experimental second harmonic vs. pump power………..80 Figure 3.14 DFG experimental setup ………...81 Figure 3.15 DFG experimental spectrum ………..…………82 Figure 3.16 Experimental parametric amplification vs. pump power ………83
Figure 4.1 Tunability and output power of the Ti:LiNbO3 OPO from Ref. [Schreiber, 2000]…..………….86
Figure 4.2 Pump threshold of the GaAs/AlOx integrated OPO vs. waveguide length……….………….89 Figure 4.3 Pump threshold of the GaAs/AlOx integrated OPO vs. facet reflectivity ……….…….…………..89 Figure 4.4 Scheme of double‐pass DROPO ….………90 Figure 4.5 Double‐pass DROPO threshold vs. phase mismatch………91 Figure 4.6 Scheme of DROPO tuning dynamics………93 Figure 4.7 Giordmaine's diagram for DROPO tuning ……….……….94 Figure 4.8 Number of axial modes and clusters for the GaAs/AlOx integrated OPO ……….…………..97 Figure 4.9 Calculated reflection spectra for the GaAs/AlOx OPO integrated mirrors………….…………..100 Figure 4.10 Experimental reflection spectrum for the GaAs/AlOx OPO input mirror…….……..…………..101
Figure 4.11 SEM image of a GaAs/AlOx OPO input integrated mirror ………..……….102 Figure 4.12 SEM image of a GaAs/AlOx OPO input integrated mirror ………..……….102 Figure 4.13 Shallow‐etched and deep‐etched DBRs on GaAs/AlOx waveguides ……….103 Figure 5.1 Calculated DFG PM spectra vs. idler losses……….106 Figure 5.2 Off‐degeneracy PF spectra vs. signal wavelength ………...……..…………..108 Figure 5.3 Experimental PF tuning curve ……….……108 Figure 5.4 Signal spectra with and without AlOx absorption around 3 m ……….109 Figure 5.5 Experimental PM bandwidth and idler attenuation vs. idler wavelength ………110 Figure 5.6 Experimental AlOx absorption vs. wavelength around 3 m ………111 Figure 5.7 AlOx transmission spectra from Ref. [Bravetti, 1998] and [Fiore, 1997c] .……….…….111 Figure 5.8 Scheme of the counterpropagating entangled photon source……….………113 Figure 5.9 Calculated tuning curve of the counter‐propagating entangled photon source …….………114 Figure 5.10 NF and FF of SESHG from the counter‐propagating entangled photon source …….………..115 Figure 5.11 NF of surface‐emitted SFG ………...……….……..116 Figure 5.12 Experimental tuning curve of the counter‐propagating entangled photon source ….…….117 Figure 5.13 Experimental SESHG vs. pump power ………119 Figure 5.14 Scheme of the backward DFG experiment ………..……..121 Figure 5.15 Experimental setup for backward DFG………..121 Figure 5.16 Experimental detuning curve of backward DFG………..122
List of tables
Table 2.1 Multilayer epitaxial structures A and B ..……….42 Table 4.1 Structure of the integrated mirror M1………..100 Table 4.2 Structure of the integrated mirror M2………..100 Table 5.1 Summary of experimental and theoretical birefringence values for structure C ………..116Introduction: infrared generation by frequency down‐conversion
Infrared (IR) radiation corresponds to the region of the electromagnetic spectrum with wavelengths between visible light (400‐700 nm) and terahertz waves (0.1‐10 mm). Conventionally, this interval is divided in three subregions: the near infrared (NIR), between 0.7 and 2.0 m, the mid‐infrared (MIR) from 2.0 to 20 m, and the far infrared (FIR), from 20 to 100 m.
Among these three intervals, the MIR range is of strong scientific and technological interest for spectroscopy. Several molecules exhibit their fundamental rotational‐vibrational resonances in this region, with absorption spectra highly specific to their atomic structure. Chemical sensing has numerous key applications, both civilian, as atmosphere pollution monitoring or industrial process control, and military, e.g. the detection of neurotoxins. As MIR absorption lines are very strong, molecule concentrations as low as parts per‐billion can be detected by means of laser‐based detectors. In the NIR, where only overtone resonances can be excited, absorption peaks are weaker, and the corresponding detection thresholds several orders of magnitude higher.
At present, in spite of the lower sensitivity, many measurements are still performed at wavelengths below 2 m, due to the absence of suitable laser sources at longer wavelengths. Infrared spectroscopy requires continuously tunable sources, with compactness and room temperature operation highly desirable. In the MIR, the present state of the art for this type of devices includes diode lasers and sources based on nonlinear frequency conversion. [Sorokina, 2003]
The main representatives of the former category are lead‐salt, quantum‐cascade and antimonide diode lasers. [Choi, 2004] Lead‐salt diode lasers have been the workhorse for numerous successful sensing systems, and coverage of the whole 3‐30 m range has been demonstrated. However, they exhibit shortcomings in power, beam quality and spectral reproducibility, and require cryogenic cooling for continuous wave (CW) operation. Quantum cascade lasers (QCLs) hold great promise as an alternative free from these problems. They are proven to produce significant CW output power at room temperature in the 4‐9 m range, while maintaining single mode operation and being reproducibly tunable in a manner suitable for spectroscopy. Similar features are also typical of GaInAsSb/AlInAsSb laser diodes, covering
the 2‐3 m region. For all three of these families, tuning can be accomplished by changing either the temperature or the injected current. However, for a single device the overall tuning range is limited to some tenths of nanometers and is affected by longitudinal‐mode hops. This major drawback can be significantly reduced by incorporating the diode into a grating‐tuned external cavity. This solution, whose main technical issue is the deposit of an anti‐reflection coating on one of the laser facets, has been successfully demonstrated for both antimonide diodes and QCLs.
IR sources based on three‐wave mixing
A versatile alternative to laser diodes is represented by sources based on (2) nonlinear processes. [Armstrong, 1962] Three‐wave mixing is a well‐known means of extending the operation of available lasers to further spectral regions, by exploiting the nonlinear optical properties of non‐centrosymmetric crystals. The basic principle is as follows: two waves at angular frequencies 1 and 2, when injected into such crystals, give rise to a nonlinear polarization field oscillating at the frequencies 1+2 and 1‐2. Accordingly, under opportune conditions, two waves at these frequencies are radiated from the crystal. Frequency conversion is now so well‐established that it has been adopted for the fabrication of several commercial sources. One of the most significant examples is for green light generation, once the prerogative of gas lasers (Argon) and now mainly based on the frequency doubling of Nd3+ lasers oscillating at 1 m.
For MIR generation, frequency conversion involves the use of an intense “pump” wave (generated by a laser), which is coupled to a seeded wave, the “signal”, and an “idler” wave generated at the difference frequency p‐s. The initial source of photons for the signal wave can be either a second injected laser beam or quantum noise. In the former case the interaction is generally exploited in a single pass configuration and is referred to as difference‐frequency generation (DFG). The latter process, called parametric fluorescence (PF), is generally exploited by resonantly enhancing the signal or the idler wave in a cavity containing the nonlinear medium, as the gain induced by the pump (parametric gain) is low. In this configuration, called optical parametric oscillator (OPO), if the parametric gain overcomes the overall losses in the cavity at the resonant frequency, the signal and idler waves oscillate.
coherent radiation in any temporal format and over a wide spectral range, only limited by the transparency of the nonlinear crystal. For both these processes, one of the main issues is the fulfillment of the phase‐matching (PM) condition. For the signal and idler waves to be continuously fed by the pump as the beams propagate through the crystal, the three waves must stay unvaried in their initial phase relation. As the frequencies of the three fields are different, the phase‐matching condition in general is not satisfied, due to crystal dispersion. The classical approach to achieve phase‐matched propagation is based on the use of a birefringent nonlinear crystal. By properly polarizing some of the interacting waves along the ordinary axis and the remaining on the extraordinary axis, medium dispersion can be compensated. A more convenient way to fulfill the PM condition relies on microstructured crystals where the second‐ order susceptibility is periodically inverted, so as to keep the three waves into the correct phase relation. This technique, called quasi phase matching (QPM), was firstly demonstrated in ferroelectric crystal, like LiNbO3 and KTP,1 where such (2) modulation can be achieved by reversing the crystal ferroelectric domains.
Even before the advent of QPM, which revolutionized the field of nonlinear optics, LiNbO3 was the nonlinear crystal of choice, due to its numerous properties: wide transparency range, birefringence, thermal conductivity, and a considerable (2) coefficient. The development of periodically poled lithium niobate (PPLN) further reinforced this position, including for the fabrication of infrared sources. The combination of high nonlinearity and long interaction length of PPLN has considerably increased the conversion efficiency of DFG and OPO systems based on this crystal, making them accessible to diode laser or fiber laser pumping.
The implementation of QPM had an even stronger impact on another optical nonlinear medium, gallium arsenide. This semiconductor has a (2) coefficient considerably higher than those of LiNbO3 and of most nonlinear crystals. Nevertheless, until the last decade it was not employed for frequency conversion, since it is neither anisotropic nor ferroelectric, and thus not readily suitable to the application of the above PM schemes. In 2001, the fabrication of the first effective QPM GaAs bulk crystals, [Eyres, 2001] rapidly opened the way for a series of tunable IR sources with impressive performances. In this orientation‐patterned GaAs (OP‐ GaAs), the inversion of the nonlinear coefficient is obtained by means of epitaxial growth on a
1
peculiar, periodically patterned substrate. Among the results that followed from this technological innovation was the first GaAs‐based OPO, reported in 2004. [Vodopyanov, 2004] Due to the high nonlinearity and wide transparency range of GaAs,2 this device was continuously tunable between 2.2 m and 9 m (limited only by mirror reflectivity), with a maximum conversion efficiency of 25%. Based on these recent results, GaAs appears to be mature as an alternative to LiNbO3 for the fabrication of NIR and MIR sources.
Integrated frequency converters for the IR generation
In terms of performances, frequency converters show substantial advantages compared to laser diodes. They are suitable for oscillation from continuous wave (CW) to femtosecond regimes, offer wider tunability ranges and great flexibility, especially since the advent of periodically poled materials. In addition, the recent demonstration of OP‐GaAs promises to extend the versatility of PPLN‐based sources to the whole MIR region. On the other hand, frequency converters are based on complex, often cumbersome setups that considerably limit their transportability, preventing their use outside of a laboratory setting. Despite the recent fabrication of miniaturized OPO sources, the degree of compactness offered by room‐ temperature or Peltier‐cooled laser diodes remains unattainable for bulk nonlinear sources.
An intermediate solution between these two families of sources are guided‐wave frequency converters, that potentially combine a compactness similar to that of semiconductor lasers with the performances of frequency conversion. In general, nonlinear interactions in waveguides offer several attractive features: compactness, on‐chip integration with other devices and a variety of design solutions. In addition, the confinement of the interacting fields on a long propagation distance results in a conversion efficiency orders of magnitude higher compared to their bulk counterparts. On the other hand, the fabrication of waveguides is often technologically more complex than that of bulk crystals. The key issue are scattering losses, which can considerably limit the efficiency of nonlinear processes. In spite of such technological drawbacks, several highly‐performing integrated frequency converters have been demonstrated to date. Similar to bulk crystals, PPLN has played a major role also for guided‐ wave generation both in the visible (through frequency up‐conversion, [Kintaka, 1996]) and in
2
GaAs transparency region, included between 0.9 and 17 m, is far more extended in the MIR compared to that of LiNbO3 (0.35‐5 m) and of most other common nonlinear crystals.
the IR (through down‐conversion, [Bortz, 1995; Hofmann, 1999]).
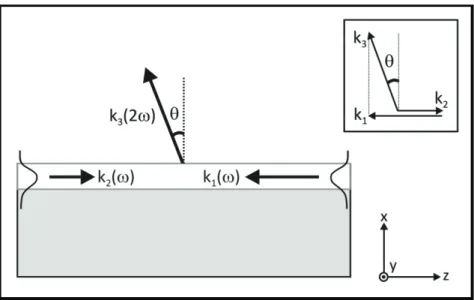
With respect to PPLN, and to dielectric waveguides in general, GaAs integrated nonlinear devices offer the additional potential benefit of the integration with a pumping source. A tangible evidence of this appeal is given by the large number of integrated frequency converters reported in the last decade. Regretfully, to date, scattering losses have prevented GaAs waveguides from fully developing their potential. This is the case of QPM AlGaAs waveguides, based on the same inversion technique of OP‐GaAs [Yu, 2005]. At present, a performing alternative to QPM is represented by form birefringence (FB) in GaAs waveguides. These integrated frequency converters, based on a strongly birefringent guiding core, were developed in the late 90’s at the Thomson CSF (today Thales) laboratories. By embedding in a GaAs guiding layer several low‐index AlOx 3 layers, a FB sufficient to fulfill the phase‐matching condition in the NIR was attained. [Fiore, 1998b] As detailed in the following (Sections 1.2.4 and 2.2.2), AlOx layers result from the selective oxidation of AlAs layers embedded in the structure. Due to design versatility, this approach has since been successfully employed to phase match either down‐ or up‐conversion interactions in the IR. [Fiore, 1997a; Fiore, 1998a; De Rossi, 2001]
From a technological point of view, in the last decade GaAs/AlOx approach has experienced a strong development. The very first conversion demonstrations suffered from processing immaturity, resulting in high propagation losses. At present, the conversion efficiency for both frequency doubling and down‐conversion is comparable to that of LiNbO3 counterparts. Nevertheless, a gap still remains in terms of propagation losses. This is the main obstacle towards the accomplishment of a resonant configuration, i.e. of an integrated OPO.
Within this scenario, this thesis aims at further developing GaAs/AlOx nonlinear waveguides. In particular we have focused on the IR generation by parametric down‐ conversion, after the first PF demonstration of 2001 [De Rossi, 2001]. Working on an integrated parametric generator pumped at 1 m, with a strong appeal towards the field of IR spectroscopy, we have pursued two main tasks:
‐ the optimization of waveguide processing, based on a strong synergy between clean‐ room and optical characterization of the devices, in order to substantially reduce
3
scattering losses;
‐ the extensive experimental investigation of the nonlinear properties of the waveguides, in order to reliably ascertain the nonlinear conversion efficiency.
The achievement of these objectives should open the way towards the ambitious goal of an integrated OPO in GaAs. This possibility has been explored, with the aid of numerical modeling, by studying different cavity configurations, as well as by fabricating and testing the first resonant devices.
Outline
In Chapter 1 we briefly overview the field of nonlinear quadratic interactions in AlGaAs waveguides. The basic concepts of nonlinear optics are presented through a brief description of several (2) processes, in order to review the theoretical tools required for the following. After a short introduction to guided‐wave frequency conversion, the main phase‐matching schemes for AlGaAs waveguides are illustrated; in this context, the theoretical features and the state of the art of GaAs/AlOx FB waveguides are compared with those of alternative schemes. In Chapter 2 we describe the design guidelines for our integrated parametric generator. Its main features (i.e. tunability, conversion efficiency, and fabrication tolerances) are investigated thoroughly. Subsequently, the fabrication procedure is outlined. Our contribution in this respect is highlighted, as well as the consequent benefits for the waveguide performances, which have been evaluated by measurements of propagation losses.
An extensive experimental nonlinear study of the device is the subject of Chapter 3. Besides PF experiments, two further nonlinear interactions have been performed: second‐ harmonic generation (SHG), and DFG. PF has allowed to investigate the complete tuning curve and the phase‐matching bandwidth. SHG and DFG have been carried out in order to reliably evaluate the parametric gain.
Chapter 4 discusses the perspective of an integrated parametric oscillator. Firstly, we describe different possible configurations for an integrated OPO based on our GaAs/AlOx parametric generator. Secondly, we report the results of our calculations of the oscillation threshold, based on the experimental values of parametric gain and propagation losses. Thirdly, we detail the design and the fabrication of our first integrated dielectric mirrors.
GaAs waveguides. Firstly, tunable PF is exploited to measure the optical losses of the waveguide on a broad wavelength interval. This approach has allowed us to quantitatively characterize an AlOx absorption peak between 3 and 4 m. Secondly, surface‐emitted frequency conversion. These interactions, which have proven as the most convenient technique to directly measure the birefringence of GaAs waveguide, are exploited here to investigate the efficiency of a counterpropagating twin‐photons source.
1 Frequency conversion in AlGaAs waveguides
Nonlinear optics (NLO) is the subfield of optics that describes the optical effects arising from the interaction of intense optical fields with matter. The history of this science is strongly connected to that of laser sources. Until the first demonstration of the laser, dating back to the early 1960s, most of optical phenomena were described by linear equations. For the electric polarization P induced in a medium by the electric field Eof an applied optical wave, a
dependence P = 0Ewas assumed.4 However, as we know from other domains of physics, the linear description of a physical system is generally an approximation that holds only in a limited range. Indeed, the advent of intense coherent laser beams pointed out a series of light‐matter interactions, previously unknown, requiring a nonlinear description of the vector P . The first NLO process observed was a quadratic one, the frequency doubling of a ruby laser beam in a quartz crystal. [Franken, 1961] Since then, the improvement of pump sources and nonlinear media has turned quadratic NLO into an effective approach to generate coherent radiation at frequencies not attained by available lasers.
The intensity enhancement typically allowed by guided‐wave geometry considerably reduces the power required for the accomplishment of a given nonlinear process and has granted optical waveguides a prominent position in the NLO scenario. In addition, the wealth of solutions offered by waveguide engineering has allowed the exploitation of nonlinear processes to theoretically and experimentally demonstrate a variety of complex functions for all‐optical signal processing. These reports reinforced the hope for integrated optical circuits, where nonlinear optical devices act like electronic components in today’s microelectronics.
In the first Section of this Chapter we review the basic concepts of nonlinear optics, focusing on the fundamental equations of three‐wave mixing. The second Section, after an introduction to the main features of guided‐wave nonlinear optics, describes the main phase‐ matching schemes adopted in AlGaAs waveguides.
1.1 Optical quadratic interactions: fundamental concepts
The most rigorous approach to the physics of NLO optics is based on quantum electrodynamics, treating both the medium and the optical field as quantized systems. Whereas this theory
4
proves successful to explain any radiation‐matter interaction, its formal complexity is not justified for our purposes. The NLO basic equations reported in the following result from a semi‐classical treatment, which describes the medium through quantum mechanics and light radiation with the classical electromagnetic field theory. [Shen, 1984] The quantum description of the matter is exploited to obtain the expression of the macroscopic nonlinear electric susceptibilities of the medium, which then can be employed in Maxwell equations. With the exception of parametric fluorescence,5 this theoretical approach is perfectly suitable to describe wave‐mixing interactions. Here, the use of quantum electrodynamics will be limited to provide a simple additional description of some processes. Let us consider the case of a typical optical medium: local, homogenous, with no free‐ carriers and far from resonances. The electric polarization associated to an electric field E can be expanded into a power series of E NL ) 3 ( ) 2 ( L ) 1 ( ... ) t ( E : ) t ( ) t ( E : ) t ( ) t ( E ) t ( ) t ( 0 (1) 0 (2) 2 0 (3) 3 P P P P P P (1.1)
where (n) is a rank (n+1) tensor defining the nth‐order susceptibility, with a structure determined by the crystal symmetry. Here we have singled out the term PL, describing the
linear response of the medium, and the term PNL , including higher‐order polarization terms. In order to obtain the counterpart of Eq. 1.1 in the frequency domain, E(r,t) and P(r,t) have to be expressed through their Fourier transform. As in most practical situations the total electric field is given by the superposition of (quasi‐) monochromatic waves (laser beams), it can be conveniently expressed as the sum . c . c )] t r k ( i exp[ ) ( E e 2 1 ) t , r ( E ) t , r ( E m m m m m m m m
(1.2)of waves of (angular) frequency m, wavevector km = mnm/c and unit vector
e
m. 6 Note that here, for simplicity, we resort to the plane‐wave approximation. Based on Eq. 1.2, the Fourier 5 Where quantum noise acts like one of the input fields. 6 c.c. stands for complex conjugate. While the field m E is a real quantity, the wave amplitude Em is conventionally complex valued to include the description of phase accumulation.transform of Eq. 1.1 gives
...
)]
(
[
)
(
)
(
)
(
)
(
P
(1)
1
P
(2)
1
2
P
(1.3) with)
(
E
)...
(
E
)
(
E
:
)
,...,
,
;
(
)
(
n 1 0 (n) n 1 1 2 n 1 1 n ) n (
P
(1.4)where the n+1 frequencies coupled by the nth‐order susceptibility fulfill the summation relation
n 1 j 1 n j (1.5)Let us consider now the case of an electric field oscillating at the frequencies 1 and 2, focusing on P(2)() and neglecting higher‐order terms. Under these assumptions, the nonlinear
polarization field oscillates at the frequencies 3 = 1 + 2 (sum‐frequency generation, SFG), 3 = 1 ‐ 2 (DFG), 3 = 21 , 22 (SHG), and 3 = 0 (optical rectification). For SFG and DFG processes, the projection of P(2)()on the i‐th axis (i = 1,2,3) results in
jk 2 k 1 j 2 1 3 ) 2 ( ijk 0 3 ) 2 ( i ( ; , )E ( )E ( ) (SFG) 2 ) ( P (1.6) ) DFG ( ) ( E ) ( E ) , ; ( 2 ) ( jk 2 * k 1 j 2 1 3 ) 2 ( ijk 0 3 ) 2 ( i
P (1.7) Note that, with respect to reciprocal interactions, i.e. 3 = 1 + 2 , 1 = 3 ‐ 2, 2 = 3 ‐ 1, the second‐order susceptibility tensor exhibits the following permutation symmetry ) , ; ( ) , ; ( ) , ; ( 3 1 2 (jki2) 1 2 3 kij(2) 2 3 1 ) 2 ( ijk (1.8)This property, that is valid also for higher order susceptibilities, results in the same photon conversion efficiency for reciprocal processes. Moreover, as we are considering a spectral region far from medium resonances,7 the permutation symmetry is independent of the frequencies involved, turning into a relation between the different elements of the same tensor
7
(Kleinman symmetry). [Kleinman, 1962] Under this assumption, the 33 elements of the
(2) tensor are reduced to only 10 independent elements.1.1.1 The three‐wave‐mixing coupled equations
In the absence of charges, the wave equation for the electric field in an isotropic and non‐ magnetic
(2)dielectric, reads 2 ) 2 ( 2 2 0 2 2 2 0 2 2 2 0 2 2 2 2 t c 1 t E c t c 1 t E c 1 E P P (1.9)where the term 2 ) 2 ( 2 t P
takes into account the energy transfer between fields at different frequencies, coupled by the second‐order nonlinearity. In order to quantitatively analyze this process, let us consider the interaction between three collinear monochromatic plane waves at frequencies 1, 2, 3, with 3 = 1 + 2. } . c . c )] t z k ( i exp[ ) z ( E e { 2 1 ) t , r ( E } . c . c )] t z k ( i exp[ ) z ( E e { 2 1 ) t , r ( E } . c . c )] t z k ( i exp[ ) z ( E e { 2 1 ) t , r ( E 3 3 3 3 3 2 2 2 2 2 1 1 1 1 1 (1.10)
As the three waves exchange energy during propagation, with respect to Eq. 1.2 we have explicitly introduced the dependence of the three amplitudes on z.8 However, we make the assumption that the variation of such amplitudes is small within the distance of one wavelength (slow‐varying envelope approximation), i.e. 2 i 2 i i dz ) z ( E d k dz ) z ( dE (1.11)
If Kleinman symmetry holds, by inserting Eqs. 1.6 and 1.10 in Eq. 1.9 we obtain the coupled equations for the SFG process 3 = 1 + 2 [Armstrong, 1962]
8
kz i 2 1 3 eff 3 3 kz i 3 * 1 2 eff 2 2 kz i 3 * 2 1 eff 1 1 e E E c n d i dz dE e E E c n d i dz dE e E E c n d i dz dE (1.12)
where ni is the refractive index of the medium at i, k = k3 ‐ k2 ‐ k1 the phase mismatch and deff is the effective nonlinear coefficient given by deff (1/2)e3 (2)(3;1,2):e1e2. Similarly, for the DGF process 3 = 1 ‐ 2 we find kz i * 2 1 3 eff 3 3 kz i * 3 1 2 eff 2 2 kz i 3 2 1 eff 1 1 e E E c n d i dz dE e E E c n d i dz dE e E E c n d i dz dE (1.13)
where the phase mismatch is equal to k = k1 ‐ k2 ‐ k3. These sets of equations describe the evolution of the amplitude of three waves coupled by the second‐order nonlinearity. Note that the only difference between the two sets is given by the phase of the complex amplitudes Ei, which depends on the initial conditions and determines the direction of the energy transfer. In this respect, we stress the key role of the phase mismatch: if k = 0, the initial direction of the energy transfer between the interacting waves stays unvaried along the propagation direction, while for k ≠ 0 it is periodically inverted. This behavior will be further discussed in the following, when the conversion efficiencies of up‐ and down‐conversion processes will be calculated by integrating the three‐wave‐mixing equations along the propagation length.
1.1.2 Sum‐ and difference‐frequency generation
Although the nonlinear coupled equations give a good description of (2) processes, it is instructive to complement the above electromagnetic formalism with a quantum picture. This approach, relying on the concepts of virtual transition and intermediate state, provides a schematic and effective explanation of all nonlinear optical effects. [Shen, 1984] Unlike real
Figure 1.1 Virtual transitions in a two‐energy‐level system: transmission (a), sum‐frequency generation (b), and difference‐frequency generation (c).
transitions, like absorption or stimulated emission, which imply a resonant interaction of the field with the medium, virtual transitions occur towards an ultrashort‐lifetime energy level, where the density of states is zero.
In Figure 1.1 three examples of virtual transitions are illustrated, with the medium represented as a system of two energy eigenlevels, E1 and E2. The scheme "a" shows the linear response of the medium: a photon at frequency 1 (with ħ1<E2–E1) excites the system to a state that is not an eigenvalue of the energy, and is successively re‐emitted as the system returns to the fundamental state. The short, but finite, lifetime of the excited state is responsible for the reduced light speed in the medium.9 The scheme "b" represents a SFG process: after a first virtual transition, the system is further excited by a second photon at frequency 2 and its subsequent decay results in the emission of a photon at 3 = 1 + 2. As this interaction requires that two photons excite the system within the short lifetime of the intermediate state, its probability is non negligible only for intense photon fluxes.10 The DFG process can be described similarly, as shown in the scheme "c": in this case, the arrival of the second photon at frequency 2 (< 1) induces a first partial decay of the system, resulting in the emission of a further photon of the same energy, through a process analogous to stimulated emission. Accordingly, a photon at frequency 3 = 1 ‐ 2 is emitted after the complete decay. This description clearly illustrates the two distinct features of DFG, which is at the same time a
9 In classical electrodynamics this delay is accounted for by the material refractive index.
10 According to Heisenberg uncertainty principle, the lifetime of the virtual state is as longer as nearer it is to the
real state. This accounts for the increase of both the nonlinear coefficients and the refractive index near the resonances of the material.
frequency generation and an amplification process. In order to exploit the latter feature, the intensity of the field at 1 is set much higher than that of the field to amplify at 2. In this configuration, the three waves at 1, 2 and 3 are commonly referred to as pump, signal and idler, respectively.
Up‐ and down‐conversion efficiencies can be readily calculated by integrating the nonlinear coupled equations (Eqs. 1.12 and 1.13) along the propagation distance, in the case of a low conversion efficiency, when the amplitudes of the two input fields stay constant along z. Let us treat first the SFG process. Based on the assumptions E1(z)=E1(0), E2(z)= E2(0), and E3(0)=0 the integration of Eq. 1.12 over a distance L gives 2 2 2 2 2 1 2 3 eff 3 2 3 2 kL 2 kL n si L E E c n d ) L ( E (1.14)
Integrating the intensities Ii 20nicEi 2on the transverse area A of the interacting beams, the conversion efficiency of the interaction reads ] W [ 2 kL 2 kL n si L P P P 1 2 2 norm 2 1 3 (1.15)
where Pi is the power at i and
] cm W [ c n n n d 8 A 1 1 2 2 3 0 3 2 1 2 eff 2 norm (1.16)
with 3 = 2c/3, the conversion efficiency normalized to the interaction length, at phase matching (k = 0). Under the same assumptions, the integration of Eq. 1.13 results in an identical expression for the conversion efficiency of the DFG process 3 = 1 ‐ 2.
In Eq. 1.15 the impact of the phase‐matching condition is further clarified. For k ≠ 0, as the polarization and the electric field at 3 experience different phase velocities, the energy transfer between the excitation fields and the generated one is periodically inverted along
Figure 1.2 SFG conversion efficiency vs. interaction length for three different values of phase mismatch.
L, according to the coherence length Lc = /k. As illustrated in Figure 1.2, this leads to a negligible conversion efficiency compared to the case of perfect phase matching, with the intensity of the sum frequency field growing monotonically as the square of the interaction length L. Accordingly, the phase‐matching condition determines the spectral band of the conversion process, which exhibits a characteristic sinc2 shape, as shown in Figure 1.3.
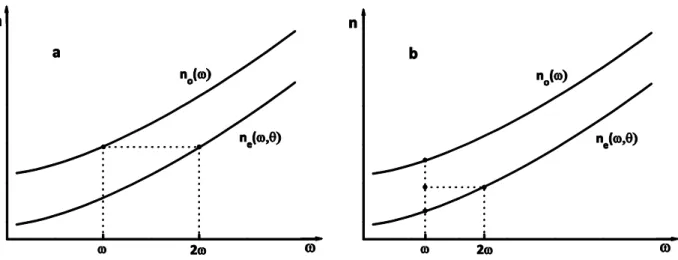
Due to normal dispersion, the phase‐matching condition in optical media is generally not satisfied. The common approach to obtain phase matching is based on birefringent nonlinear crystals. In order to illustrate this technique, let us refer for the sake of simplicity to the case of degenerate SFG, i.e. SHG. The latter process is based on a single excitation wave at
Figure 1.4 Type I (a) and type II (b) birefringent phase matching in a negative uniaxial crystal. Note that type I PM is suitable to compensate a larger dispersion.
the fundamental frequency , which acts like both the fields E1 and E2, resulting in a generated E3 field at frequency 2. The phase mismatch for SHG can be written as k = k3 ‐ k2 ‐ k1 = k2 ‐ 2k = 4(n2‐n)/, where n (n2) and (2) are the refractive index and the wavelength at (2), respectively. Through a proper polarization of the interacting fields, n and n2 can be made equal by exploiting the crystal birefringence. As shown in Figure 1.4a, in a negative uniaxial medium this is possible for an ordinary wave at and an extraordinary wave at 2 (type I PM), for which the PM condition reads ne(2) = no().11 An alternative SHG configuration is based on an extraordinary wave at 2 arising from the interaction of an ordinary and an extraordinary wave at (type II PM). In this case, the PM condition is expressed by 2ne(2) = ne()+no() (Figure 1.4b). Due to the angular dependence of the extraordinary index, the pair of phase‐matched frequencies (,2 can be tuned by rotating the crystal.
1.1.3 Parametric amplification and fluorescence
The amplification of a signal field at expense of an intense pump wave in a DFG interaction is known as optical parametric amplification (OPA). As the intensity of the signal is supposed to be initially weak and to significantly increase along the interaction length, the modeling of this configuration is based on different assumptions with respect to DFG. In this case Eq. 1.13 has to be integrated by setting EI(0)=0, |EP(z)|≈|EP(0)| and |Es(0)|<<|EP(0)|.
11
In an uniaxial crystal, the refractive index for the extraordinary wave depends on the angle between the
Figure 1.5 Normalized signal (solid line) and idler (dashed line) intensity vs. gL.
At phase matching, the resulting evolutions of signal and idler fields versus the interaction length L are expressed by (Figure 1.5) ) gL ( cosh ) 0 ( E ) L ( ES 2 S 2 2 (1.17) ) gL ( sinh ) 0 ( E ) L ( EI 2 S 2 2 (1.18) where g is the parametric gain coefficient, defined as ] m [ c n n n d 8 A P g 1 I S I S P 0 2 eff 2 P 2 (1.19) It is often useful to rewrite this expression through a degeneracy factor ] m [ ) 1 ( c n n d 8 A P g 2 2 1 0 2 0 P 0 2 eff 2 P 2 (1.20) where 0 = 2P, n0 ≈ nS ≈ nI, 1+ = 0/S, and 1‐ = 0/I (0 ≤ ≤ 1). This formulation points out that parametric amplification is maximum at degeneracy12 ( = 0) and decreases as signal and idler wavelength split (→ Signal power amplification is usually expressed in terms of the parametric gain G. Taking into account the phase mismatch: 12 Note that at degeneracy g/ PP norm (cm ‐1 W‐1/2).
[Sutherland, 1996]
2 2 2 2 2 2 S S ) 2 / kL ( ) gL ( ) 2 / kL ( ) gL ( sinh ) gL ( 1 G 1 ) 0 ( P ) L ( P (1.21)At phase matching G(L)=sinh2(gL), which can be approximated as G(L)=(gL)2 for low‐gain (gL ≤1). In general, for small gain (gL)2<<(kL/2)2 2 2 2
)
2
/
kL
(
)
2
/
kL
(
sin
)
gL
(
G
(1.22) The co‐generated idler power can be expressed in terms of parametric gain by the equation G ) 0 ( P ) L ( P S I S I (1.23)The generation of a signal and idler photon pair through the annihilation of a pump photon can also take place in the absence of a signal seed, albeit such a process cannot be described classically. This spontaneous parametric down‐conversion (SPDC) of a pump photon is referred to as parametric fluorescence. It is of particular interest in the field of quantum optics, due to the correlation features of the down‐converted photon pairs. [Bouwmeester, 2000] This process, which arises from the interaction of the pump with the quantum noise via the (2) nonlinearity, can be conveniently modeled by addressing the pump classically and by quantizing the signal and idler fields. [Yariv, 1989] The contribution of quantum fluctuations is equivalent to the presence of one photon in either the signal or the idler modes, which locally interacts with the pump field producing a nonlinear polarization at all the possible frequencies between 0 and P. However, the growth of the generated optical field is effective only at those frequencies that approximately fulfill the phase‐matching condition. Accordingly, in order to evaluate the effective signal input, only the modes within the phase‐matching band must be taken into account. The signal input power for frequencies between S and S + dS is obtained by putting one quantum of energy in each of the signal longitudinal modes in this band, divided by the transit time in the nonlinear medium = Lns/c [Byer, 1968; Baldi, 1996] S S S d 2 ) 0 ( dP (1.24)
The overall output idler power is obtained by integrating the associated dPI, according to Eqs. 1.21 and 1.23
0 S 2 2 2 2 2 S S I 2 I d ) 2 / kL ( ) gL ( ) 2 / kL ( ) gL ( sinh 2 ) gL ( ) L ( P (1.25)In the low gain regime (gL<<1), the approximation (gL)2<<(kL/2)2 is valid over almost all the integration range, except at the center of the PM band (k ≈ 0), which does not contribute significantly to the integral in Eq. 1.25. This can thus be rewritten as
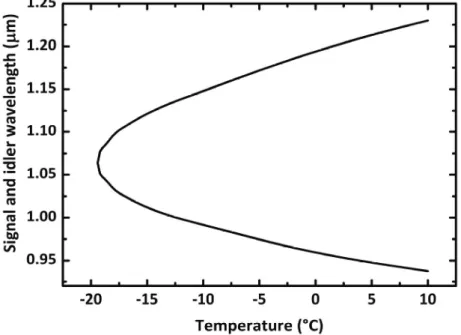
0 S 2 2 S S I 2 I d ) 2 / kL ( ) 2 / kL ( sin 2 ) gL ( ) L ( P (1.26) Hence, in the low gain regime, the generated idler exhibits a linear dependence on the pump power. Symmetrically, the generated signal power is expressed by a similar equation, obtained by considering quantum noise as an idler effective input. As the pair of generated signal and idler wavelengths is determined only by frequency and momentum conservation, PF is typically widely tunable, over a range basically limited by the nonlinear crystal transparency. These desirable feature is illustrated in Figure 1.6, where the calculated tuning curve for a LiNbO3 crystal is reported: here we have considered a simple
Figure 1.6 Calculated temperature tuning curve for parametric generation in a LiNbO3 crystal,
type I non‐critical PM scheme, with the pump and the generated fields polarized along the extraordinary and the ordinary axis, respectively. While tuning can be accomplished also by changing the pump wavelength or the crystal orientation, in this case we calculated the PM condition versus the crystal temperature, with a hundred of nanometers range covered by the generated wavelengths.
1.1.4 Optical parametric oscillation
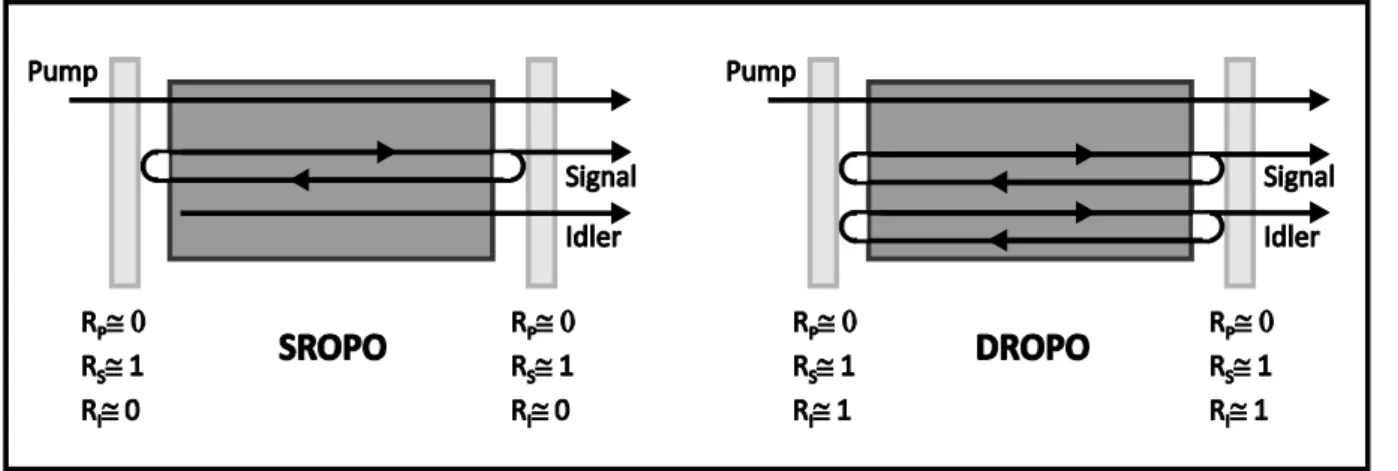
As parametric amplification in a nonlinear crystal is generally low, even with an intense pump beam, the employment of a single‐pass OPA is limited to a few specific applications. According to Eq. 1.19, a CW 10 W Nd:YAG beam focused on a 20 m radius spot in a LiNbO3 crystal results in a parametric gain coefficient g ≈ 0.14 cm‐1 at degeneracy (S=I=2.128 m).13 Only high peak power pulses from picosecond and femtosecond pump sources are suitable to produce a parametric gain sufficient to considerably amplify an injected seed, or to make the generated wave emerge from quantum noise in a single‐pass configuration. The parametric gain achieved with CW (or quasi‐CW) pumps is typically enhanced through a positive feedback to the generated waves, which is obtained by inserting the nonlinear crystal in an optical cavity. As in a laser, when the parametric gain overcomes the overall losses inside the cavity, the generated fields oscillate, resulting in two coherent output beams. Such a device, known as optical parametric oscillator (OPO), has been studied and demonstrated with several different cavity configurations. Among these, two common schemes are the singly‐resonant OPO (SROPO) and the doubly‐resonant OPO (DROPO). Referring to Figure 1.7, in the former geometry the cavity is resonant only at signal (idler) wavelength, i.e. RP ≈ 0, RS ≈ 1, RI ≈ 0 (RP ≈ 0, RS ≈ 0, RI ≈ 1), while in the latter both the generated wavelengths are resonating, i.e. RP ≈ 0, RS ≈ 1, RI ≈ 1. Note that, unlike in a laser, the gain in the active medium is unidirectional: as the PM condition is fulfilled only when the three waves are copropagating, signal and idler are amplified in the nonlinear crystal only in one propagation direction.14 By equating cavity losses in a round trip and single‐pass parametric amplification, the gain threshold for a SROPO results [Sutherland, 1996] 13 For type I non‐critical phase matching, with d eff=5pm/V. 14 However, in some cavity configuration, the pump is made pass through the crystal forward and backward, thus amplifying the generated waves in both propagation directions.

![Figure 1.10 Refractive index profiles and normalized modal profiles for the guiding structure [GaAs (substrate), 2000 nm Al 0.7 Ga 0.3 As, 1500 nm GaAs, air]. Left: TE 0 (dotted line) and waveguide](https://thumb-eu.123doks.com/thumbv2/123doknet/2325039.30146/46.892.113.805.132.374/figure-refractive-profiles-normalized-profiles-structure-substrate-waveguide.webp)
![Figure 1.14 AlGaAs/AlOx birefringent waveguide for SHG from 1.55 m from Ref. [Scaccabarozzi, 2006]. Profiles of the phase‐matched modes: TE 00 at = 1.55 m (a) and TM 00 at /2 (b). The very](https://thumb-eu.123doks.com/thumbv2/123doknet/2325039.30146/50.892.220.677.137.360/figure-algaas-birefringent-waveguide-scaccabarozzi-profiles-phase-matched.webp)

![Figure 2.1 Normalized AlGaAs nonlinear coefficient as a function of Al molar fraction, extrapolation from experimental data (from Ref. [Ohashi, 1993]).](https://thumb-eu.123doks.com/thumbv2/123doknet/2325039.30146/56.892.243.657.124.434/figure-normalized-nonlinear-coefficient-function-fraction-extrapolation-experimental.webp)