4914
Root-yield performance of pre-release sweet potato
genotypes in Kenya
Mwamburi Mcharo1, 2* and Phillip Ndolo3
2International Potato Center, Sub Sahara Africa Region. P. O. Box 25171 Nairobi, Kenya
3Kenya Agricultural Research Institute, Regional Research Center, Kakamega, P. O. Box 169, Kakamega, Kenya
*Corresponding author: [email protected]
1Current Address: Ecostat Consulting, P.O. Box 38561 – 00623, Nairobi, Kenya.
Original submitted in on 22nd March 2013 Published online at www.m.elewa.org on 29th May 2013. ABSTRACT
Objective: The focus of this study was to evaluate the yield and stability of superior sweet potato cultivars for release in Kenya. This is the first attempt to document experimental results that have led to the first and so far only sweet potato variety release in Kenya.
Methodology: Ten national performance trials laid out as randomized complete block designs were performed on 14 sweet potato (Ipomoea batatas (L.) Lam.) genotypes in two geographical locations of Kenya. The trials were conducted to select local and introduced genotypes that were high yielding, stable, and tasty. Four experiments involving all the 14 genotypes were carried out in Nairobi while six experiments involving nine of the genotypes were carried out at three sites in Western Kenya. The stability of root yield and palatability test ranking were determined using appropriate statistical tools.
Results: Significant (P = 0.05) differences in root yield between genotypes were observed for both locations. Mean root yield was higher in Nairobi (16,760 kg ha-1) than in Western Kenya (15,150 kg ha-1). The proportion of marketable roots was higher in Nairobi than in Western Kenya. Dry matter content was also higher in Nairobi (29.63%) than in Western Kenya (26.58%). Genotype x environment (G×E) interactions were significant (P = 0.05) in both locations.
Conclusion and applications: Recommendations on the suitable varieties for official release are given. KEMB 10 and Mugande were the best performers in both environments. These two varieties contribute to enhancing food security among small scale household farmers in rural Kenya. Since its release in 2000, SPK 004 has contributed to enhancing the availability of the beta carotene micronutrient.
Key Words: Environment, Genotype, Stability INTRODUCTION
One of the major objectives of sweet potato (Ipomoea batatas (L.)Lam.) breeding programs is to improve root yield. Root yield is an important trait for both large-scale commercial farmers and small-scale subsistence farmers in poor communities. Consequently, breeding for higher root yield requires that breeders take into
consideration all yield components which affect the total root yield. Such a focused approach with well-defined selection objectives ensures positive progress early in the breeding program. Interrelationships among yield components have been investigated by Grüneberg et al. (2005) in Peru and Çalişkan et al. (2007) in Turkey, who
Journal of Applied Biosciences 65:4914 – 4921
4915 both found significant G x E interactions between location and root yield ;). Yildirim et al. (2011) also studied effects of G x E interactions in sweet potato and reported significant differences in root yield among the varieties tested. Abdissa et al. (2011) conclude that plant density has significant effects on marketable root yield. Other workers who have studied effects of the environment on yield and yield components include Etela and Anyanwu (2011) who also report significant differences between yields on different planting dates. Results from Parwada et al. (2011) suggest significant effects of ridge height and planting angle on root diameter and root yield. Such interactions are important in tropical environments, like Kenya, where rainy and dry seasons are unpredictable and differ in length and intensity. When combined with the effect of varied soil types in sweet potato growing regions the effects of the interactions are of significance. In Kenya, systematic multi-environment investigations on quantitative traits of sweet potato yield began in the 1990s as a collaborative project between the Kenya Agricultural Research Institute and the
International Potato Center (CIP). Some of the results of this work have been published by Ndolo et al. (2001) and Mcharo et al. (2001).Investigations using quantitative traits do present great challenges to the breeder. However, with increasing availability of robust statistical packages and high computing power it is now possible to more easily investigate interrelationships among the various yield components. Even though knowledge of the magnitude of G × E interactions has assisted breeders in making progress, advances have so far been slow and expensive because of the hexaploid nature of sweet potato. This study evaluated the yield levels and yield stability of superior sweet potato cultivars for release in Kenya. These results subsequently constitute the outcome of national sweet potato performance trials conducted over multiple production seasons (1997 to 2000) in four locations. This study is the first to document experimental results that has led to the first and so far only sweet potato variety release in Kenya.
MATERIALS AND METHODS
Two sets of sweet potato varieties were used in this multi-location study. In the first set, fourteen sweet potato varieties that included KEMB 10 as the local control (Table 1) were tested in field trials over four growing seasons from 1997 to 2000 in Nairobi, Kenya. The Nairobi location represented the Central Kenya sweet potato growing region. The second set, a subset of nine clones from the first set including Jayalo as the local control, was tested over two seasons from 1997 to 1998 in three sites (Kabondo, Ndhiwa, and Rongo) in Western Kenya. The trials in both locations were laid out as a randomized complete block design with three replications. In both locations, each replication consisted of plots of the test clones and another plot of the local control clone. The test clones were sourced from the International Potato Center breeding program, the Ugandan national breeding program, and local Kenyan landraces. Each plot consisted of 48 plants planted on rows at 12 plants per row. Thirty-centimetre long disease free vine tip cuttings were used as planting material. At planting, two thirds of the length of each cutting was buried into the ground, with an
inter-row spacing of 0.8 m and a within-inter-row spacing of 0.3 m. No fertilizers or pesticides were used during the crop growth period. The two middle rows were hand harvested three months after planting to obtain agronomic data. Foliage was cut from the plants at ground level and the roots removed from the soil using hoes. Dry matter content was determined within 24 hr of harvesting by cutting 200 g from the middle portion of the fresh roots into thin slices and placing them in open trays and dried in an oven at 70 °C until a constant dry
weight was achieved. This dry weight was then recorded and divided by the initial fresh weight to give percentage dry matter content. Marketability of roots was visually assessed based on general consumer demands that included roots with a diameter of at least 3cm and lesion free skin. Experimental field site data are presented in Table 2 (Jaetzold & Schmidt 1982; Jaetzold & Schmidt 1983). Samples of storage roots from each variety were boiled in separate pots following the local cooking procedures. The roots were then placed on separate plates on a table. An untrained panel of farmers and agricultural extension staff then
4916
assessed the cooked roots by tasting small portions of the cooked roots. Before tasting each variety, the panel members rinsed their mouths with water in order to avoid confounding the different tastes. Each panellist then rated each variety on a scale from 1 to 5, where 1 represented lowest palatability and 5 represented highest palatability. Each of the panel members also selected the best tasting variety by placing a marker next to the plate with the variety of choice. At the end of the evaluation the variety with the most number of markers was ranked best while the variety with the least number of markers was ranked last. Further group discussions were held to discuss the results and confirm if the results reflected their choices.
Data were analysed using MSTAT-C (1993) and STABLE (Kang & Magari 1995) statistical packages. Analysis of variance for individual and combined trial data followed the outline of Steel and Torrie (1980) and
Gomez and Gomez (1984). In order to overcome the genetic complexities of polyploids, many workers have over time developed various methods to determine effects of G × E interaction on traits of economic importance. Models that have been used to study G × E interactions in sweet potato include the Additive Main Effects and Multiplicative Interaction, or AMMI model, (Mwololo et al. 2009; Osiru et al. 2009). The GGE Biplot analysis is also a recent method on stability analysis that is gaining currency (Yan & Kang 2002). This study used Kang’s (1993) yield-stability statistic (YSi) to evaluate sweet potato genotypes. The YSi
statistic combines yield and stability of performance into a single selection criterion whose efficiency decreases the effects of researcher probability Type II errors on farmers’ yields (Kang & Magari 1995). Due to this versatility, the YSi statistic was used for this study
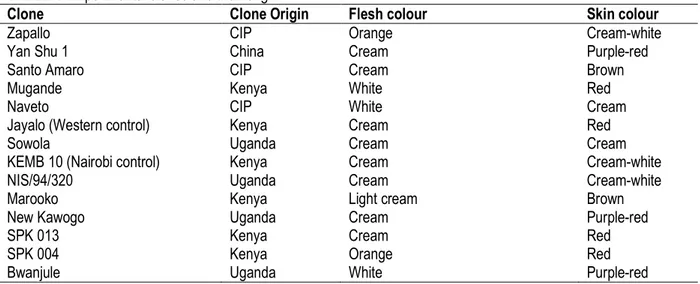
TABLE 1: Experimental clones and their origin
Clone Clone Origin Flesh colour Skin colour
Zapallo CIP Orange Cream-white
Yan Shu 1 China Cream Purple-red
Santo Amaro CIP Cream Brown
Mugande Kenya White Red
Naveto CIP White Cream
Jayalo (Western control) Kenya Cream Red
Sowola Uganda Cream Cream
KEMB 10 (Nairobi control) Kenya Cream Cream-white
NIS/94/320 Uganda Cream Cream-white
Marooko Kenya Light cream Brown
New Kawogo Uganda Cream Purple-red
SPK 013 Kenya Cream Red
SPK 004 Kenya Orange Red
Bwanjule Uganda White Purple-red
TABLE 2: Environmental conditions of the experimental sites
Nairobi Western Kenya
Kabondo Ndhiwa Rongo
Altitude (m.a.s.l) 1830 1400 1300 1400
Mean annual rainfall (mm) 1050 1500 1200 1700 Mean minimum temperature (oC) 16.4 20.5 20.8 20.5
Mean maximum temperature (oC) 17.4 21.7 22.7 21.7
Soil type Humic
nitosols
Chrome-luvic phaeozems
Pure vertisols and verto-luvic
phaeozems
4917
RESULTS
Tests of significance: In both locations, the clones exhibited significant differences in total root yield for genotypes and seasons (P = 0.01), while a significant genotype by season interaction at P = 0.01 was recorded only in Nairobi. Significant interactions for marketable root yield were recorded in both locations. Dry matter content exhibited significant season by location interactions in Western Kenya. These results show that the clones responded differently in the two environments.
Total root yield: In the Nairobi population, five varieties had root yields that were significantly higher than the mean. These varieties were Zapallo, Yan Shu 1, Santo Amaro, Mugande and Naveto (Table 3), and they all produced over 20,000 kg ha-1of total root yield. Among
the top five, it is only Mugande that was not an introduction from CIP. On the other hand, Bwanjule yielded less than 10,000 kg ha-1to rank as the poorest
yielder. Stability parameters for total root yield are presented in Table 3. Jayalo, KEMB 10, Mugande, New Kawogo, Santo Amaro, Sowola and Yan Shu 1 had regression coefficients not significantly different from slope (b) =1 and thus they were considered stable for total root yield. Bwanjule, SPK 013 and Zapallo had variance (s2
d) values significantly different from 0.
Based on Eberhart and Russell (1966) b and s2 d
statistics, the most desirable genotypes are Yan Shu 1, Santo Amaro and Mugande. According to Shukla’s (1972) δ2 statistic, KEMB 10, Mugande, New Kawogo,
NIS/94/320 and SPK 013 were the most stable. After adjusting for environmental factors (ŝ2), the previously
unstable Bwanjule and Zapallo were found to be stable. Although genotype, location, and season showed significant differences in Western Kenya, the interactions involving genotypes were not significant. These results suggest that the relative ranking of the genotypes was not affected by any environmental factors. Even though Jayalo, Mugande, Naveto, and KEMB 10 produced higher yields than the mean, none of the test clones gave higher yields than the local control Jayalo. While the yield of SPK 004 was significantly lower than that of the top three varieties, it
was stable across the environments. Stability parameters using Eberhart and Russell’s (1966) method suggest that all the genotypes are stable in Western Kenya. The statistics from Shukla (1972) suggest that Mugande, New Kawogo, and NIS/94/320 were unstable for root yield, but after adjusting for environmental factors only New Kawogo was found unstable. Jayalo, KEMB 10, Mugande, Naveto, and Sowola had a YSi greater than the mean of 3 and due
to their high yield and stability, were selected to be considered for release.
Marketable yield: The mean marketable yield for Nairobi was almost three times that realized in Western Kenya. Marketable yield, as a percentage of the total root yield, ranged from 85% at Bwanjule to 98% at Santo Amaro in Nairobi. These values suggest that the environment in Nairobi is suitable for uniform yields that facilitate one time harvesting after three months of growth. The proportion of marketable yield as a percentage of total root yield in the Western Kenya trials was much lower than in the Nairobi trials. The proportion ranged from 34% in SPK 004 to 48% in NIS/94/320 (Table 3).
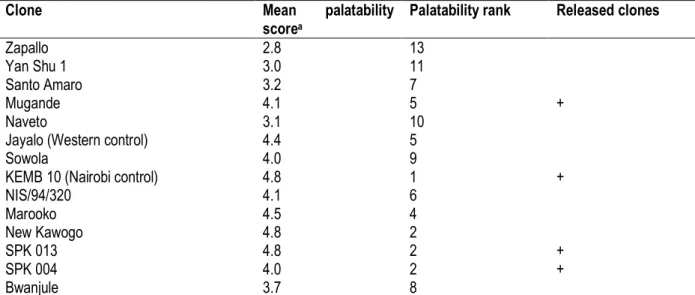
Dry matter content: The root dry matter content recorded in Western Kenya was 3% to 5% lower than that recorded in Nairobi. In Nairobi, Marooko recorded the highest root dry matter content followed by Jayalo and SPK 013. Other varieties that had higher dry matter than KEMB 10, the control, were Sowola and SPK 004. Although Jayalo had higher dry matter than KEMB 10 in Nairobi, its value was lower than that of KEMB 10 in Western Kenya. However, the differences between the two in each population were not significantly different. Palatability: KEMB 10, New Kawogo, and SPK 013 received the highest, and also equal, scores. Also, KEMB 10 was the best ranked followed by New Kawogo, SPK 013 and SPK 004, which tied in the second position. Mugande was sixth in terms of mean scores and fifth in ranking. On the other hand Zapallo, Yan Shu 1, and Naveto were the last three in terms of mean scores. These three varieties were also ranked last.
4918
TABLE 3: Stability and yield statistics for root yield components
Site Clone Yield statistics Total root yield
(kg ha-1) Marketable root yield (kg ha-1) Dry matter content (%) ba s2da δ2b ŝ2b YSi Nairobi Zapallo 1.78** 7.60* 371.61** 21.58 9c 26330 25570 21.01 Yan Shu 1 1.91 120.14 759.93** 415.65** 8c 23870 22130 25.40 Santo Amaro 0.85 15.74 38.61 50.10 15c 23660 23220 27.65 Mugande 1.06 10.46 14.88 31.71 13c 21290 20460 30.93 Naveto 1.54* 26.26 220.16** 86.90* 4 20720 20170 26.31 Jayalo 0.72 32.39 110.67** 108.32* 2 18060 17110 32.22 Sowola 0.94 1.49 6.32 0.21 9c 17840 16890 32.01 KEMB 10 0.88 11.58 24.27 35.60 6c 15720 14940 31.77 NIS/94/320 0.76* 4.92 33.12 12.24 5c 14400 13350 31.73 Marooko 0.44** 13.26 203.07** 41.38 -5 11950 11050 32.75 New Kawogo 1.07 8.43 10.99 24.55 2 11760 11260 30.35 SPK 013 0.73** 1.84* 35.81 1.46 1 11090 10650 32.15 SPK 004 0.86** 1.08 2.64 1.22 0 10930 10300 31.88 Bwanjule 0.46** 4.78* 174.18** 11.75 -10 6970 5930 28.61 Mean 4.2 L.S.D (P = 0.05) 3780 3700 2.51 CV % 27.86 28.70 10.47 Western Jayalo 1.36 7.17 40.78 23.45 9c 19890 8410 27.86 Mugande 1.53 1.12 50.03* 0.04 6c 18010 6210 25.44 Naveto 1.06 8.97 22.94 30.33 8c 17110 6870 23.75 KEMB 10 0.81 6.62 21.98 21.28 7c 15870 5850 28.33 Sowola 0.98 11.31 29.75 39.94 4c 14770 5080 27.03 New Kawogo 1.15 16.42 49.95* 59.08* -1 14300 5600 25.61 SPK 013 0.73 7.43 31.24 24.41 2 13910 5430 26.69 SPK 004 0.76 11.20 39.89 38.96 -2 12630 4310 26.71 NIS/94/320 0.63 9.13 47.69* 30.94 -6 9900 4800 27.83 Mean 3 L.S.D (P = 0.05) 3310 2150 2.60 CV % 33.04 55.77 14.82
a**, *b value significantly different from b=1; s2d >0 at P=0.01 and P=0.05 respectively (Eberhart and Russell, 1966) b**, * Significantly unstable at P=0.01 and P=0.05 respectively (Shukla, 1972)
4919
DISCUSSION
Total root yield: Results from this study showed wide variations among the clones for root yield performance. In a recent study using the AMMI model, Osiru et al. (2009) have found similar variations in yield stability among sweet potato genotypes with Tanzania (called KEMB 10 in Kenya) as one of the most stable ones. The mean of Kang’s yield-stability statistic YSi is 4.2
and, therefore, genotypes with a greater YSi were good
candidates for further assessment before release because they represented an optimal combination of high yields and stability. In another study, Mwololo et al. (2009) report that SPK 004 also was stable across a range of environments. Further assessment criteria were based on visual and palatability perceptions as presented in Table 4.
Marketable yield: The lower value of marketable yield in Western Kenya may have been due to the lower rainfall amounts recorded in the west. The lower rainfall contributed to a decrease in the rate of root expansion, and if harvesting was done during the fourth month, the proportion of marketable roots would have been much higher. It is worth noting that, this characteristic of a prolonged expansion period is not a disadvantage but is actually desirable in Western Kenya since most farmers harvest piecemeal, whether for home consumption or for sale in the local market. Similar to the results published by Abdissa et al. (2011), the significant differences in marketable yield provide opportunities for further progress in breeding and selection.
Dry matter content: We also observed variation in dry matter content, which is expected since the varieties had different origins. Tsegaye et al. (2007) also reported significant differences in dry matter content with its genetic variance contributing 43.04% of the phenotypic variance. In Kenya, high dry matter varieties with a mealy texture are preferred to low dry matter varieties. On the other hand, Mukhtar et al. (2010) did not find any significant effects of fertilizer on dry matter content.
Palatability: The best-ranked varieties have been selected by local farmers over many generations. Their superior performance in this study is, therefore, a reflection of their importance in the farmers’ farming enterprises and households. The factors that mainly
contributed to good palatability scores and ranking included high sugar content, high dry matter content, and low fibre content of the roots. Although New Kawogo and Marooko were ranked second and fourth respectively, using mean scores and palatability ranking, their poor agronomic characteristics denied them inclusion into the list of selected varieties.
In conclusion, at the time of conducting these trials no official variety release of sweet potatoes had been done in Kenya. Naveto performed well agronomically and it had an additional advantage of producing substantial foliage (Mcharo et al. 2001); however, it was not palatable to the consumers due to its bland taste. Despite New Kawogo having a high palatability rank, its yield was lower than that of the controls. Therefore, the varieties that were recommended for official release to farmers were Mugande, KEMB 10, and SPK 004. Mugande had an attractive red skin in addition to its large roots. In spite of KEMB 10 having relatively smaller roots, it had the advantage of being yellow fleshed and having a good taste (Ndolo et al. 2001). The yellow flesh indicates the presence of beta carotene. The deeper orange flesh of SPK 004 is an indication of even greater amounts of beta carotene (Hagenimana et al. 1998). Hagenimana et al. (1998) also show that SPK 004 contains high sugar content, significant amounts of beta carotene and cooks fast. These nutrition and visual factors make it a favourite among consumers (Ndolo et al. 2001). Morphological characteristics of this variety are described by Mwanga et al. (2007). Although high root yield is a major determinant for the adoption of a variety, a high root dry matter content is also critical among African consumers. Roots that have a high dry matter content are also preferable because of their crunchy texture. In the present study, and in Ndolo et al. (2001), KEMB 10, SPK 013, SPK 004, and Mugande were found to have acceptable dry matter content, high yield and acceptable taste. Therefore, KEMB 10 and Mugande were released in late 2000 for commercial production in Central Kenya while all these four varieties were released for production in Western Kenya. Currently, KEMB 10 is one of the dominant varieties being produced and consumed in Kenya.
4920
TABLE 4: Palatability assessment of roots
Clone Mean palatability
scorea
Palatability rank Released clones
Zapallo 2.8 13
Yan Shu 1 3.0 11
Santo Amaro 3.2 7
Mugande 4.1 5 +
Naveto 3.1 10
Jayalo (Western control) 4.4 5
Sowola 4.0 9
KEMB 10 (Nairobi control) 4.8 1 +
NIS/94/320 4.1 6 Marooko 4.5 4 New Kawogo 4.8 2 SPK 013 4.8 2 + SPK 004 4.0 2 + Bwanjule 3.7 8
aPalatability scores are based on a scale of 1 to 5 where 1 = very unpalatable and 5 = very palatable
ACKNOWLEDGEMENT
This study was supported by funds from the Agricultural Research Fund of the Kenya Agricultural Research Institute. Support from the International Potato Center, Sub-Saharan Africa, is acknowledged. Sammy Agili of
CIP-SSA is acknowledged. The authors appreciate Dr. Peter Ojiambo of North Carolina State University for his comments during the preparation of this manuscript.
REFERENCES
Abdissa T, Chali A, Tolessa K, Tadese F, Awas G, 2011. Yield and yield components of sweet potato as influenced by plant density in Adami Tulu Jido Kombolcha district, central Rift Valley of Ethiopia. American Journal of Experimental Agriculture 1: 40-48.
Anonymous, 1993. MSTAT-C. A microcomputer program for the design, management and analysis of agronomic research experiments. Michigan State University.
Çalişkan ME, Söğüt T, Boydak E, Ertük E, Arioğlu H, 2007. Growth, yield, and quality of sweet potato (Ipomoea batatas (L.) Lam.) cultivars in the south-eastern Anatolian and east Mediterranean regions of Turkey. Turkish Journal of Agriculture and Forestry 31: 213-227.
Eberhart SA. and Russell WA, 1966. Stability parameters for comparing varieties. Crop Science 6: 36-40.
Etela I. and Anyanwu NJ, 2011. Variation in fodder and tuber yields of three sweet potato varieties and the 48-h rumen dry matter degradation in N’dama steers. American-Eurasian Journal of
Agriculture and Environmental Science 11: 712-716.
Gomez KA. and Gomez AA, 1984. Statistical procedures for agricultural research. 2nd
Edition, John Wiley and Sons, U.S.A. 704pp. Grüneberg WJ, Manrique K, Zhang D, Hermann M,
2005. Genotype X environment interactions for a diverse set of sweet potato clones evaluated across varying ecogeographic conditions in Peru. Crop Science 45: 2160–2171.
Hagenimana V, K’Osambo LM, Carey EE, 1998. Potential of sweet potato in reducing vitamin A deficiency in Africa. In CIP Program Report, Lima, Peru. p 287-294.
Jaetzold R. and Schmidt H, 1982. Farm management handbook of Kenya Vol. II Part A. West Kenya MALD, Kenya. 397pp.
Jaetzold R. and Schmidt H, 1983. Farm management handbook of Kenya Vol. II Part B. Central Kenya. MALD, Kenya. 739pp.
Kang MS, 1993. Simultaneous selection for yield and stability in crop performance trials: consequences for growers. Agronomy Journal 85: 754-757.
4921
Kang MS. and Magari R, 1995. STABLE: A BASIC program for calculating stability and yield-stability statistics. Agronomy Journal 87: 276-277.
Mcharo T, Carey EE, Gichuki ST, 2001. Performance of selected Sweet potato varieties in Kenya. African Crop Science Journal 9: 49-57. Mukhtar AA, Tanimu B, Arunah UL, Babaji BA, 2010.
Evaluation of the agronomic characters of sweet potato varieties grown at varying levels of organic and inorganic fertilizer. World Journal of Agricultural Sciences 6: 370-373. Mwanga ROM, Odongo B, Niringiye C, Alajo A, Abidin
PE, Kapinga R, Tumwegamire S, Lemaga B, Nsumba J, Carey EE, 2007. Release of two orange-fleshed sweet potato cultivars, ‘SPK004’ (‘Kakamega’) and ‘Ejumula’, in Uganda. HortScience 42: 1728–1730.
Mwololo JK, Muturi PW, Mburu MWK, Njeru RW, Kiarie N, Munyua JK, Ateka EM, Muinga RW, Kapinga RE, Lemaga B, 2009. Additive main effects and multiplicative interaction analysis of genotype x environmental interaction among sweet potato genotypes. Journal of Animal and Plant Sciences 2: 148-155. Ndolo PJ, Mcharo T, Carey EE, Gichuki ST, Ndinya C,
Maling’a J, 2001. Participatory on-farm selection of sweetpotato varieties in western Kenya. African Crop Science Journal 9: 41-48. Osiru MO, Olanya OM, Adipala E, Kapinga R, Lemaga B, 2009. Yield stability analysis of Ipomoea batatas L. cultivars in diverse environments. Australian Journal of Crop Science 3: 213-220.
Parwada C, Gadzirayi CT, Sithole AB, 2011. Effect of ridge height and planting orientation on Ipomea batatas (sweet potato) production. Journal of Agricultural Biotechnology and Sustainable Development 3: 72-76.
Shukla GK, 1972. Some statistical aspects of partitioning genotype-environmental components of variability. Heredity 29: 237-245.
Steel RG. and Torrie JH, 1980. Principles and procedures of statistics. A biometrical approach. 2nd Edition, McGraw-Hill, New York.
633pp.
Tsegaye E, Dechassa N, Sastry EVD, 2007. Genetic variability for yield and other agronomic traits in sweet potato. Journal of Agronomy 6: 94-99.
Yan W. and Kang MS, 2002. GGE biplot analysis: A graphical tool for breeders, geneticists, and agronomists. CRC Press LLC, Boca Raton, Florida. 288pp.
Yildirim Z, TOKUŞOĞLU Ö, ÖZTÜRK G, 2011. Determination of sweet potato [Ipomoea batatas (l.) lam.] genotypes suitable to the Aegean region of Turkey. Turkish Journal of Field Crops 16: 48-53.