Decline of the Lunar Dynamo
by
Sonia M Tikoo
B.S. in Geology and History (Minor)
California Institute of Technology, 2008
ARCMES
MASSACHUSETTS INSTFMfrE OF TECHNOLOGY
'AR
03
2014
LIBRARIES
Submitted to the Department of Earth, Atmospheric and Planetary Sciences
in partial fulfillment of the requirements for the degree of
Doctor of Philosophy in Planetary Science
at the
MASSACHUSETTS INSTITUTE OF TECHNOLOGY
February 2014
© 2014 Massachusetts Institute of Technology. All rights reserved.
Signature of Author:
4"Department of Earth, Atmospheric and Planetary Sciences
n
November 4, 2013
Certified by:
61
Benjamin P. Weiss
Associate Professor of Planetary Sciences
Thesis Supervisor
Accepted by:
----
Robert D. van der Hilst
Schlumberger Professor of Earth Sciences
Head, Department of Earth, Atmospheric and Planetary Sciences
Decline of the Lunar Dynamo
By
Sonia M Tikoo
Submitted to the Department of Earth, Atmospheric and Planetary Sciences
on November 4, 2013, in partial fulfillment of the
requirements for the degree of
Doctor of Philosophy
ABSTRACT
Paleomagnetic investigations of extraterrestrial samples provide an avenue to test for the
presence of ancient core dynamos on planetary bodies. If a core dynamo was indeed present,
determining the lifetime of the magnetic field informs about the nature of the dynamo generation
mechanism, which in turn may provide constraints for the body's thermal (for convection-based
dynamos) and dynamical history (for precession-based dynamos). Several recent paleomagnetic
studies have demonstrated the existence of a robust core dynamo (generating surface fields of
tens of pT) on the Moon between at least 4.2 and 3.56 billion years ago (Ga). An outstanding
question is when the lunar core dynamo actually ceased. The presence of unstable alternating
field (AF) demagnetization behavior has hindered interpretation of the magnetic remanence
present in many young lunar samples. In this thesis, I demonstrate that the lack of stable
magnetic remanence in many lunar samples may be attributed to their poor magnetic recording
properties. I develop a method to determine the minimum magnetizing field strength that a
sample is capable of having accurate paleomagnetic records retrieved from using AF methods.
This method is then used to place constraints on the surface field strength of the lunar core
dynamo after 3.56 Ga. Paleomagnetic data from several mare basalts indicates that the lunar
dynamo surface dynamo field had declined to <4 pT by 3.19 Ga. A lunar breccia may record
evidence for a core dynamo field of at least -770 nT at its formation age (<3.3 Ga).
Samples acquire shock remanent magnetization (SRM) when impact shock waves
propagate through rocks in the presence of an ambient magnetic field. In this thesis I investigate
the magnetic behavior of SRM at pressures <2 GPa to assess its stability over geologic
timescales.
Thesis Supervisor: Benjamin Weiss
Acknowledgements
I owe an immense debt of gratitude to countless people for making this thesis possible, but no
one deserves more credit than Benjamin Weiss. I still remember the first day Ben led me into our laboratory clean room and introduced me to my first lunar sample. Its name was 15556, and
I couldn't wait for it to tell me its secrets. Five years, eleven moon rocks, and four meteorites
(plus a few Earth rocks here and there) later, my excitement only grows stronger. Over time, I think I have absorbed ever-increasing doses of Ben's relentless optimism: any magnetic mystery, no matter how confounding, can and will be solved with calm, focused determination and consistent effort. Ben has a resolute faith in the abilities of his students and this makes him an exceptionally inspirational teacher. I am fortunate to have had the opportunity to learn from him.
I could not have asked for a better mentor.
I thank Jr6me Gattacceca, Timothy Grove, Maria Zuber and Lindy Elkins-Tanton for their
contributions to my education and development as a scientist. I also thank David Shuster, William Cassata, C6cile Cournede, Francis Nimmo, Ian Garrick-Bethell, and Michael Fuller for their collaborative scientific contributions to my thesis projects.
In addition to Ben and J6rome, I am eternally grateful for my other amazing compatriots in the MIT Paleomagnetism Laboratory, particularly Eduardo 'Chuck Norris' Lima, Laurent Carporzen, Clement Suavet, Roger 'Triple J' Fu, Kyle Bradley, Veronica Hanus, Brenda Carbone, and the 'Moon Girls' Jennifer Buz, Erin Shea, and Gabi Melo. They taught me so much and provided me with invaluable support and camaraderie throughout my graduate studies. Amanda Zangari, Michael Sori, Stephanie Brown, Anton Ermakov, Alex Evans, Benjamin Black, Christina Dwyer, Hyungmin Park, and many others deserve thanks for their friendship and assistance over the years.
I thank Joseph Kirschvink, Robert Kopp, and Timothy Raub for providing me with my first
research experiences and motivating me to pursue graduate studies.
I am absolutely indebted to my parents. They inadvertently encouraged me to pursue planetary
science by buying me countless books about the solar system and forcing me to watch every Star Trek episode and movie. Their fervent belief that I could accomplish absolutely anything that I put my mind to propelled me to follow my dreams.
Finally, I thank my very dear husband Chris for his tireless patience, love, support, companionship, programming help, and occasional engineering wizardry.
Table of Contents
Title page 1 Abstract 3 Acknowledgements 5 Table of Contents 7 Chapter 1. Introduction Main Text 9 References 12Chapter 2. Magnetic fidelity of lunar samples and implications for an ancient core dynamo.
Abstract 13
1. Introduction 14
2. Description of analyzed lunar samples 17
2.1. Petrologic descriptions 17
2.2. Domain state 18
2.3. Rock magnetic studies 18
3. Natural remanent magnetization 19
3.1. Methodology 19 3.2. Mare basalt 15556 20 3.3. Mare basalt 15016 21 3.4. Mare basalt 12017 22 3.5. Mare basalt 10020 22 3.6. Summary 23 4. Paleointensity studies 23 4.1. Introduction 23 4.2. NRM paleointensity results 23
4.3. Paleointensity limit tests 24
4.4. Implications for Apollo-era paleointensity methods 25
5. Zig-zag behavior 27 6. Discussion 29 7. Conclusions 31 Acknowledgements 32 References Cited 33 Figures 1-8 36
Chapter 3. Decline of the lunar core dynamo
Abstract 45
Main Text 46
Acknowledgements 51
References and Notes 52
Figures 1-3 54
Chapter 4. How long did the lunar core dynamo persist?
Abstract 57 Main Text 58 Acknowledgements 63 References Cited 63 Figures 1-3 66 Tables 1-2 69 Supplementary Information 71
Chapter 5. Thermal demagnetization of shock remanent magnetization and implications for interpreting the paleomagnetism of shocked samples
Abstract 73
1. Introduction 74
2. Samples and Methods 75
2.1. Samples and handling 75
2.2. PRM acquisition 75 2.3. Magnetic analysis 77 3. Results 77 3.1. PRM acquisition 77 3.2. AF demagnetization of PRM 78 3.3. Thermal demagnetization of PRM 79
3.4. Comparison of PRM to other remanences 80
4. Discussion 80
4.1. AF versus thermal demagnetization for removing SRM overprints 80 4.2. Mechanism behind PRM acquisition and implications for its thermal stability 81
4.3. Thermal stability of SRM 84 7. Conclusions 86 Acknowledgements 87 References Cited 87 Figures 1-7 92 Tables 1-2 98 Appendices
Appendix A (Supplementary Material for Chapter 2) 101
Chapter 1:
Introduction
Since the discovery of lodestone over two millennia ago, magnetic fields have intrigued
humanity. The invention of the magnetic compass facilitated human exploration and expansion
across continents, which in turn spurred development and trade. An invisible force ushered
mankind into the modem era.
For hundreds of years, no one knew why compasses pointed
north-some even believed that the star Polaris itself attracted the magnetite needle! The field of
geomagnetism arose when William Gilbert published his treatise, De Magnete, in 1600.
Through a series of experiments, Gilbert discovered that the Earth itself was essentially
magnetic. Hundreds of years after Gilbert, we know much more about the Earth's magnetic
field. We know about how it is generated, its intensity, its orientation, how it is preserved in the
rock record, and even its propensity to reverse its polarity on occasion. We know that for
billions of years, the geomagnetic field has shielded the Earth from the solar wind, protecting us
from radiation and atmospheric escape which might reduce our planet's habitability over time.
Only three terrestrial bodies in our solar system possess active, internally-generated, core
dynamo magnetic fields: Earth, Mercury, and Ganymede. Some natural questions that follow
are: What other planetary bodies are capable of generating a long-lived core dynamo magnetic
field? What would the field generation mechanism be for those bodies? How long can dynamos
persist on smaller bodies? In this thesis, I explore the magnetic history of our nearest neighbor,
the Moon, in an effort to answer these questions.
In order for a planetary body to have a core dynamo field, it is first necessary for that
body to have a core. Prior to the Apollo era, it was not known whether the Moon was a
differentiated body or whether it was an undifferentiated remnant from the early solar system.
Differing hypotheses abounded amongst the most prominent minds of the day: Harold Urey
believed the Moon had a cold origin while Gene Shoemaker, on the other hand, thought that the
Moon had a hot origin. One of the first pieces of robust evidence to challenge the idea of a cold,
undifferentiated Moon was the initial observation of magnetization in the lunar crust from
Apollo surface magnetometers. Not long after, returned lunar samples were also found to carry
natural remanent magnetization (NRM) by a first wave of paleomagnetic analyses (Fuller and
Cisowski, 1987).
These discoveries raised the possibility that not only was the Moon
differentiated, but that furthermore, it may have once generated a core dynamo magnetic field.
Since the Apollo-era measurements, a variety of geophysical data have emerged in
support of a differentiated Moon, but the hypothesis of an ancient lunar core dynamo was met
with several key challenges. First, thermal convection alone was modeled to be incapable of
sustaining a lunar core dynamo past 4.1 billion years ago [e.g., Stegman et al. (2003)]. Second,
several models have shown that impact events may be capable of generating transient magnetic
fields which could potentially last up to 1 day for the largest, basin-forming impacts (Hood and
Artemieva, 2008; Srnka, 1977). The Apollo-era paleomagnetic studies, while integral towards
understanding lunar magnetism, were not able to completely rule out alternative field sources for
the magnetization in lunar rocks and demonstrate the existence of an ancient core dynamo.
A second generation of lunar paleomagnetic studies, spurred by advances in
instrumentation and method development, has since confirmed the existence of a lunar core
dynamo with surface fields ranging between 30-110 pT (on the order of the modem terrestrial
field strength) between ~4.2 and 3.56 billion years ago (Ga) (Cournede et al., 2012;
Garrick-Bethell and Weiss, 2013; Garrick-Garrick-Bethell et al., 2009; Shea et al., 2012; Suavet et al., 2013).
Such high paleointensities prior to -3.6 Ga are broadly consistent with the Apollo-era
paleointensity record. However, the Apollo-era data shows a marked drop-off in paleofield
strength after 3.6 Ga. This sudden decline raises the following questions: Did the lunar core
dynamo cease after 3.56 Ga (the eruption of the high-K mare basalts-the last samples to show
robust evidence for a core dynamo) or did the dynamo persist beyond this date? Are we unable
to retrieve robust evidence for a dynamo after 3.56 Ga because the dynamo had ceased, or are
there some intrinsic properties of some lunar samples which inhibit retrieval of stable
paleomagnetic records?
Chapter 2 of this thesis, entitled "Magnetic fidelity of lunar samples and implications for
an ancient core dynamo" addresses these issues directly. In this chapter, I show that the rock
magnetic properties of most lunar samples (the presence of dominantly multidomain,
low-coercivity magnetic carriers) make them especially susceptible to spurious anhysteretic remanent
magnetization (ARM), which may be acquired by samples during standard alternating field (AF)
demagnetization and paleointensity experiments. Spurious ARM acquisition, in combination
with high magnetic anisotropy in some lunar samples prevents the retrieval of accurate
magnetization directions and paleointensities from samples which may have been originally magnetized in weak (<30 pT) magnetic fields when they formed. In this chapter, I develop a test to determine the minimum paleofield strength (i.e., the magnetic fidelity limit) for which reliable paleointensity determinations may be retrieved from samples
In Chapter 3, entitled "Decline of the lunar core dynamo", I present the results of a paleomagnetic study on two young mare basalts, 15597 (-3.3 Ga) and 12022 (3.19 Ga), with high magnetic fidelities. I use the techniques I developed in Chapter 1 to show that their rock magnetic properties allow for accurate retrieval of paleointensities down to <7 pT and <4 gT. However, the absence of stable remanent magnetization attributable to a dynamo magnetic field in these samples indicates that lunar surface fields had declined to below 4 pT by 3.19 Ga. I show that such a drop in paleointensities indicates an at least four orders of magnitude drop in available power at the lunar core-mantle boundary between 3.56 and 3.19 Ga.
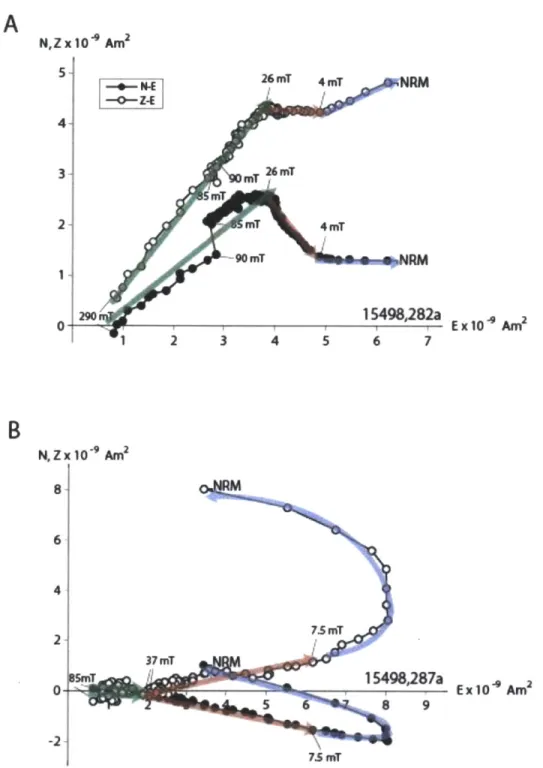
In Chapter 4, entitled "How long did the lunar core dynamo persist?", I study 15498, a young lunar breccia. Age determinations for this sample are currently in progress, but an upper limit age of -3.3 Ga can be established from the presence of Apollo 15 mare basalt fragments in its glassy matrix. Sample 15498 has a stable magnetic remanence which was acquired in a field of -770 nT - 2 pT. The minimum retrieved formal paleointensity value is more than twice as high as the strongest crustal field ever measured from Apollo surface magnetometers, and it is at least a factor of 200 greater than the ambient fields measured at the Apollo 15 landing site. Therefore, our preliminary data suggest that the lunar core dynamo may have persisted even beyond -3.3 Ga. Such a long-lived lunar magnetic field would present a challenge to dynamo theory and encourage further research into non-traditional dynamo power mechanisms such as mantle precession or core crystallization.
Beyond the lunar sample studies, I have also explored another facet of extraterrestrial paleomagnetism. When an impact shock wave passes through a rock in the presence of an ambient magnetic field, the rock will acquire a magnetic remanence termed shock remanent magnetization (SRM). A mystery that has surrounded SRM is that, while it has been produced in laboratory environments for decades, it has not often been observed in natural samples. One hypothesis is that SRM might experience substantial viscous decay over time and therefore not survive over geologic timescales. In Chapter 5, entitled "Thermal demagnetization of shock remanent magnetization and implications for interpreting the paleomagnetism of shocked
samples," I conducted thermal demagnetization experiments on pressure remanent magnetization
(PRM), a hydrostatic analog for SRM, to assess its stability over geologic timescales for a
variety of magnetic mineralogies.
I found that SRM can persist to very high unblocking
temperature in the vicinity of the Curie points of the magnetic carrier minerals. The
time-temperature relationships for these minerals indicate that SRM should survive for potentially
billions of years in the geologic record. However, I also find that many samples have low SRM
acquisition efficiencies relative to other forms of magnetic remanence. Therefore, it may be
difficult to deconvolve a weak SRM signal from demagnetization data where other more intense
primary or secondary remanences may co-exist.
Understanding the history of natural samples is akin to a forensic investigation. With
each new development, new questions arise: If the lunar core dynamo field had not ceased by
3.3 Ga, when did it meet its end? What was its power source? Will we find incontrovertible
evidence for naturally occurring shock remanent magnetization in a lunar rock, a meteorite, or at
a terrestrial impact crater? With the study of additional samples, we will almost certainly
continue to piece together these mysteries and more.
References Cited
Coumede, C., Gattacceca, J. and Rochette, P., 2012. Magnetic study of large Apollo samples:
Possible evidence for an ancient centered dipolar field on the Moon. Earth Planet. Sci.
Lett., 331-332: 31-42.
Fuller, M. and Cisowski, S.M., 1987. Lunar paleomagnetism. Geomagnetism, 2: 307-455.
Garrick-Bethell, I. and Weiss, B.P., 2013. New lunar magnetic field paleointensity estimate from
troctolite 76535. Proc. Lunar Sci. Forum.
Garrick-Bethell, I., Weiss, B.P., Shuster, D.L. and Buz, J., 2009. Early lunar magnetism.
Science, 323: 356-359.
Hood, L.L. and Artemieva, N.A., 2008. Antipodal effects of lunar basin-forming impacts: Initial
3D simulations and comparisons with observations. Icarus, 193: 485-502.
Shea, E.K. et al., 2012. A long-lived lunar core dynamo. Science, 335: 453-456.
Smka, L.J., 1977. Spontaneous magnetic field generation in hypervelocity impacts. Proc. Lunar
Planet. Sci. Conf. 8th 785-792.
Stegman, D.R., Jellinek, A.M., Zatman, S.A., Baumgardner, J.R. and Richards, M.A., 2003. An
early lunar dynamo driven by thermochemical mantle convection. Nature, 421: 143-146.
Suavet, C. et al., 2013. Persistence and origin of the lunar core dynamo. Proc. Natl. Acad. Sci.
Chapter 2:
Magnetic fidelity of lunar samples and implications for an
ancient core dynamo
Published as: Tikoo et al. (2012) Earth and Planetary Science Letters (337-338) 93-103.
This research was conducted in collaboration with Benjamin P. Weiss, Jennifer Buz, Eduardo A. Lima, Erin K. Shea, Gabi Melo, and Timothy L. Grove.
Supplementary Material for this chapter is contained in Appendix A.
Abstract
Some lunar rocks have stable magnetizations that provide compelling evidence for an ancient lunar core dynamo. However, a longstanding problem has been interpreting the unstable alternating field (AF) demagnetization behavior observed in the remaining majority of the Apollo lunar sample suite. Similar unstable behavior has also been observed for many meteorites. It is unclear whether the behavior of these samples indicates that they formed in the absence of an ancient magnetizing field or whether they simply have poor magnetic recording properties. It is necessary to distinguish between these two possibilities in order to determine whether paleomagnetic fields were present on a sample's parent body. To address this issue, we analyzed five samples whose rock magnetic properties span the full suite of observed demagnetization behaviors: mare basalts 15556, 15016, 12017, 10020, and troctolite 76535. We demonstrate that the effects of spurious anhysteretic remanent magnetization (ARM) during AF demagnetization, in combination with multidomain magnetic carriers and magnetic remanence anisotropy, are likely responsible for the apparently poor magnetic behavior of lunar samples. Spurious ARM may also explain the observation of high (> 1 IT) Apollo-era paleointensity measurements for samples thought to have formed after the cessation of a lunar core dynamo. Therefore, the unstable AF demagnetization behavior observed for many lunar samples is not alone sufficient for ruling out the presence of an ancient lunar core dynamo.
1. Introduction
A central question in lunar science is whether the Moon fully differentiated and formed a
liquid metallic core. Moment of inertia data (Konopliv et al., 1998) and the lunar induced
magnetic dipole moment (Hood et al., 1999) support the existence of a 220-450 km radius iron
core, while Apollo seismic data provide evidence for a 240 km radius solid inner core (Weber et
al., 2011), surrounded by a 330-365 km radius liquid outer core (Garcia et al., 2010; Weber et al.,
2011). Magnetic studies provide another means to test for a lunar core through the identification
of a paleomagnetic field: the detection of remanent magnetization in the lunar crust (Dyal et al.,
1970) and in returned Apollo samples (Fuller and Cisowski, 1987) indicate that the Moon may
have once possessed a dynamo magnetic field and, by implication, a molten, advecting metallic
core (Garrick-Bethell et al., 2009).
The existence of an ancient lunar dynamo is broadly
consistent with a hot lunar origin (Pritchard and Stevenson, 2000; Runcorn, 1996). It also would
have implications for the physics of dynamo generation because a prolonged and strong lunar
field would likely require nontraditional power sources (Dwyer et al., 2011; Wieczorek et al.,
2006; Wieczorek et al., 2011).
Although it has been known for decades that lunar rocks are magnetized, only recent
studies have clearly determined that the magnetizing fields resulted from a core dynamo rather
than from other field-generating mechanisms. In particular, a key proposed alternative to the
core dynamo hypothesis is that lunar paleofields were transiently produced or amplified by
currents in meteoroid impact-generated plasmas (Hood and Artemieva, 2008; Srnka, 1977). To
address this ambiguity, Garrick-Bethell et al. (2009) and Shea et al. (2012) analyzed the
paleomagnetism of samples unlikely to have recorded any impact-generated fields, 4.2 billion
year old (Ga) lunar troctolite 76535 and the 3.7 Ga mare basalt 10020. These rocks cooled from
their Curie points to ambient temperatures over timescales greatly exceeding the expected
duration of even the longest lived impact-generated magnetic fields (lasting ~1 day)
(Garrick-Bethell et al., 2009). These samples exhibit no petrographic evidence for shock effects (peak
pressures <5 GPa), demonstrating that they are unlikely to have recorded transient magnetic
fields via the shock remanent magnetization (SRM) process. Both samples contain a natural
magnetization (NRM) with a high coercivity component that is unidirectional across mutually
oriented subsamples and which monotonically decays to the origin during demagnetization
experiments (Garrick-Bethell et al., 2010). The stable magnetization components of 76535 and
10020 were acquired in fields of at least 1 pT and probably several tens of pT (Garrick-Bethell et al., 2010). The lower end of this range is consistent with the expected ~15-20 pT upper limit for surface fields from an ancient lunar dynamo operating in a small (~375 km radius) lunar core assuming magnetostrophic balance (Wieczorek et al., 2006). These data collectively suggest that the characteristic magnetization components in these samples are thermoremanent magnetizations (TRM) obtained by cooling from the Curie point in the presence of a stable long-lived paleofield like that from a core dynamo.
The problem addressed in the present study is that the stable NRM of 76535 and 10020 are exceptional when compared to other lunar samples. Most lunar rocks subjected to paleomagnetic studies display low fidelity NRM behavior during alternating field (AF) demagnetization experiments, characterized by non-monotonic decline of magnetization intensity and rapidly varying magnetization directions (Brecher, 1976; Hoffman and Banerjc, 1975). Such behavior makes it difficult to determine whether the observed magnetization was acquired in the presence or absence of a core dynamo field. The AF demagnetization procedure itself has been proposed to be responsible for much of this behavior. A frequent problem is that samples acquire spurious (i.e., unintended) anhysteretic remanent magnetization (ARM), which manifests as unstable moment directions and non-monotonic changes in NRM intensity during a series of AF steps [see Fig. 1 of Weiss et al. (Weiss et al., 2010)]. Another less common problem which may result in poor AF demagnetization behavior is the acquisition of gyroremanent magnetization (GRM) (Hu et al., 1998; Stephenson, 1980; Stephenson, 1993). GRM is a laboratory-produced component specific to single-domain (SD) or SD-like particles that is acquired perpendicularly to the preferred easy axis orientation as well as to the axis of the last AF application (Dunlop and Ozdemir, 1997) and grows monotonically with peak AC field during AF demagnetization [see Fig. A5 of Garrick-Bethell et al. (Garrick-Bethell et al., 2009)].
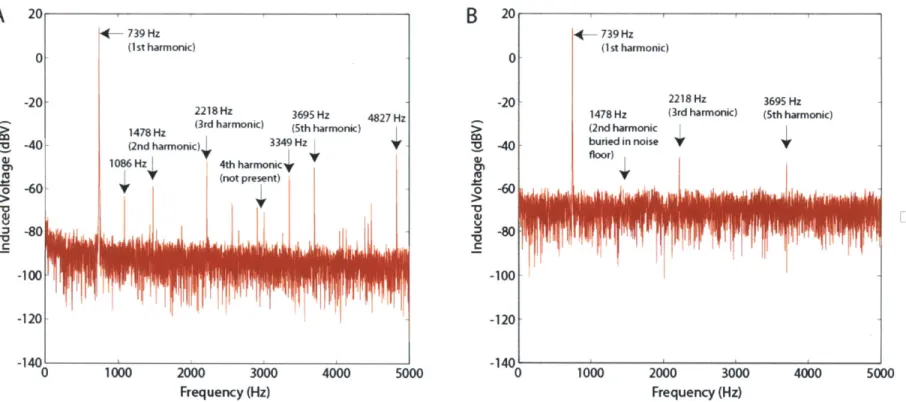
ARM noise is generated by the presence of even harmonics in the AF waveform during demagnetization (Collinson, 1983) due to harmonic distortion in oscillator and amplifier stages or spurious waveforms appearing at non-harmonic frequencies caused by interference (see Appendix A, Fig.la, Fig. Al, Fig. A2). The sum of the fundamental wave and the second harmonic or another contaminating frequency often creates asymmetry of the positive and negative peak values of the waveform, leading to the acquisition of ARM. This unintended ARM can be acquired along all three orthogonal axes by grains with coercivities up to that of the
peak AC field of the AF step. Depending on the stability of the AF waveform spectrum, repeat
AF applications at the same peak AC field may produce scatter in the NRM direction, suggesting
that spurious ARM results from noise in the AF waveform and is not readily predictable. The
magnitude of spurious ARM typically increases with AF amplitude because the magnitude of the
second harmonic itself increases with AF amplitude.
Kamacite- and taenite-bearing materials like lunar rocks and many meteorites are
primarily multidomain due to the small single domain stability range of these minerals. Spurious
ARM is especially problematic for multidomain samples because they are dominated by low
coercivity grains (e.g. Nagata et al., 1973; Weiss et al., 2010): as demagnetization proceeds to
higher AF amplitudes, the magnitude of the primary magnetization in the sample decreases while
the net moment becomes increasingly overpowered by spurious ARM acquired by
low-coercivity grains (Fig. lb). On the other hand, spurious ARM is rarely encountered in terrestrial
paleomagnetic studies because iron oxides like magnetite and hematite much more commonly
form pseudo single domain and smaller grains. The lack of noticeable adverse effects caused by
nonideal AF demagnetization in terrestrial samples likely accounts for why the full implications
of spurious ARM for paleomagnetic studies have not been previously appreciated.
Another related source of unstable AF demagnetization has been ascribed to "textural
remanence" in which the NRM is controlled by magnetic anisotropy resulting from foliated or
lineated magnetic fabrics in samples. Such fabrics may originate from shock or primary igneous
processes. These effects can be dramatically expressed as pinning of the NRM vector during
demagnetization (zig-zag demagnetization) along an axial direction or within a plane (Brecher,
1976; Brecher, 1977; Hoffman and Banerjee, 1975).
Unstable demagnetization behavior, observed in many lunar samples as well as
iron-bearing meteorites (Table Al), makes it difficult to pinpoint the origin of magnetization in these
samples. Therefore, it is important to assess the magnetic recording fidelity of such samples
before attempting to ascertain whether they were formed in the presence or absence of a dynamo
field. With this goal, we studied the AF demagnetization behavior and magnetic recording
capacities of lower-fidelity mare basalts 15556, 15016, and 12017 which were previously
observed to exhibit spurious AF demagnetization behavior, as well as high fidelity samples
76535 (Garrick-Bethell et al., 2009) and 10020 (Shea et al. 2012). We show that the unstable
demagnetization behaviors observed for 15556, 15016, and 12017 likely result from the
combined effects of multidomain magnetic carriers, magnetic anisotropy, and spurious ARM. We conclude that while the unstable demagnetization data for 15556, 15016, and 12017 clearly do not provide evidence for the presence of a lunar dynamo at 3.2-3.4 Ga, they also do not require the absence of a dynamo-generated magnetic field on the Moon at this time.
2. Description of analyzed lunar samples
2.1. Petrologic descriptions
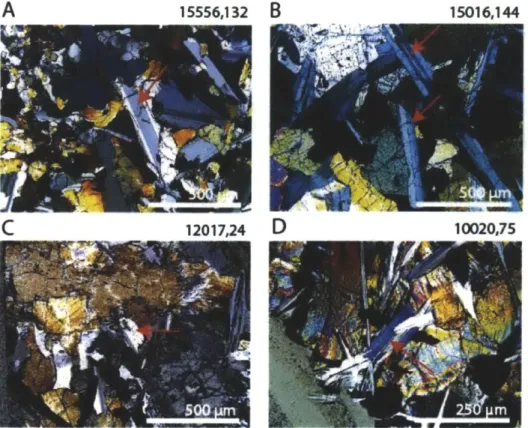
15556 is a fine-grained, highly vesicular, olivine-normative basalt (Meyer, 2008; Ryder, 1985) with an 40Ar/39Ar age of -3.4 Ga (Kirsten et al., 1972). It was collected -60 m northeast of the rim of Hadley Rille (McGee et al., 1977). Our petrographic analyses (see Appendix A) found no evidence of shock, implying peak shock pressures <5 GPa: plagioclase crystals do not show any mechanical twinning, fracturing, or alteration to maskelynite, and there is no undulatory extinction in olivine (Fig. A3a). Thermomagnetic curves identified kamacite (Feo.94. o.9 6Nio.o4-0.06) as the main ferromagnetic constituent in 15556 (Nagata et al., 1972; Nagata et al.,
1973). Our elemental abundance analyses of metal grains using a JEOL-JXA-8200 electron microprobe at the Massachusetts Institute of Technology found that kamacite occurs as isolated 2-30 pim diameter blebs (Feo.94Nio.o6) as well as ~5 pm diameter grains of nearly pure iron
intergrown with troilite (Table A2).
15016 is a medium-grained, highly vesicular, olivine-normative basalt (Meyer, 2008; Ryder, 1985) with Rb/Sr and 40Ar/39Ar ages of 3.3-3.4 Ga (Evensen et al., 1973; Kirsten et al., 1972). 15016 does not show any petrographic evidence of shock (peak shock pressure < 5 GPa) (Fig. A3b). Our microprobe analyses identified 2-3 pm diameter metallic iron associated with troilite as well as 10 pim diameter free kamacite (Feo.87-0.93Nio.07_0.13) (Table A2).
12017 is a medium-grained pigeonite basalt (Meyer, 2008; Warner, 1970) lacking shock features (Fig. A3c) with an 40Ar/39Ar age of 3.2 Ga (Horn et al., 1975). The basalt is coated on one side with an impact glass estimated to be ~4-20 thousand years (ky) old (Fleischer et al., 1971; Morrison et al., 1973) (Table A2). The subsamples used in our paleomagnetic experiments were taken from basaltic (12a2, l2alc, and 13bl) and glass (12b, 13a2, and 59) lithologies. In the basalt portion, our microprobe analysis identified 3-5 pm metallic iron blebs in troilite, as well as 50 pim free metal grains with composition Feo.99Nio.o. The glass portion
contained 20 pm blebs of iron phosphide with < 1 pm iron sulfide inclusions. Furthermore,
<1
pm blebs of kamacite were distributed throughout the glass (Table A2). The latter grains were
too small for accurate quantitative elemental analyses.
10020 is an apparently unshocked (peak shock pressure
<
5 GPa) (Fig. Ai d), fine-grained
low-K ilmenite basalt (Kramer et al., 1977; Meyer, 2008) with an 4Ar/39Ar age of 3.72 Ga
(Geiss et al., 1977; Guggisberg et al., 1979). Our microprobe analysis identified 0.1-5 Pm
metallic iron (negligible Ni content) blebs in troilite (Table A2).
76535 is an apparently unshocked (peak shock pressure < 5 GPa), coarse-grained troctolite
(Meyer, 2008) dated to 4.2 Ga using a variety of chronometers [see Garrick-Bethell et al.
(Garrick-Bethell et al., 2009)]. The sample contains kamacite and taenite as free blebs and as
inclusions in plagioclase [see Garrick-Bethell et al. (Garrick-Bethell et al., 2009)].
2.2. Domain state
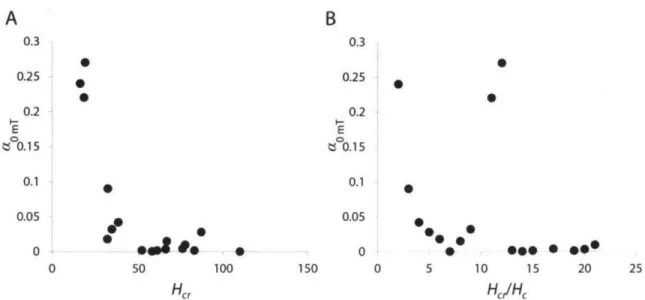
We assessed the domain state of samples 15556, 15016, 12017, and 10020 by measuring
hysteresis loops and first order reversal curves [FORCs; see (Pike et al., 1999)] (see Appendix
A).
Ratios of saturation remanent magnetization (Ms) to saturation magnetization (M) and
remanent coercivity (Her) to coercivity (H) (Dunlop, 2002a; Dunlop, 2002b) and FORC
distributions indicate that all four samples are predominantly multidomain (Figs. A4 and A5 and
Table A3), consistent with previous studies (Gattacceca et al., 2010; Nagata et al., 1972; Nagata
et al., 1973; Pearce et al., 1973); Shea et al., 2012). Previous hysteresis studies also indicated a
dominantly multidomain grain size for 76535 (Garrick-Bethell et al., 2009) (Table A3). While
10020 and 76535 have an average grain size in the multidomain range, their hysteresis
parameters (higher Mrs/Ms, lower Her/He) suggest that they are less coarse-grained than samples
with poor NRM demagnetization behavior (15556, 15016, and the 12017 basalt; see Section
3.2-3.4) (Fig. 2). This relationship is confirmed by our FORC analyses, which indicate that 10020
has an additional population of higher coercivity grains relative to 15556, 15016, and the 12017
basalt. (Fig. A4).
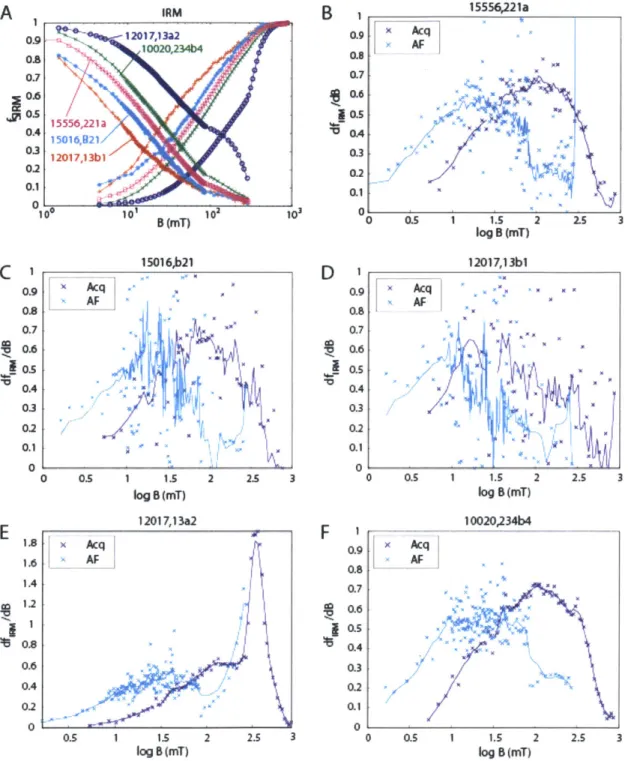
We conducted a variety of rock magnetic experiments on 15556, 15016, 12017, and 10020 to characterize magnetostatic interactions, their coercivity spectra, and their median destructive fields (MDFs) (see Appendix A). Paleomagnetic and rock magnetic remanence experiments were conducted using a 2G Enterprises Superconducting Rock Magnetometer 755 equipped with automated sample handling and demagnetization equipment (Kirschvink et al., 2008) in a magnetically shielded room (field < 200 nT) housed in the MIT Paleomagnetism Laboratory (http://web.mit.edu/paleomag). The magnetometer has a sensitivity of to ~1x10-12 Am2 , at least 2 orders of magnitude lower than nearly all magnetic moments measured here. Four readings of magnetic moment were made and averaged for each measurement, and circular standard deviations were typically < 2'. Samples which exhibit spurious AF demagnetization (15556, 15016, and 12017; see Section 3.2-3.4) display lower remanent coercivities and median destructive fields for ARM and isothermal remanent magnetization (IRM) than 10020 and the 12017 glass, which have stable demagnetization patterns (Section 3.4-3.5) (Table A4 and Fig. A6). These results are consistent with the hysteresis properties (Section 2.2), which suggest that low magnetic fidelity samples (i.e. 15556, 15016, and the 12017 basalt) contain a larger fraction of multidomain magnetic carriers than high fidelity samples 10020 and the 12017 glass (see Section 4.3).
The low remanent coercivities and MDFs of samples 15016 and the 12017 basalt mean that their putative primary TRM (if present) may have been partly demagnetized by shock during impact excavation, because shock pressures of just 2 GPa can demagnetize grains with coercivities up to -30 mT (Gattacceca et al., 2008). On the other hand, higher coercivity samples like 10020 and the 12017 glass should still be able to retain some primary TRM (if present), even if they have experienced some shock effects.
3. Natural remanent magnetization
3.1. Methodology
We studied the NRM behavior of mutually oriented subsamples of 15556, 15016, 12017
(basalt and glass portions), and 10020. We used AF rather than thermal demagnetization because the former should more efficiently remove secondary IRM and SRM overprints which are blocked by coercivity rather than blocking temperature. Such overprints have been
ubiquitously observed in lunar samples. Thermal demagnetization associated with the Thellier-Thellier paleointensity method is also disadvantageous because it typically causes alteration of the metallic magnetization carriers in lunar rocks.
All subsamples except those from 12017 were taken from the non-space-weathered
interiors of their parent rocks. The samples were subjected to identical progressive three axis AF demagnetization sequences up to 85 mT, with some subsamples further demagnetized up to 290 mT. Antiparallel treatment orientations were not used due to sample mounting restrictions. We measured the magnetic moment after AF application in each of the three orthogonal (N, E, Z coordinate) directions and computed the final moments as the average of all measurements for each AF level [after Garrick-Bethell et al. (after Garrick-Bethell et al., 2009)] in order to reduce spurious ARM and GRM (see Section 1).
We used principal component analysis (PCA) (Kirschvink, 1980) to determine the best-fit directions for the magnetization components in each sample and the dANG/MAD test to qualitatively assess whether a magnetization component trends toward the origin [see (Lawrence et al., 2008)]. This method compares the angular difference between a non-origin-constrained least squares fit of the NRM component and the centroid of the least squares fit (dANG) to the maximum angle of deviation (MAD) of the fit. Although this test is somewhat arbitrary because it does not assign a confidence interval to the hypothesis that the NRM component is origin-trending, we adopt it here in the absence of more robust statistical tests (see Appendix A).
We tested for GRM acquisition in our samples following Garrick-Bethell et al. (Garrick-Bethell et al., 2009) (see Section 3.2 of their Supplementary Online Material). We found that GRM does not significantly contribute to the demagnetization behavior of our mare basalts (see Appendix A and Fig. A7). Samples 15556, 15016, and 12017 exhibited poor behavior during
AF demagnetization of NRM. For subsamples lacking easily identifiable high coervicity (HG)
components (i.e. vast majority of subsamples), we fit nominal HC components in order to later demonstrate that this AF range yields paleointensity ranges with high uncertainties that make them indistinguishable from zero (null field) (see Section 4.2). Rather, as described below, the unstable AF behavior observed in our samples appears to be the product of spurious ARM and remanence anisotropy.
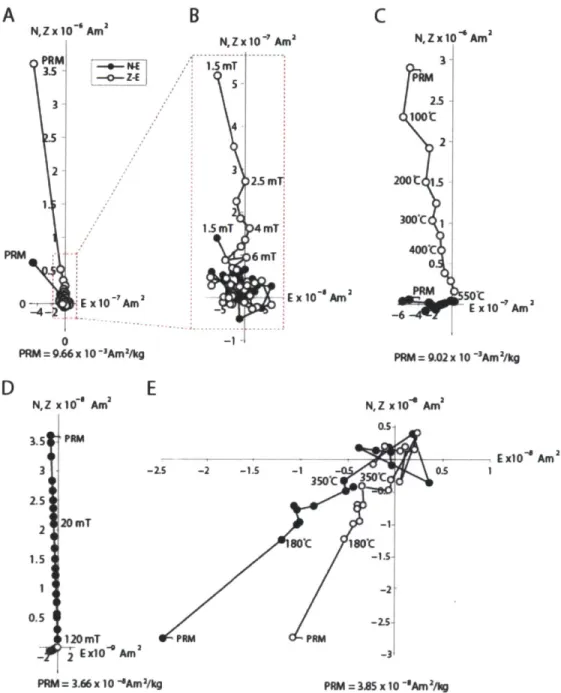
We found that three of our five subsamples of 15556 have two poorly defined NRM components: a low coercivity (LC) component blocked from NRM to 3-5 mT, and an HC component ranging from the upper end of the LC component up to 6-19 mT (depending on the subsample) (Table A5 and Fig. 3a). Of the remaining two, subsample 15556,220a lacked an obvious HC component; we therefore tentatively assigned it a HC component spanning 4-50 mT
for the purpose of computing PCA fits. The LC components of 15556,221a and 15556,221d
were approximately unidirectional (overlapping MAD circles) with respect to each other, but not with respect to the LC components of the other subsamples from 15556. The dANG/MAD test suggested that the only subsample with an origin-trending HC component was 15556,221a (Table A6). The HC directions for the three subsamples in which they were reasonably well-defined were scattered (their MAD circles did not overlap). For coercivities above 6-19 mT, the remaining NRM is overwhelmed by spurious ARM. This behavior is consistent with previous AF demagnetization studies on 15556 (Gattacceca et al., 2010; Nagata et al., 1973), which observed a LC magnetic component blocked between 0-5 mT and a possible HC component blocked between 5 mT and 20 mT. These HC components also exhibited unstable remanence.
The other sample without two NRM components was our smallest subsample, 15556,221c. This sample displayed a spectacular example of magnetic pinning (Figs. 3b and A8). Its NRM remained stable up to 3 mT, but at higher fields (from 3.5 to 240 mT) switched back and forth between two nearly perfectly antipodal directions 439 times during demagnetization up to 290 mT, even during repeated AF applications at the same peak field level.
3.3. Mare basalt 15016
The AF demagnetization behavior of 15016 was inconsistent between our six subsamples (Table A5, Fig. 3c). All subsamples exhibited spurious demagnetization behavior similar to that described for 15556. Two subsamples had no clearly identifiable magnetic components. Three subsamples had LC components blocked between NRM and a maximum of 4.5 mT, but no obvious HC component. The LC components were non-unidirectional across subsamples. Only 15016,225s2, had two identifiable components: an LC component blocked between NRM and 9 mT, and an HC component blocked between 9 mT and 17.5 mT which fails the dANG/MAD test (Table A6). The assigned LC and HC components spanned between NRM and a maximum of
9.5 mT, and from the end of the LC component to 43 mT, respectively. Previous AF demagnetization studies conducted on by Pearce et al. (1973) and Cournede et al. (2012) showed unstable demagnetization characteristics similar to those observed here.
3.4. Mare basalt 12017
Subsamples from the basalt portion of 12017 had clearly identifiable LC components, typically blocked between NRM and 8.5 mT [see Buz et al., (Buz et al., 2011); detailed NRM demagnetization data to be presented elsewhere]. Because spurious demagnetization obscured any HC components in the basalt samples, we defined preliminary HC components ranging from the end of the LC components to a maximum of 80 mT (Table A5 and Fig. 3d). The assigned HC magnetization directions for 12017,12a2 and 12017,12alc were roughly unidirectional (MADs overlapped), but neither passed the dANG/MAD test (Table A6). Previous AF demagnetization experiments by Strangway et al. (1971) on two 12017 subsamples identified two NRM components blocked up to 5 mT and from 5 mT to 20 mT, respectively. The moment magnitude increased and decreased erratically with increasing peak AF fields above 5 mT. At 20 mT, the magnetization direction of subsamples 12017,4 and 12017,5 were roughly unidirectional (within ~30' of one another), consistent with our own observations of 12017. AF
demagnetization of the 12017 glass yielded LC components between NRM and 8.5 mT. Stable HC magnetizations could not be identified, so we assigned tentative components blocked to AC fields of -85 mT (Table A3, Fig. 3e). With exception of basalt subsample 12017,12alc, the LC
component directions for all subsamples of 12017 (basalt and glass) were roughly unidirectional.
3.5. Mare basalt 10020
10020 has two magnetization components [detailed demagnetization presented in Shea et al. (Shea et al., 2011)]. LC components were blocked from NRM to 8.5-17 mT, depending on the subsample, while HC components were blocked up to between 75 mT and > 290 mT. The LC components were not unidirectional across the entire sample. The high coercivity magnetization of 10020 is consistent with prior AF demagnetization study (Collinson et al., 1972). As described in detail in Shea et al. (Shea et al., 2011), 10020 has an extraordinarily stable magnetization [even exceeding that observed for 76535 (Garrick-Bethell et al., 2009)].
3.6. Summary
All subsamples from 15556, 15016, and 12017 analyzed in this study exhibited unstable behavior during demagnetization of NRM. Repeated AF steps at a single level led to large changes in moment. This variability is certainly unrelated to the moment sensitivity of our magnetometer because repeat measurements (without intervening demagnetization) were essentially identical and the measured moments were at least two orders of magnitude above our instrument's detection limit. Only 3 out of 17 subsamples had identifiable HC components, and even these were only blocked to low coercivities (< 25 mT). For sample 15556, which had three subsamples with clear HC components, both the LC and HC components of these subsamples were non-unidirectional with respect to each other. Given this behavior, our NRM data clearly do not provide any evidence for the existence of an ancient lunar dynamo when these samples formed between 3.2-3.3 Ga.
4. Paleointensity studies
4.1. Introduction
A major goal of lunar paleomagnetism studies is to determine the paleointensity of the ancient magnetizing field. For the reasons described in Section 3.1, we chose to use the nondestructive, AF-based ARM and IRM methods to estimate absolute paleointensities for the HC components of our samples (see Appendix A). These methods are similar to those used for paleointensity studies during the Apollo era, allowing us to assess the meaning of these previous results in context with the magnetic recording fidelity of the rocks observed in Apollo era
studies.
4.2. NRMpaleointensity results
Paleointensity results for sample 10020 provide robust evidence for Earth-strength fields on the Moon (Shea et al., 2011). However, most paleointensity experiments on 15556, 15016, and 12017 were inconclusive (see Appendix A). Most subsamples either yielded formally negative (i.e., meaningless) paleointensities or had formal uncertainties exceeding their corresponding paleointensity values (Table A7). These results, coupled with the noisy NRM
demagnetization behavior observed for these samples, led us to examine their magnetic
recording fidelity. Our goal was to determine whether certain samples are intrinsically incapable
of expressing stable AF demagnetization behaviors. If a sample has low magnetic recording
fidelity, it cannot be used to determine whether a paleomagnetic field was present on its parent
body.
4.3. Paleointensity limit tests
We conducted the following experiment to assess the magnetic recording fidelity of our
samples. At least one subsample from each parent rock was imparted with a laboratory ARM
using DC bias fields ranging from 3 pT to 200 gT and an AC field of 85 mT to simulate TRM
acquisition at paleofields ranging from 2-150 pT [using an ARM/TRM ratio of 1.34 measured
for some lunar rocks; see Stephenson and Collinson (Stephenson and Collinson, 1974)]. We
then used the ARM method to retrieve paleointensities for each applied lab field. A comparison
of retrieved paleointensities against the applied (known) intensity that produced the laboratory
remanence indicates the magnetic recording fidelity of a sample. This approach is analogous to a
TRM experiment previously used for ordinary chondrites (Brecher and Leung, 1979). The closer
a retrieved paleointensity value is to the applied lab field intensity, the more likely a
magnetization can be successfully retrieved using AF methods. We quantified this agreement as
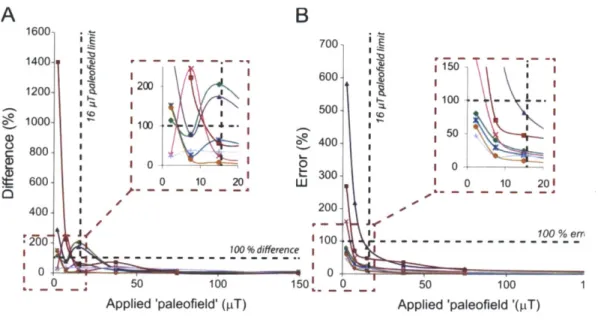
a function of applied field strength using two metrics that we call difference (D) and error (E):
D IL -J1/ L - 100% (1)
E- W/L 100%
(2)
The first metric quantifies the difference between the TRM-equivalent value of the
applied laboratory field (L) and the retrieved paleointensity (1) (Fig. 4a). The second metric
quantifies the error associated with the paleointensity measurement by comparing the width of
the Student's t-test-derived 95% confidence interval (W) for the retrieved paleointensity to the
magnitude of the applied laboratory field (see Appendix A) (Fig. 4b). We use two metrics
because it is possible for a retrieved paleointensity to be close in value to the applied laboratory
field (i.e., have a low value for D), but for the formal error associated with the experiment due to
nonideal demagnetization behavior to be larger than the magnitude of the paleointensity (i.e.,
have a large value for E). Both metrics should have low values for a paleointensity to be
considered high quality. Here we define a sample to be a good magnetic recorder at those field
strengths for which the following conditions are satisfied: (a) there is less than 100% difference between the applied field and retrieved paleointensity and (b) there is less than 100% error associated with the measurement. These thresholds are somewhat arbitrary but are certainly generous towards poor recorders: it is virtually certain that samples that do not meet these thresholds are nonideal for paleointensity studies.
We found that AF demagnetization of magnetization produced in higher applied lab fields exhibited more ideal behavior than magnetization produced with weak fields (Fig. A9). Weak-field magnetizations were prone to spurious demagnetization, which in turn resulted in less accurate retrieved paleointensities during the experiment described in the preceding paragraph. We found that AF methods can retrieve TRM-equivalent fields down to 7 pT for
10020,234d and glass 12017,13a2, and as weak as 2 pT for 76535,153 . By comparison, we
could only retrieve TRM-equivalent fields down to 37 pT for basalts 15016,b21 and 15556,221g. Furthermore, heterogeneities in magnetic recording fidelity exist within a single Apollo sample. For example, we found that we could retrieve TRM-equivalent paleointensities as weak as 7 pT from 10020,234d but only down to 15 pT for 10020,234c. This difference in recording fidelity is mirrored by observed differences in NRM demagnetization behavior between these two subsamples (compare fig. A3A,C with Fig. S3B in (Shea et al., 2011)]. Therefore, a computed paleointensity from a subsample should ideally only be compared with the field recording limit determined for the same subsample when assessing the reliability of paleointensity estimates. In summary, only high-fidelity samples such as 10020, 76535, or the 12017 glass are capable of stable AF demagnetization and providing reliable AF-based paleointensity values from the predicted weak fields (<16 pT) from a lunar dynamo. Paleointensities from intermediate fidelity samples should be scrutinized subsample-by-subsample. AF-based paleointensity results from poor magnetic recorders (e.g., 15016 and 15556) should be regarded with caution.
4.4. Implications for Apollo-era paleointensity methods
We have shown that nonideal AF demagnetization and inaccurate paleointensity determinations may be caused by spurious ARM. This conclusion led us to re-assess previous lunar paleointensity analyses conducted using AF-based techniques. The majority of IRM paleointensities acquired during the Apollo era used the NRM20/sIRM20 normalization method [termed the "REMc" method by Acton et al. (Acton et al., 2007)] in which NRM AF
demagnetized to 20 mT (TRM20) was compared to sIRM AF demagnetized to 20 mT (sIRM20) (Cisowski et al., 1983a; Fuller and Cisowski, 1987). This method was used because many samples exhibited low-field (< 10 mT) IRM overprints that would otherwise contaminate paleointensities derived from ratios of undemagnetized NRM and IRM. A major problem with this method is that highly multidomain lunar samples and synthetic samples displayed a non-linear relationship between laboratory TRM2 0 to sIRM20 when the TRM was applied in weak fields (<10 pT) (Cisowski et al., 1983a; Fuller and Cisowski, 1987). The reason for this behavior was left unexplained and led the authors to question the fidelity of the majority of Apollo-era paleointensity values.
Our results described above suggest this nonlinear behavior may be a manifestation of ARM noise. To test this hypothesis, we studied the relationship between laboratory ARM which was AF demagnetized to 20 mT (ARM20) and sIRM20 on the same subsamples used in the preceding section (see Appendix A for further discussion of our methodology and results). We observed a non-linear relationship between ARM20 and sIRM20 at ARM DC fields ranging from
3-200 pT (equivalent to TRM acquired at 2-150 tT) (Fig. 5a). For comparison, we examined
the relationship between ARM and sIRM that were not subsequently demagnetized (ARMo and sIRMo). In this case, we observed a linear relationship between ARMO and sIRMo (analogous to non-demagnetized TRM and sIRM) for almost all samples down to their recording limits (Fig. 5b). Given that we have shown that highly multidomain samples are extremely susceptible to spurious ARM, we propose that the nonlinear relationship between ARM20 and IRM20 (e.g. TRM20 and sIRM20) observed by Cisowski et al. ((Cisowski et al., 1983a; Fuller and Cisowski,
1987) and in our Fig. 4a is a manifestation of ARM noise introduced by the AF application used
in these experiments. Unfortunately, this problem cannot be reconciled by simply computing ratios of undemagnetized NRM and sIRM due to the ubiquitous presence of low coercivity overprints (typically secondary IRM) in lunar samples.
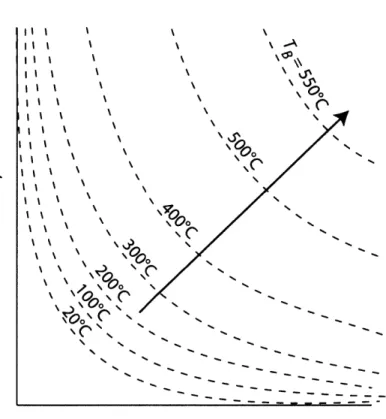
A related longstanding unsolved issue in lunar paleointensity studies observed
specifically when using the REMc paleointensity method is that there appears to be a minimum paleofield (NRM20/sIRM20 > 3.6x 10⁻⁴, implying paleointensities : 1 IT) that has been retrieved, regardless of sample age (Cisowski et al., 1983b). This minimum field, which is far stronger than nearly all putative field sources other than a core dynamo, is even observed in samples <1.5 Ga in age when a dynamo is highly unlikely due to a lack of power sources [see Dwyer et al.,
2011; Le Bars et al., 2011; (Stegman et al., 2003)]. Our results indicate that all AF-based paleointensity experiments will give highly inaccurate values if the field that magnetized the samples has a lower intensity than the minimum limit that can be retrieved due to ARM noise (Fig. 6). Specifically, when using the REMc normalization method, spurious ARM may inflate values for ARM20, yielding high (> 1 pfT) paleointensities for samples which may have nevertheless formed in a zero-field environment after the end of a lunar dynamo. This suggests that REMc paleointensity values measured for young samples with ages of several hundred Ma may only be upper limits and should be reevaluated using more robust paleointensity techniques.
5.
Zig-zag behavior
We have discussed the observation of unstable AF demagnetization behavior present during demagnetization of both NRM and induced ARM (as a proxy for TRM) in some lunar samples. Magnetic anisotropy studies on these samples may shed light on sources of the more ordered spurious behaviors that have been observed, like zig-zag demagnetization and pinning of magnetization directions. We next discuss how magnetic anisotropy in combination with
spurious ARM may responsible for these behaviors.
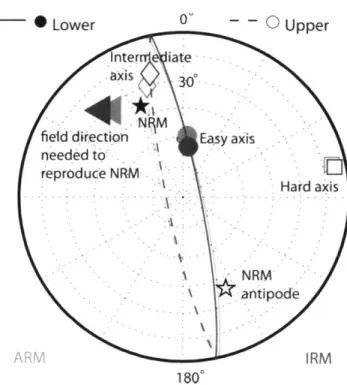
The flipping of the magnetic moment of sample 15556,221c between two nearly antipodal directions suggests that magnetic anisotropy is the source for zig-zag demagnetization. This is because anisotropy preferentially constrains magnetization to magnetic axes and planes. We conducted ARM and IRM anisotropy of remanence experiments on various subsamples of
basalts 15556, 15016, 12017, and 10020 (Table A8, A9). We applied ARM (DC field of 2 mT and AC field of 800 or 850 mT) and IRM (20 mT field) along all three orthogonal axes and
solved for the principal axes of the anisotropy ellipsoids [following (Stephenson, 1993; Stephenson et al., 1986)]. We averaged the results of each experiment (two ARM and two IRM experiments) for all samples except the 12017 glass (which only had one ARM experiment and one IRM experiment) to reduce uncertainties associated with sample orientation (±50). The nature of the anisotropy of remanence in each sample can be characterized by two parameters: the degree of anisotropy, P, and the shape factor, T. P is defined as the ratio of the magnetic moments acquired along the easy axis and hard axes of the anisotropy ellipsoid. T is calculated from relative ratios of moments acquired along the easy, medium, and hard axes, and provides
information regarding the shape of the anisotropy ellipsoid. Positive values of T indicate oblate
ellipsoids, while negative values indicate prolate ellipsoids.
We found that sample 15556,221c, which exhibited zig-zag demagnetization, is by far
our most strongly anisotropic sample and has an oblate fabric (P = 2.0, T = 0.17 for ARM; P =2.6, T
=
0.30 for IRM) and a well-defined easy plane (i.e., plane defined by the easy and
intermediate magnetic axes). The two antipodal pinned directions lie within 22.5' from the easy
axis of magnetization and within 18' of the easy plane (Fig. 7). We estimate that the uncertainty
of this easy plane orientation to be
< 30,
based on the differences in the location of the pole of the
easy plane (hard axis direction) between experiments. The MAD values derived from PCA fits
for each of the two directional groups are 27.7' and 31.6'. Since the angular distances between
the pinned magnetization directions and the easy plane are less than the MADs of the
magnetization directions, the magnetization directions essentially fall within error of the easy
plane. This demonstrates that pinning during AF demagnetization is very likely due to the high
magnetic anisotropy of this subsample. Similar but preliminary observations using susceptibility
anisotropy were reported for several lunar samples with spurious remanence by (Brecher, 1977).
Anisotropy alone cannot explain why the moment of 15556,221c flips back and forth in the easy
plane as opposed to being stably oriented in one direction. As discussed above (Sections 3 and
4), 15556 is highly susceptible to acquisition of spurious ARM during AF demagnetization. We
propose that spurious ARM is also responsible for the flipping observed for 15556,221c. To test
this hypothesis, we repeated AF applications multiple times for each applied field level during
demagnetization of NRM (as described in Section 3.1). We counted how many times the
magnetic moment flipped between antipodal directions for each AF level and determined the
fraction of AF applications which led to flips. In general, the flipping frequency increased with
AF level up to 10 mT before leveling off at a 50% chance of flipping at any given AF application
(see Appendix A and Fig. Al 1). This increase suggests that ARM noise is the causative factor
because the net moment becomes increasingly dominated by spurious ARM at progressively
higher AF steps. If flipping was solely controlled by an unbiased alternating field with random
thermal fluctuations, one would expect the 50% flipping frequency to start at the first flip at the
AF level of the first flip (3 mT).
This likely explains similar pinning and zig-zag
demagnetization observed in other lunar samples (Brecher, 1976; Hoffman and Banerjee, 1975).
We found that the other subsamples of 15556 were less anisotropic than 15556,221c, with P values ranging from 1.13-1.52. Subsamples of 12017 and 15016 had similar values with average
P = 1.14 and 1.55, respectively (Table A8, A9). 10020,234b4 and 10020,234d had average P
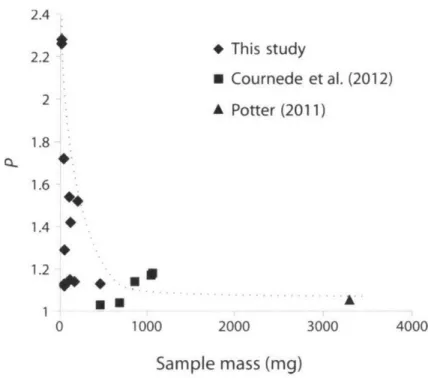
ranging from 1.12-1.73, respectively [see Shea et al. (2012)]. Our anisotropy results, in conjunction with other remanence anisotropy parameters previously published for lunar rocks by Cournede et al. (2012) and Potter (2011), we observed an inverse correlation between P and sample size (Fig. 8). This likely indicates that the anisotropy is a reflection of a small number of metal grains with shape anisotropy which are likely to dominate samples with small masses.
6. Discussion
The unbrecciated, unshocked, primary igneous textures of basalts 15556, 15016, and 12017 would at first glance appear to make them ideal candidates for lunar paleomagnetism studies. However, like many other lunar samples reported in the literature (Table Al), these samples behave unstably during AF demagnetization experiments and are poor recorders of magnetic fields of strengths predicted for an ancient lunar dynamo. Their NRM does not decline monotonically toward the origin with application of increasing peak AF fields. There is a large amount of scatter in both magnitude and direction of remanent magnetization at AF fields above 20 mT. This is a clear demonstration of the deleterious effects of spurious ARM acquired during AF demagnetization. As discussed in the Appendix A, scatter in moment magnitude and direction resulting from acquisition of spurious ARM may cause noisy HC magnetization directions to appear origin-trending (i.e. primary) in the dANG/MAD test when they may or may not actually be. Alternatively, ARM noise may obscure on otherwise origin-trending magnetization, further complicating the task of determining whether the magnetizations of low-fidelity lunar samples can be primary TRM. One subsample, 15556,221c, exhibited anisotropy-controlled pinning behavior, with the magnetization direction flipping between two antipodal directions without decaying in intensity. None of our basalt samples acquired significant GRM, although it has previously been shown that GRM significantly affects 76535 (Garrick-Bethell et
al., 2009).
Our hysteresis and rock magnetic studies show that mare basalts 15556, 15016, and 12017 possess a higher fraction of multidomain kamacite than samples which express stable AF demagnetization such as 10020, the 12017 glass, and 76535. As explained in Sec. 1, samples