UNIVERSITÉ DE MONTRÉAL
MANAGING STRESS OF ELECTRIC VEHICLES ON SMART GRIDS
SAEEDEH BARGHI-NIA
DÉPARTEMENT DE GÉNIE ÉLECTRIQUE ÉCOLE POLYTECHNIQUE DE MONTRÉAL
MÉMOIRE PRÉSENTÉE EN VUE DE L’OBTENTION DU DIPLÔME DE MAITRISE ÈS SCIENCES APPLIQÉES
(GÉNIE ÉLECTRIQUE) DÉCEMBRE 2017
UNIVERSITÉ DE MONTRÉAL
ÉCOLE POLYTECHNIQUE DE MONTRÉAL
Ce mémoire intitule :
MANAGING STRESS OF ELECTRIC VEHICLES ON THE SMART GRIDS
présenté par : BARGHI-NIA Saeedeh
en vue de l’obtention du diplôme de : Maîtrise ès sciences appliquées a été dûment accepté par le jury d’examen constitué de :
M. MALHAMÉ Roland P., Ph. D., président
M. SIROIS Frédéric, Ph. D., membre et directeur de recherche Mme MORENCY Catherine, Ph. D., membre
DEDICATION
This thesis work is dedicated to my husband, Ebrahim, who has been a constant source of support and encouragement during the challenges of graduate school and life. A very special thank you for your practical and emotional support as I added the roles of wife and then mother, to the competing demands of business, work, study and personal development. I am truly thankful for having you in my life.
This work is dedicated to my son, Danial who has made me stronger, better and more fulfilled than I could have ever imagined. I love you to the moon and back.
This work is also dedicated to my parents, my mother, and my late father, both of whom gave me the foundation of something they had never enjoyed – education. Ever since then, I have been able to appreciate the value of reading and lifelong learning., who have always loved me unconditionally and whose good examples have taught me to work hard for the things that I aspire to achieve.
ACKNOWLEDGEMENTS
I believe I would never have completed this work and gotten this far without the years of support of my supervisor, Prof. Frédéric Sirois, and I am sure that a simple thank you will never be enough to convey my gratitude for his criticisms and praise. I am grateful for his guidance and the opportunities he has afforded me. He is incredibly organized and a great problem solver, both of these qualities were immensely helpful in moving my project forward. To merit his approval is a great honor for me.
I would also like to thank my thesis committee members, Prof. Roland P. Malhamé and Prof. Catherine Morency, for their contributions to this work that each has given me superb scientific guidance, many insightful suggestions and demonstrated a sincere interest in my work. I feel extremely lucky and humbled to have had the opportunity to learn from such an impressive and supportive committee.
The atmosphere at Polytechnique Montreal, especially within the Electrical Engineering Department, is incredibly collaborative. I would like to extend my appreciation to the people who have fostered this wonderful learning environment.
RÉSUMÉ
Chaque jour, les attentes des consommateurs d'énergie augmentent en termes de fiabilité du réseau et d'impact environnemental de l'énergie. Au-delà d’avoir d'assurance que tous leurs appareils électroniques seront fournis, les consommateurs veulent bénéficier des technologies qui peuvent les responsabiliser et leur permettre de maîtriser leur énergie. Pour répondre à ces attentes croissantes, la façon dont l'énergie est produite, distribuée et consommée doit évoluer. La solution implique à la fois une demande plus intelligente et un approvisionnement plus intelligent.
L'un des plus grands défis de la feuille de route pour le réseau intelligent est la responsabilité (et l'obligation, dans de nombreux cas) de combiner les sources d'énergie existantes avec l'énergie alternative afin de réduire l'impact sur l'environnement et de sécuriser l'énergie. La nature variable de la plupart des énergies renouvelables, ainsi que l'émergence de nouvelles charges importantes comme les véhicules électriques (VE), peuvent compliquer les équilibres de charge sur les lignes, conduisant à une instabilité de la tension et même à des défaillances.
VEs offrent une solution efficace et concrète pour réduire l'empreinte carbone du transport, mais ils représentent également un nouveau type de demande pour les services publics. Comme les maisons, les entreprises et toute autre source d'énergie électrique, les VEs doivent être gérés de manière efficace et responsable par les services publics sur le réseau. De plus, parce qu'ils ont le potentiel à la fois de consommer et de produire de l'énergie, les VEs deviennent une partie inextricable de la gestion de la demande.
La possibilité d'un déploiement à grande échelle de VEs pose d'importants obstacles aux services d'électricité selon la façon et le moment de la facturation des VEs. Ce nouveau mode de transport et l'infrastructure nécessiteront des solutions de gestion de l'énergie fiables et sûres. Il est nécessaire de veiller à ce que les VEs et l'infrastructure de recharge soient sûrs, pratiques, économiques et écoénergétiques pour les conducteurs et les opérateurs de services publics. De plus, les gestionnaires de réseau doivent s'assurer qu'ils sont capables de gérer les impacts de la recharge des VE sur le réseau et qu'ils peuvent intégrer la consommation de ces nouvelles charges dans la demande de charge des services publics sans problème. Certainement, les VEs peuvent créer des avantages pour les services publics si leur intégration est correctement effectuée. Ce projet présente une étude approfondie et se concentre sur la gestion du stress accru des VE sur les réseaux de distribution. C'est un problème hautement stochastique et la méthode appliquée dans ce travail est
basée sur des modèles stochastiques. Le modèle stochastique proposé est appliqué à un distributeur urbain d'une grande entreprise d'électricité canadienne. Deux scénarios de recharge de VE, de charge incontrôlée et contrôlée, sont simulés et analysés.
ABSTRACT
Every day, the expectations of energy consumers increase in terms of grid reliability and energy’s environmental impact. Beyond having the assurance that all of their electronic devices will be supplied, consumers want to benefit from the technologies that can empower them and put them in control of their energy. To address these growing expectations, the way energy is produced, distributed, and consumed must evolve. The solution involves both smarter demand and smarter supply.
One of the biggest challenges on the roadmap to the smart grid is the responsibility (and obligation, in many cases) to combine established power sources with alternative energy in order to lower the impact on the environment and to secure additional energy for the future. The variable nature of most renewable generation, as well as the emergence of significant new loads like Electric Vehicles (EVs), can complicate load balances on lines, leading to voltage instability and even failures.
EVs offer an effective and concrete solution for reducing the carbon footprint of transportation, but they also represent a new type of demand for utilities. Like homes, businesses, and any other electric power source, EVs must be effectively and responsibly managed by utilities on the grid. Moreover, because they have the potential to both consume and produce energy, EVs are becoming an inextricable part of Demand Management.
The possibility of large-scale deployment of EVs raises significant obstacles for electric utilities depending on how and when EVs are charged. This new mode of transportation and the infrastructure will require reliable and safe energy management solutions. It is necessary to ensure that the EVs and the charging infrastructure are safe, convenient, economical, and energy efficient for drivers and utility/system operators. Additionally, system operators must ensure that they are able to manage the impacts of EVs charging on the grid and also that they can integrate the consumption of these new loads into utility load demand without issue. Certainly, EVs can create benefits for utilities if their integration is properly done. This project presents an extensive study and is concentrated on the managing of the increased stress of EVs charging on the distribution networks. This is a highly stochastic problem and the applied method in this work is based on stochastic models. The proposed stochastic model is applied to an urban distribution feeder of a
large Canadian power utility. Two EV charging scenarios, uncontrolled and controlled charging, are simulated and analyzed.
TABLE OF CONTENTS
DEDICATION ... III ACKNOWLEDGEMENTS ... IV RÉSUMÉ ... V ABSTRACT ...VII TABLE OF CONTENTS ... IX LIST OF TABLES ...XII LIST OF FIGURES ... XIII LIST OF SYMBOLS AND ABBREVIATIONS... XV LIST OF APPENDICES ... XVICHAPTER 1 INTRODUCTION ... 1
1.1 Choice of Phenomenon/Problem Studied ... 1
1.2 Literature Review ... 4
1.3 Project Objective ... 11
1.4 Methodology ... 11
CHAPTER 2 INVENTORY OF EVS AND CHARGING OPTIONS ... 13
2.1 Electric Transportation ... 13
2.2 Electricity as an Alternative Fuel for Land Transportation ... 14
2.3 Types of Vehicles ... 15
2.4 Challenges and Opportunities for EV Stakeholders ... 16
2.5 Selected Electric Vehicles & their Comparisons ... 17
2.6 Charging Options ... 21
2.7.1 Electrical Ratings ... 22
2.8 State of Charge of EV Battery ... 24
2.9 Depth of Discharge ... 24
2.10 Charging Stages of EV Battery ... 25
2.11 EV Battery Charging Profile ... 25
CHAPTER 3 DRIVING PATTERNS & MOBILITY INFORMATION ... 26
3.1 Studied Network ... 26
3.2 Source of Mobility Data ... 27
3.3 Statistical Data of the Selected Area ... 28
CHAPTER 4 METHODOLOGY ... 34
4.1 Electrical Data ... 34
4.2 Mobility Models ... 34
4.3 Distribution of EV Models in the Selected Area ... 34
4.4 EV Characteristics ... 38
4.5 Deterministic Variables ... 39
4.5.1 EV Penetration Rate ... 39
4.5.2 Min/Max of SOC and Charger Efficiency ... 39
4.5.3 Base Load Profile ... 40
4.6 Stochastic Variables ... 40
4.7 Formulation of the Problem and Developed Program ... 41
4.7.1 First step ... 41
4.7.2 Second step ... 41
4.7.3 Third step ... 43
4.8 Simulation Results ... 46
CHAPTER 5 CONCLUSION AND RECOMMENDATIONS ... 56
5.1 Summary of the Work and Methodology ... 56
5.2 Discussion on the Results ... 57
5.3 Managing the Stress of EVs in the System ... 58
5.4 Recommendations and Next Step Researches ... 58
BIBLIOGRAPHY ... 60
LIST OF TABLES
Table 2.1: Performance Comparison of the Introduced EVs ... 19
Table 2.2: Electric Specification Comparison of the Introduced EVs ... 20
Table 2.3: Comparison of Charging Levels/Modes ... 22
Table 2.4: Typical Charging Parameters in North America ... 23
Table 3.1: Number of Houses with Different Number of Residents ... 28
Table 3.2: Number of Houses with Different Income Levels ... 29
Table 3.3: Number of Population in Different Categories ... 29
Table 3.4: Number of People with Different Ages ... 29
Table 3.5: Number of People with Different Occupations ... 30
Table 3.6: Number of Houses with Different Number of Vehicles ... 30
Table 4.1: Distribution of EVs in the Selected Area based on the Assumptions ... 37
Table 4.2: Increase in Daily Peak Load under Different Scenarios ... 55
Table A.1: Emission and Cost to Drive Comparison of the Introduced EVs [28] ... 63
LIST OF FIGURES
Figure 1.1: Conventional, Hybrid, Plug-in Hybrid and All Electric Vehicles [5] ... 2
Figure 2.1: Selected EVs in our case studies [28] ... 18
Figure 2.2: Charging options in Quebec [5] ... 21
Figure 3.1: Area covered by the Delorimier substation in Montreal ... 27
Figure 3.2: Sampling used for the mobility survey in the area supplied by the considered substation ... 28
Figure 3.3: Distribution of daily trip distances by vehicle owners ... 31
Figure 3.4: Probability density function of vehicle daily trip distance ... 31
Figure 3.5: Statistical distribution of vehicles departure time from home ... 32
Figure 3.6: Statistical distribution of vehicles arrival time to home ... 33
Figure 4.1: Income level of car owners & their daily traveled distance ... 35
Figure 4.2: EVs prices in ascending order and their corresponding electric range ... 36
Figure 4.3: EVs contribution in the studied area based on the assumptions ... 38
Figure 4.4: Base load profile and temperature as a sample in the selected feeder ... 40
Figure 4.5: Generic charging profile of Lithium-ion EV batteries ... 43
Figure 4.6: Distribution of random selection of EV types with 10% EV penetration rate ... 47
Figure 4.7: Distribution of random selection of SOC / charging level with 10% EV penetration rate ... 47
Figure 4.8: Distribution of random selection of trip distances with 10% EV penetration rate ... 48
Figure 4.9: Distribution of random selection of departure / arrival time with 10% EV penetration rate .... 48
Figure 4.10: Load profile with 10% EV penetration rate and with uncontrolled/controlled charging ... 49
Figure 4.11: Uncontrolled charging deviation with 10% EV penetration rate ... 50
Figure 4.12: Controlled charging deviation with 10% EV penetration rate ... 50
Figure 4.13: Distribution of random selection of EV types with 86% EV penetration rate ... 51
Figure 4.14: Distribution of random selection of SOC / charging level with 86% EV penetration rate ... 52
Figure 4.15: Distribution of random selection of trip distances with 86% EV penetration rate ... 52
Figure 4.17: Load profile with 86% EV penetration rate and with uncontrolled/controlled charging ... 53
Figure 4.18: Uncontrolled charging deviation with 86% EV penetration ... 54
Figure 4.19: Controlled charging deviation with 86% EV penetration rate ... 54
LIST OF SYMBOLS AND ABBREVIATIONS
AMI Advanced Metering Infrastructure BEV Battery EV
CC Coordinated Charging
CCCV Constant Current/Constant Voltage CPPS Cyber-Physical Power System DG Distributed Generation
DOD Depth of Discharge DS Distribution System
DSO Distribution System Operator EV Electric Vehicle
GFCI Ground Fault Circuit Interrupter
GV Gridable Vehicle
G2V Grid-to-Vehicle
ICE Internal Combustion Engine LCC Life Cycle Cost
MCS Monte Carlo Simulation
MSRP Manufacturer’s Suggested Retail Price PHEV Plug-in Hybrid Electric Vehicle PEV Plug-in Electric Vehicles SOC State of Charge
UC Uncoordinated Charging V2G Vehicle-to-Grid
LIST OF APPENDICES
Appendix A –Emission Comparison of selected EVs ... 63 Appendix B – layout of the studied area ... 65 Appendix C – Electrical Data of the Selected Feeder ... 66
CHAPTER 1
INTRODUCTION
Electric power systems and especially distribution systems (DS) have started to change drastically. One of the basic functions for modernization of the grid, i.e. a smart grid, is allowing for the integration of all energy generation and storage options, including plug-in electric vehicles (PEV) or in general electric vehicles (EVs). One of the major changes is a transformation of the transportation sector with the use of electricity and introduction of EVs. EVs are linking energy consumers and producers via the smart grid. According to the European Federation for Transport and Environment (T&E) and also US energy Information administration (eia), transportation is responsible for more than 30% of CO2 emissions [1].
EVs represent a challenging new element of energy demand, and they must be properly integrated to bring balance and efficiency to the power system. EVs are soon expected to grow in popularity as a low emission mode of transportation as compared to conventional vehicles. They reduce dependence on imported petroleum and potentially provide consumers a lower cost alternative to gasoline [2]- [3].
EVs offer an effective and concrete solution for reducing the carbon footprint of transportation, but they also represent a new type of demand for utilities. EVs must be effectively and responsibly managed by utilities on the grid, like any other electric power source. Moreover, because they have the potential to both consume and produce energy, EVs are becoming an inextricable part of Demand Management [4].
1.1 Choice of Phenomenon/Problem Studied
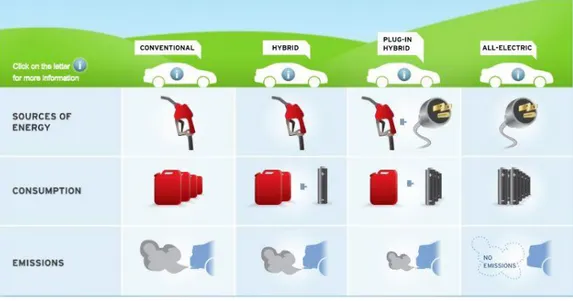
Plug-in hybrid electric vehicles (PHEVs) are a new and upcoming technology in the transportation and power sector. As defined by the IEEE, these vehicles have a battery storage system of 4 kWh or more, a means of recharging the battery from an external source and the ability to drive at least 10 miles in the all-electric mode [2]. PHEVs essentially work with a combination of two power sources, i.e., batteries and gasoline. They are an extended version of current hybrid EVs including a battery with larger autonomy and able to connect to the grid to be charged. Compared to hybrid EVs, the advantages of PHEVs are fuel flexibility and a larger electric-only
driving range. PHEVs might be a fast and temporary solution until more advanced EVs technologies become mature [3].
Figure 1.1 schematically shows the general differences between conventional, hybrid, plug-in hybrid and all electric vehicles:
Figure 1.1: Conventional, Hybrid, Plug-in Hybrid and All Electric Vehicles [5]
However, this great change will pose new challenges and opportunities for electric distribution companies. Actually, because of their potentially massive number, EVs will not only constitute a potentially significant proportion of the DS load, but they will even have to be considered as part of the distribution grid of the future [6].
The EV penetration level determines the total number of EVs, i.e. the total number of EV batteries that need to be charged in the DS. The penetration level refers to the ratio of EVs to the total vehicles in a given area [7]. As an increasing number of EVs enter the market, the effects of adding large numbers of power electronic devices to the grid become more and more predominant. So, penetration level of EVs will certainly have a drastic impact on the distribution grid [8].
The number and variety of EVs batteries connecting to the electrical DS is expected to grow rapidly, presenting a potential burden on local power companies. In order to adequately prepare for the increase in load demand and provide support through technical standards and trade regulations, utilities and government organizations must be able to predict the EVs battery charging loads under various scenarios and evaluate the ability of existing power systems to accommodate them [7].
According to the IEEE Standard, PEVs or PHEVs can be considered both as load and source/storage to provide power back to the grid to balance energy supply. PEVs are considered as a load when they are stationary and energy is drawn from the grid to charge their batteries. Proper dimensioning of the utilities distribution networks with PEV adoption forecast is important to avoid unexpected peaks of energy consumption when charging PEVs [9].
As PEVs are developed, distribution system operators (DSOs) become responsible for realizing the required network upgrades to supply the PEV charging points. In addition, similarly to distributed generation (DG), DSOs have little control on the location of future PEV charging points or stations, and no direct control over periods and frequency of PEV charging. As a consequence, the network expansion planning problem will become more complicated due to a high degree of uncertainty [3].
The impacts that these aspects of PHEVs will have on distribution networks have been measured and calculated by multiple authors in different locations using many different tools that range from analytical techniques to simulations. While much work has already been completed in this area, there is still much to do.
Previous works on the topic have focused on economic models, economic incentives [10] and load/charging profiles [11]-[12] for these new vehicles, but little work has been done to assess the impact of EVs on the DS itself. As these new vehicles will constitute a significant new load on the power grid while commanding significant changes to the infrastructures, it is necessary to develop tools that will allow assessing their impact on DS, mostly regarding the management of daily load consumption profiles. Then, strategies must be explored in order to make easier the transition towards today’s situation and a high penetration level of EVs in DS, which is expected to occur over the next decade [13]. Taking advantage of the smart grid communication facilities and/or of the inherent energy storage ability of batteries present in EVs are all options to consider in order to maximize the benefits that EVs can provide to society [8].
The main goal of this project is to establish a methodology for modeling and analyzing the load demand in a DS due to EV battery charging in order to assess the impact of this new stress on DS. This is done by considering high penetration rates of EVs in the power system and by proposing strategies to mitigate the new problems and turn them into opportunities.
1.2 Literature Review
The impact of charging of PHEVs on a typical distribution feeder in Blacksburg, VA is analyzed in [14]. The network consists of five homes and two PHEVs, which are Chevy Volts. Two charging strategies are considered: charging of all PHEVs at 6 P.M. and charging of all PHEVs at off-peak hours. The first case represents the worst case and results in a transformer load increase by 68% in winter and 52% in summer. The second case results in a transformer load increase by 58% in winter and 52% in summer. Since none of these scenarios results in transformer overloading, the cases are reexamined using quick charging with a higher voltage outlet in order to charge the PHEVs in less time. This results in a transformer overload only when the quick charging starts at 6 P.M. The final investigated scenario involves five PHEVs per distribution transformer. As this obviously overloads the transformer, two new charging methodologies are suggested: PHEV stagger charge and household load control. Stagger charge staggers the charging time of PHEVs while household load control allows consumers the choice to shed some non-essential loads in order to recharge their PHEV more quickly. The conclusion of this paper is that the addition of PHEVs creates a new load for the distribution grid, but this load should be manageable through advanced and smart techniques such as the advanced metering infrastructure (AMI). Despite this conclusion, the authors suggest further research into large fleets and their effect on the distribution grid. The strength of this paper is: it uses a very simple system for its analysis: five homes, two PHEVs and one 25 kVA feeder. It builds PHEV load curves based on battery charge and discharge characteristics, then it proposes and tests multiple charging scenarios and it incorporates smart charging techniques. These are all important traits that any PHEV study should include. The paper lays a strong base for future studies of PHEVs on the DS.
The impact on the Belgium distribution grid through the analysis of current Belgium traffic and driving patterns is discussed in [15]. The important section of this paper analyzes the load flow analysis when PHEVs are added in a distribution grid. Three different cases of uncontrolled charging are examined: i) charging between midnight and 2 A.M., ii) charging between 6 and 8 P.M. and iii) charging during the day. These charging profiles are tested on a 34-node IEEE test feeder across low and high load scenarios in both summer and winter with four different penetration levels of PHEVs: 0%, 10%, 50%, and 100% The paper concludes that the integration of PHEVs deeply affects the power losses and voltage deviations in the distribution grid and that these
changes cannot be ignored, especially in a small country like Belgium. The impacts of PHEVs on the distribution grid must be measured and quantified in order to preserve the reliability of the electric grid.
A quadratic and dynamic programming model is developed in [16] for assessing the impacts of PHEVs on the distribution grid of Belgium when PHEVs are charging at home. Both deterministic and stochastic methods are used in this paper. The input variables in both cases are the daily/hourly load profiles. The load profiles are static in the deterministic case. In the stochastic case, the load profiles are transformed into probability density functions and are used to generate 2000 different loading scenarios that are optimized and compared. Both give similar results, but the quadratic programming is more accurate as it works over a continuous solution space while the dynamic programming method works over a discrete solution space. In order to determine impacts on the distribution grid, the simulation is running for two different scenarios: uncoordinated charging and coordinated ‘‘smart’’ charging. The losses for the distribution grid during uncoordinated charging are not negligible, while coordinated charging has not such impacts on the DS. The paper concludes that PHEV charging must be coordinated via operators and other multi-agent-systems in order to maintain the integrity of the distribution grid while reducing power loss and voltage drop.
The electrical power required for charging a fleet of PHEVs in Belgium has been determined in [12]. A stochastic model based on the driving behavior of Western European drivers, determines the availability of the PHEVs for grid charging. Three scenarios are defined to generate charging profiles based on the driving profiles. The first two scenarios, defined as uncoordinated charging (UC), are based on a continuation of the current tariff schemes available to residential users, i.e. a single electricity tariff or a double electricity tariff including day and night tariffs. In the third scenario, coordinated charging (CC) is proposed. When CC is applied, the time of charging is shifted to a more appropriate moment of the night where total electrical load is minimal. The charging of a fleet of PHEVs, as expected for Belgium in 2030, will impact the electricity producers. If charging were to be uncoordinated, peak power would rise substantially while base power would increase only a little. The grid would need upgrades for the higher power levels and new peak power plants would need to be built. Demand side management can minimize the impact of charging and may curtail some of the costs of UC. For CC there will be less need for grid modifications because peak power increases only 30MW. The proposed CC method offers the PHEV user many advantages: low electricity cost under the constraint of maximum electrical
driving share while at the same time offering electricity producers, transmitters and distributors advantages too: no extra peak demand, more base load and less variable load. Smart meter technology can be used for implementing CC.
An evaluation of the loading of PHEVs on DS of Hydro-Quebec is studied in [11]. The distribution network itself is designed to accommodate cold load pickup during long winter outages. The calculated PHEV load is 2400 kWh per year per vehicle, the same load as a water heater. Based on the number of cars in Quebec, at 25% penetration, this would be a 2.4 TWh load per year for all PHEVs, less than 1.3% of Hydro-Quebec’s generation capacity. The model presented is deterministic and takes into account thermal loading, voltage regulation and transformer loss of life based on a full array of PHEV characteristics (battery type, charger efficiency, battery state of charge (SOC), and charging profiles). The deterministic model is run in order to identify asset sensitivities to new loads. For instance, the model predicts that transformers’ life will be maintained while service transformers and three-phase primary lines are the most vulnerable assets to the higher loads caused by PHEVs. The model also shows that the key factor affecting the distribution grid is the charging profile (voltage and power level).
A basic framework for analyzing the impact of PHEVs on local DS is developed in [17]. In order to issue consistent results, the model is applied to multiple utility distribution circuits. The model calculates thermal loading, voltage regulation, transformers’ loss of life, unbalance, power losses and harmonic distortion levels for multiple scenarios in both deterministic and stochastic methods. Using OpenDSS, the paper concludes that the distribution grid tends to increase as the penetration of PHEVs increases. This paper also examines what time scale should be considered when evaluating the impact of PHEVs on the distribution grid. As this paper studies only through year 2010, it must be considered that both short and long term analysis must be completed. Short-term analysis will allow utilities to prepare for immediate impacts while longer-range studies will allow utilities to adjust and accommodate future usages and loads.
A study of the necessary energy requirements for conversion of U.S. light duty vehicles into PHEVs while also studying the effect it could have on emissions as well as the impact that this change will have on the grid is undertaken in [18]. While this paper draws many conclusions regarding energy requirements and emissions across the 12 NERC regions, these conclusions are not discussed here as they are out of the scope of this masters’ thesis. Regarding PHEVs’ impact
on the DS, this study suggests that supplying 73% of the energy requirements of the U.S. light duty fleet of vehicles would add an additional load of 910 billion kWh to the electrical grid. This would force the grid to operate at nearly full capacity at all hours of every day. This effectively flattens the current peak and valley load that is on the grid and could have a huge impact on reliability while also forcing up wholesale electricity prices (due to demand) and encouraging the development of a new generation of technologies that are less expensive. This would also most likely mean the eventual use of planned outages in order to perform plant maintenance. Smart charging and vehicle-to-grid (V2G) technology are suggested as possible solutions to these issues. A detailed analysis of the economical benefits of PHEVs is examined in [10]. A typical PHEV is assumed to be driven 33 miles per day and is charged using electricity from the grid. Analysis is performed using life cycle cost (LCC) analysis for consumers and electricity cost for utilities. While admitting that more economic analysis needs to be done, this paper concludes that there are economical benefits for both consumers and utilities with regards to off-peak charging of PHEVs. The effects of PHEV penetration on generation expansion are studied in [19]. This paper uses the National Energy Modeling System (NEMS) tool and suggests examining four different charging profiles, all at high PHEV penetration levels. These charging profiles include uniform charging, home-based charging, off-peak (9 P.M. to 11 A.M.), and V2G charging. The authors also assume that all PHEV batteries are capable of driving 20 miles and the average consumer drives 33 miles per day. One interesting assumption made is that only 75% of PHEVs can be charged electronically at any given time due to possible infrastructure restrictions (i.e. charging stations not in place, etc.). All simulations are run across the entire U.S. The paper concludes that while all charging methodologies produce a need for new sources of power generation while the V2G charging plan causes the smallest capacity expansion and the smallest infrastructure cost.
A detailed discussion on the impacts of PHEVs on the power grid is developed in [20]. This study suggests that there may be three main impacts from PHEV integration into the power grid: i) an increase in transformer temperatures due to increased load, ii) reduced wear-and-tear on the transformer bushings due to flattened load and iii) increased harmonics due to PHEV power electronics. While the first two impacts may be able to offset each other (reduced wear-and-tear will compensate financially for decreased lifetime due to the increased load), there is concern that power harmonics could have a major impact on transformers. The remainder of the paper develops
a mathematical model for examining these impacts and concludes that the impacts will be widely varied in different parts of the power grid.
In [21], it has been mentioned that the main sources of today’s carbon emissions are from the electricity and transportation infrastructures. An objective of a cyber-physical power system (CPPS)1 is to integrate renewable energy sources and gridable vehicles (GVs) to minimize operation cost and maximize emission reduction. A cyber-physical energy system consists of renewable energy, GVs and conventional thermal units. PEVs can be used as loads, sources and energy storages in a CPPS. A smart grid is a large CPPS and takes into account all the conventional and green distributed energy resources, dynamic data from sensors and smart operations needed (e.g. charging/discharging, control, etc.) from/to the grid in order to reduce both operation cost and carbon emission. If a large number of PEVs are connected to a smart grid randomly, peak load might be very high. The use of conventional thermal power plants to sustain electrified transportation will be economically expensive and environmentally unfriendly. Intelligent scheduling and control of energy system elements have great potential for evolving a sustainable, integrated electricity and transportation infrastructure. Three cases listed below were studied to illustrate the effect of PEVs in an integrated electricity and transportation infrastructure:
Case 1: Random Model: PEVs are charged/discharged randomly;
Case 2: Intelligent Dynamic Load-Leveling Model: PEVs are charged from conventional generation using load-leveling2 optimization;
Case 3: Smart Grid Model: PEVs are charged from the grid with renewable energy sources at off-peak hours and discharged to the grid at peak hours.
The smart grid model is thus a promising approach for sustainable integrated electricity and transportation infrastructure whereas the random mode is not practical. Excess load from PEVs is
1 Cyber-Physical Power Systems (CPPS) consist of significant cyber components that manage the physical electric
power infrastructure under distributed control of power electronics devices. This represents a departure from more centralized SCADA-type control.
2 A method for reducing the large fluctuations that occur in electricity demand, for example by storing excess electricity
intelligently distributed to off-peak hours using optimization in the intelligent dynamic load- leveling model.
A methodology for modeling and analyzing the load demand in a DS due to EV battery charging has been presented in [7]. The method is stochastically formulated in order to consider the stochastic nature of the start time of individual battery charging and the initial battery SOC. The EV load demand can be dictated to some extent by the electricity tariff structure. Three types of typical electricity tariff structures are considered: fixed electricity rate, time-of-use electricity rate, and real-time electricity rate. The fixed electricity rate refers to the tariff in which energy charge per kWh remains constant regardless of the time of use. Time-of-use electricity price divides the tariff into two main blocks: off-peak and on-peak price. The real-time price, i.e., the electricity rate per kWh varies by time of day and month of year.
Four EV charging scenarios have been developed in this paper, comprising uncontrolled domestic charging, uncontrolled domestic off-peak charging, smart domestic charging and uncontrolled public charging. Since not all EVs in the DS start charging simultaneously, it is assumed that the time of switching on an individual charger is a random variable, with a probability density function, which is determined by the electricity tariff structure and the pattern of vehicle usage. The initial SOC of the EV battery (residual capacity since last charge) is also assumed to be a random function of the total distance it travels since it was last charged. The distribution of initial SOC can be assumed therefore to have a probability density function. The value of SOC varies from zero to the full capacity of the battery.
The electricity tariff structure, vehicle traffic patterns (usage) and battery types are global variables: the structure of electricity tariff and vehicle traffic patterns determine the start time of EVs battery charging load; the traffic patterns (daily mileages) determine the residual battery capacity since last charge, i.e., the initial SOC before recharging; while the battery types determine the charging characteristics. The smart charging method that optimizes the start time and the number of batteries starting charging at each time interval is the most beneficial to both the distribution network operator and EV customers. However, starting charging simultaneously during the peak load time will impose a new peak to the power system. In addition, EV can introduce a new peak or near peak load in early off-peak period.
A comprehensive approach has been proposed in [3] for evaluating the impact of different levels of PEV penetration on distribution network investment and incremental energy losses. A large-scale distribution network planning model has been used for the calculation of the required network investment with different future levels of PEV penetration. Each distribution area is defined by its size and location. The total population, the location and demand of consumers are also known. The base case distribution network in each distribution area considers that no PEV is connected yet. Three scenarios, representing PEV penetration levels of 35%, 51%, and 62%, have been modeled. These penetration levels would be achieved by 2020, 2030 and 2050, respectively. In addition, two different modes of PEV charging are considered: normal and fast. A behavior pattern of charging and driving hours is also assumed for PEVs. For each PEV penetration scenario, the operation of the electric distribution network is analyzed at peak and off-peak hours. The number of connected PEVs and modes of charging are different for peak and off-peak hours. The large-scale planning distribution model computes quasi-optimal reinforcements to the base case network in case they are needed to connect and to supply the load required by PEVs. This model also computes incremental energy losses with respect to the base case due to PEV charging. In addition to the number and type of PEV in each scenario, it is needed to define their connection and charging patterns at peak and off-peak hours. In this paper, it is assumed that 85% of the PEVs are charging at off-peak hours and most of them in a slow or normal charge mode. At peak hours, it is assumed that 40% of the PEVs are connected, 90% are charging, some of them in a fast charging mode and 10% are injecting power into the grid. This approximation is based on EPRI’s studies [20]. The possibility of V2G has been also considered. Under this mode, a percentage of the total PEVs are modeled as injecting energy into the grid at peak hours when electricity prices are higher assuming that time-of-use tariffs are implemented. The considered rated power for this operation mode goes from 3 to 10 kW.
1.3 Project Objective
The main goal of this project is to establish a methodology for modeling and analyzing the load demand in a DS due to EV battery charging in order to assess the impact of this new stress on DS. It is done by considering high penetration rates of EVs in the power system and by proposing strategies to mitigate the new problems and turn them into opportunities.
The questions to be answered fall in three categories: 1) EVs as electric loads
How much consumption represents the load of EVs?
What are the expected charging periods?
Are there optimal charging strategies? 2) Distribution Networks
Are existing networks capable to feed the expected consumption?
Will distribution energy losses increase significantly by adding EVs as a load? 3) Generation and System Operation
How much should we increase the installed capacity?
Could EVs provide storage capability and ancillary services to improve system operation?
1.4 Methodology
The modeling required to integrate EVs as loads within the distribution grid is of great importance, since the validity of the results are only as good as the models that are used [14]. The models presented in this project, are based on the physical behavior of EV batteries (EV charging model [16]), but in order to treat the diversity that is naturally present in large populations of EVs, we build in details our statistical distributions that are representative of these populations, considering the diversity in battery types, random SOC of the batteries, type of charge (level I, II or III), etc. [23].
There is also the need to develop statistical mobility models for EVs, based on typical driving patterns (origin, destination, distance traveled in a day, etc.). This allows determining the DS from which the EVs draw their electricity (mobile load) [2], as well as the temporal load profiles
associated to EVs [11]. Socio-economical data are also required in order to forecast the penetration rate of EVs in different geographic territories. All data above are of course related to power system data, which also exhibit time-dependent probabilistic fluctuations. The fusion of these two layers of probabilistic events (temporal fluctuation of load and temporal fluctuation of vehicles’ location) represents a major modeling challenge, and it forms the core of the originality of this work.
CHAPTER 2
INVENTORY OF EVS AND CHARGING OPTIONS
It is universally accepted that gasoline engines cannot be the long-term solution for transportation and that EVs combined with green generation sources is the only sustainable way to address this issue. Indeed, environmental concerns will unavoidably lead to an electrification of the transportation sector. Hence it is just a matter of time before EVs become the most popular means of transportation. The barrier that slows down their penetration is the high cost of the batteries, but despite this fact, EVs already provide consumers with a lower energy and operating cost than gasoline engines, and therefore offer a way to reduce dependence on petroleum. The purpose of this chapter is to introduce most kinds of EVs that have been commercialized and entered in the Canadian market, as well as charging options and charging profiles. However, the information on EVs shown in this chapter does not represent a rule to be followed. It collects the common specifications observed in the EV industry. Actually, it can be a survey to use in researches regarding EVs and their impacts on the power systems (smart grids), environment, etc.
2.1 Electric Transportation
Petroleum products presently power Internal Combustion Engines (ICEs) to provide 95% of the world’s motorized movement of people and freight. The use of petroleum products to fuel ICEs providing land transportation is likely to decline during the next several decades and be replaced chiefly by electric traction. There are two strong reasons for moving away from the use of oil products as the main fuel for transportation: reduced availability of oil and avoidance of climate change [23]-[25].
Late in 2010 the first mass-produced EVs hit dealer showrooms, bringing car buyers a new, electric option. Electric cars offer performance, safety and versatility and can be charged from the electric grid, providing convenient, low-cost and at-home charging. Displacing gasoline with electricity also lowers emissions and decreases petroleum use. On a typical day half of all drivers log 40 km or less, so EVs, if widely adopted, could reduce petroleum fuel consumption by 70- 90% [26].
The market for EVs in North America is growing as Canadians and Americans look for cleaner and more efficient vehicles. Research confirms that consumers in North America are willing to pay
more for an EV if the environmental benefits are significant. In Canada, it is expected that these benefits can be achieved because the majority of electricity in Canada is generated from renewable and low-emission sources [24].
This chapter contains valuable information regarding the commercial EVs, their components, types, electrical specifications and charging methods. The information was taken from manufacturers technical web sites.
2.2 Electricity as an Alternative Fuel for Land Transportation
Electricity and electric motors figure strongly in comparison to oil and ICEs. Electric traction has numerous advantages in addition to causing less local and global pollution and obviating dependence on oil. These advantages include the following [24]:
Efficiency
Electric motors convert up to 90% of applied energy to traction. Gasoline engines normally convert no more than 30% of applied energy and diesel engines convert up to 40%.
Torque
Electric motors provide maximum output (torque) at zero or near-zero revolutions, i.e. when it is most required. An ICE’s maximum torque is typically delivered at several hundreds or thousands of revolutions per minute, requiring gearing to move a stationary vehicle. Electric motors’ high torque at low speeds contributes to their superior performance in stop-start conditions and during acceleration from low speeds (electric-drive systems can require simple gearing to provide high speeds).
Regenerative braking
Electric motors can capture kinetic energy during deceleration, storing it as electrical energy and thereby reducing energy consumption and mechanical brake wear.
Power per unit weight or unit volume
For a given power output, electric motors are much smaller than ICEs, even without the ICEs’ required emission control systems. Electric motors’ higher power/weight ratios mean less energy is required to move traction systems and more room is available within the vehicles.
Simplicity
Electric motors typically have one or a few moving parts. ICEs usually have hundreds of moving parts. In principle, EVs are thus more reliable and cheaper to maintain (from a mechanical point of view).
Silence
Electric motors are almost silent in operation. ICEs harness controlled explosions of fuel and air mixes. They are intrinsically noisy, adding to urban stresses.
Storage of grid energy in vehicles (V2G)
The storage devices in EVs, in principle, can be used as storage for the electric grid, potentially reducing requirements for peak generation.
Flexibility as to ultimate energy source
EVs that use externally supplied electricity (e.g. Battery EVs (BEVs), PHEVs) are indifferent as to how the electricity is generated. Nothing has to change inside the vehicle if the fuel for electricity generation changes. Such EVs are thus readily compatible with a transition to renewable generation. ICEs, by contrast, usually need substantial modification to accommodate change of the energy source(s) for which they were designed.
2.3 Types of Vehicles
There are three key types of EVs: Hybrid EVs (HEV), PHEV, and BEV [26].
HEVs contain a small electric battery to supplement the standard ICE. They use a dual-fuel system. Both the electric motor and the ICE are able to drive the wheels. The battery is recharged both by the gasoline engine and regenerative braking. Regenerative braking captures kinetic energy to charge batteries when the driver pushes the brakes. This provides increased fuel efficiency. HEVs cannot be recharged from the grid.
PHEVs are dual-fuel vehicles. This means that both the electric motor and the ICE can be used in this type of vehicles. The added feature of a plug-in is the ability to charge from an electric outlet to extend the use of electricity as a fuel. PHEVs have a smaller combustion engine and a larger battery pack compared to HEVs. Batteries can be charged by the gasoline engine, regenerative
braking and by plugging into the grid. This generally allows for more use of the electric motor and less use of the petrol / gasoline engine.
BEVs are all-electric, have no ICE, and are totally dependent on plugging into the electric power grid. They are powered by an electric motor and battery alone. BEVs can travel farther on electricity than PHEVs, but their total range is more limited. BEVs never use gasoline and most models are designed to travel up to 100 miles between charges.
In this work, we consider only the PHEV and BEV types of EVs which are the ones consuming electricity from the power grid. In order to be able to determine the diversity in battery types, we use the information of several types of EVs.
2.4 Challenges and Opportunities for EV Stakeholders
The future widespread adoption of the PEV will present some unique opportunities for consumers, auto manufacturers, and utility operators. However, responses to the different stakeholders’ questions and concerns must be found for the EV to truly take off. Effective energy management solutions will be needed to make the EV an alternative to traditional combustion-engine-powered vehicles. Purchasing an EV is a major decision for many consumers. Industry partnerships, public programs, and consumer education from electric utilities, vehicle manufacturers, and energy professionals will be essential to ensuring that drivers have access to the information, equipment, and trained professionals they need to enjoy their EVs safely, cost-effectively, and conveniently [1].
Safety
Safety is perhaps the biggest question in consumers’ minds. Consumers need to be informed about how to charge their vehicles at home safely, avoiding electrical hazards and other dangers like falls caused by stray power cords. With emerging standards, charging equipment will meet tough safety requirements developed and tested to avoid these dangers.
Cost
Cost is another concern in the minds of consumers, who may wonder about the impact of EV charging on their home energy bill, the cost of any necessary equipment upgrades, and who is responsible for financing these upgrades. Away-from-home charging is another issue. How much
will it cost? How will consumers pay? There are utilities in US actively working on promoting an incentive to own an EV by offering an EV rate.
Convenience
Convenience is not to be underestimated as a major factor in consumers’ EV purchasing decisions. “Range anxiety” has long been cited as a stumbling block to EV adoption. Consumers need to know how far they can go on a charge, where to recharge (At home? At work? In public places like shopping centers?), and how long it will take.
Once consumers overcome these barriers to EV adoption, they can begin to reap the benefits of cleaner, quieter, cheaper transportation without sacrificing safety or convenience.
2.5 Selected Electric Vehicles & their Comparisons
Because most EVs have batteries with at least slightly different charging profiles and because it is very unlikely that consumers in any area own one single type of EV from a single company, we must consider the distribution of different types of vehicles and batteries in fleets of EVs. This is extremely important as manufacturers compete with each other based on battery life, charging time and charge duration. The determination of the right mix of vehicles must also be based on socio-economic data in a given geographical area [27].
Most car manufacturers are currently working on the development of the electric car. Some models are already being marketed and in circulation and a wide range of models will be available during the next few years. There are more than 28,000 electric cars on the road in Canada and among them, there are 21 different models [28].
In this project, we are using the information of 21 EVs, i.e. 13 PHEVs and 8 BEVs models. The 13 selected PHEVs are: Audi E-Tron, BMW e330, BMW i8, BMW X5 40e, Chevrolet Volt, Chrysler Pacific PHEV, Ford C-Max Energi, Ford Fusion Energi, Hyundai Sonata PHEV, Mercedes Benz S 550e, Porsche Cayenne S E-Hybrid, Porsche Panamera S E-Hybrid, and Volvo XC90 Twin Engine. The 8 selected BEVs are: BMW i3, Chevrolet Bolt, Ford Focus Electric, Kia Soul EV, Mitsubishi i-MiEV, Nissan Leaf, Tesla Model S and Tesla Model X.
Figure 2.1: Selected EVs in our case studies [28]
Tables 2.1 and 2.2 show the most relevant information about those EVs. They were taken from manufacturers’ web sites and may certainly change rapidly over time:
Table 2.1: Performance Comparison of the Introduced EVs
Name Category Electric Motor Power
Engine
Power (hp) Top Speed
Acceleration (0-100 kM/h)
Starting Price (MRSP)3
Audi E-Tron PHEV 75 kW 204 hp 220 km/h 7.6 s 45,900.00 CAD
BMW 330e PHEV 65 kW 247 hp 225 km/h 5.4 s 52,100.00 CAD
BMW i3 BEV 125 kW 170 hp 150 km/h 7.2 s 47,300.00 CAD
BMW i8 PHEV 98 kW 362 hp 250 km/h 4.4 s 150,000.00 CAD
BMW X5 40e PHEV 83 kW 308 hp 210 km/h 6.8 s 74,000.00 CAD
Chevrolet Bolt BEV 150 kW 200 hp 145 km/h 7 s 42,895.00 CAD
Chevrolet Volt PHEV 111 kW 149 hp 160 km/h 8.4 s 39,590.00 CAD
Chrysler Pacific PHEV PHEV --- 248 hp --- --- 56,495.00 CAD
Ford C-Max Energi PHEV 68 kW 141 hp 164 km/h 7.9s 39,729.00 CAD
Ford Focus Electric BEV 107 kW 143 hp 135 km/h 8.6 s 31,998.00 CAD
Ford Fusion Energi PHEV 68 kW 141 hp 136 km/h 7.9 s 36,399.00 CAD
Hyundai Sonata PHEV PHEV 50 kW 202 hp N/A N/A 43,999.00 CAD
Kia Soul EV BEV 81 kW 109 hp 145 km/h 11.5 s 35,395.00 CAD
Mercedes Benz S550e PHEV 85 kW 436 hp 210 km/h 5.2 s 102,600.00 CAD
Mitsubishi i-MiEV BEV 47 kW 66 hp 130 km/h 11.5 s 27,998.00 CAD
Nissan Leaf BEV 80 kW 107 hp 150 km/h 9.9 s 37,398.00 CAD
Porsche Cayenne S
E-Hybrid PHEV 71 kW 333 hp 243 km/h 5.9 s 89,400.00 CAD Porsche Panamera S
E-Hybrid PHEV 71 kW 416 hp 268 km/h 5.2 s 106,600.00 CAD
Tesla Model S BEV 283 kW 417 hp 249 km/h 4.4 s 95,300.00 CAD
Tesla Model X BEV 386 kW 762 hp 249 km/h 6.2 s 132,000.00 CAD
Volvo XC90 Twin
Engine PHEV PHEV 65 kW 400 hp 230 km/h 5.6 s 73,400.00 CAD
Table 2.2: Electric Specification Comparison of the Introduced EVs
Name Category Battery
Capacity Time to Charge
4 Electric
Range Total Range
Audi E-Tron PHEV 8.4 kWh 2.5 hrs 26 km 665 km
BMW 330e PHEV 7 kWh 2 hrs 22 km 358 km
BMW i3 BEV 33 kWh 6.25 hrs 160 km 240 km
BMW i8 PHEV 7 kWh 2.0 hrs 24 km 509 km
BMW X5 40e PHEV 9 kWh 3 hrs 28 km 695 km
Chevrolet Bolt BEV 60 kWh 9.5 hrs 383 km 383 km
Chevrolet Volt PHEV 18 kWh 4.5 hrs 85 km 675 km
Chrysler Pacific PHEV PHEV 16 kWh 2 hrs 53 km 911 km
Ford C-Max Energi PHEV 8 kWh 2.25 hrs 32 km 856 km
Ford Focus Electric BEV 21 kWh 4 hrs 122 km 122 km
Ford Fusion Energi PHEV 7.2 kWh 2.5 hrs 34 km 884 km
Hyundai Sonata PHEV PHEV 9.8 kWh 2.7 hrs 43 km 925 km
Kia Soul EV BEV 27 kWh 4.5 hrs 149 km 149 km
Mercedes Benz S550e PHEV 8 kWh 2 hrs 22 km 724 km
Mitsubishi i-MiEV BEV 16 kWh 5 hrs 100 km 100 km
Nissan Leaf BEV 30 kWh 5 hrs 172 km 172 km
Porsche Cayenne S E-Hybrid PHEV 11 kWh 3 hrs 22 km 772 km
Porsche Panamera S E-Hybrid PHEV 9 kWh 2.5 hrs 25 km 850 km
Tesla Model S BEV 90 kWh 12 hrs 435 km 435 km
Tesla Model X BEV 90 kWh 12 hrs 413 km 413 km
Volvo XC90 Twin Engine PHEV PHEV 9.2 kWh 2.5 hrs 22 km 563 km
4 Time to charge is the average time to charge the battery with the available Level 2 (240V charger), which uses a
Emission and cost to drive comparison of the introduced EVs are shown in Appendix A.
2.6 Charging Options
Driving patterns produce an impact on the distribution grid simply by defining where PEVs will be when they are charged. A typical daily drive for any person starts at home, goes to work, maybe to lunch, back home, then possibly out for a small trip to the store. This means that at any moment during the day, a PHEV can be in the garage, in an employer’s parking lot, in a restaurant/store parking lot, or on the road. This suggests studying where PEVs will be when charging. The main locations for charging and some of their characteristics are provided below.
Charging at home
Home is the most economical location for charging an EV. Typically, vehicles spend most of the night at home, making it an ideal place and time frame to charge.
Charging at work
EV users will likely be concerned about having enough charge to get back home. They will want to charge their vehicles at work, especially those who are near the limit of the vehicle’s range.
Charging at public places
EV owners will appreciate the convenience of charging at public places to ensure enough range is available to complete all their errands. Retail store and restaurant owners have an opportunity to attract customers by providing charging stations.
According to Hydro-Quebec, the main charging site for EV owners will be at home. At night, vehicles are parked there for a number of hours.
At the current time, it is expected that more than 80% of EV charging will be done at home. Therefore, in the model presented in this project, we assume that the vehicles can charge only when they are at home.
2.7 Charging Characteristics
Charging characteristics are simply the loading characteristics of EVs in different locations. Charging characteristics typically incorporate the type of circuit, the voltage drawn, the load added on the power system and the duration of the charge [2]. It is important to include these characteristics in our investigations in order to build accurate models of EVs.
2.7.1 Electrical Ratings
In North America, there are three charging levels or modes, defined according to their output (see Table 2.3) [29]. Two levels are defined by SAE J1772 [30]. Level 1 corresponds to a voltage of 120V AC and Level 2 to a voltage of 208 or 240V AC. At present, only the CHAdeMO-JEVS5 is used for charging at a higher rate [29].
Table 2.3: Comparison of Charging Levels/Modes
Characteristic Level 1 Level 2 CHAdeMO Voltage 120 V 208 or 240 V Up to 500 V
Type of Current AC AC DC
Typical Output 1.4 kW 3.6 or 7.2 kW 50 kW Maximum Output 1.9 kW 19.2 kW 50 kW Charge Time 12 hrs6 2.5-5 hrs 20 min7
Connector J1772 J1772 CHAdeMO
5 A standard for fast charge stations promoted by a Japanese association. “CHArge de MOve” (charge for moving). In
Japanese, CHAdeMO evokes the phrase.
6 Charge time for a fully discharged 16 kWh battery, at the typical output (120 V).
Typical charging parameters that are usable in a North American residence are provided in Table 2.4:
Table 2.4: Typical Charging Parameters in North America
Station Type Outlet Voltage Cable Current Station Output
Level 1 120 V 12 A 1.4 kW
Level 2 240 V 15-A Station (2 pole 20-A breaker) 3.6 kW
Level 2 240 V 30-A Station (2 pole 40-A breaker) 7.2 kW
Hydro-Quebec and its partners have begun rolling out a network of public charging stations to help improve the autonomy of EVs. CAA-Quebec is a partner in this initiative. EV drivers enjoy greater freedom with the ability to charge their vehicles during their travels.
The ideal place to recharge the vehicle, however, is at home. Installation of home charging stations is now possible because all EVs sold in North America come equipped with an SAE J1772 receptacle. This coupling system allows for vehicle recharging using 120V or 240V household alternating current.
Level 1 (120V) charging stations
Level 1 charging station connects to any standard 120V outlet; 89% of households in Quebec already have access to a standard outlet (level 1 charge) at their parking spaces [29]-[31]. So, Quebec is already well positioned to meet residential charging demand. The charging station looks like a large pistol attached to a cable. It takes 6 to 8 hours to fully charge a PHEV, and 11 to 16 hours for a BEV. The electrical demand is comparable to that of a 1.5 kW air conditioner [29].
Level 2 (240V) charging stations
Charging time can be cut in half with a Level 2 station. This requires a dedicated 240V circuit permanently connected to the household electrical distribution panel [29]-[31].
With a 3.6 kW charging station (the type most often used at present), charging a PHEV takes between 3 and 4 hours, while charging a BEV takes from 6 to 8 hours. The electrical demand with this system is about the same as for a 40-gallon water heater.
Installing a level 2 charging station
EV owners can buy a wall-mount or freestanding (pedestal-mount) Level 2 charging station from a dealership, a certified electrician or a hardware store. Most can be installed either inside or outside. The job of connecting the charging station to the household electrical panel, however, must be done by a qualified electrician [31].
Safety in EV charge station
There is some safety precautions about using such a powerful electrical connection. All charging stations are equipped with a ground fault circuit interrupter (GFCI), which reduces the risk of electric shock [29]. Also, electricity will not flow through the plug’s connector pins unless the plug is correctly inserted into the receptacle on the vehicle. The coupling connector is equipped with weather-tight seals, and a retention component keeps it from disconnecting if someone or something accidentally pulls on the cable [29]-[31].
Since we chose to consider only home charging, and since all EVs sold in North America equipped with a SAE J1772 receptacle can be charged either at 120V or 240V, data in Table 2.6 can all be used when considering realistic charging conditions.
2.8
State of Charge of EV Battery
The SOC corresponds to the remaining charge of the battery divided by its maximum charge. It is a direct measure of the remaining stored energy. The SOC is affected by battery operating conditions such as load current and temperature [32].
2.9 Depth of Discharge
The depth of discharge (DOD) is the percentage of battery capacity (rated capacity) to which a battery is discharged. The withdrawal of at least 80% of battery (rated) capacity is referred to as deep discharge. It should be noticed that the initially fully charged battery is discharged until 20% SOC is reached. After reaching 20% SOC, the battery is operated in the charge sustaining cycle [32].
2.10 Charging Stages of EV Battery
Lithium-ion is the top technology for EV batteries due to a combination of performance capability, safety, life and cost. Currently, several battery-charging strategies have been proposed with the development of EVs. Among them, the constant current/constant voltage (CCCV) charging technique is the mostly popular type. In the CCCV charging process, the battery is charged at CC until the battery voltage reaches its upper cutoff voltage. Then the battery switches to a CV charging process until the current reaches a predetermined small value (3% of the rated current) [33].
The charging stages of Lithium-ion batteries are illustrated in Figure 2.3 [34]:
Figure 2.3: Charging stages of Lithium-ion batteries [34]
Battery charge profile of EVs can be determined based on the charge current model of Lithium-ion batteries in Figure 2.3.
2.11 EV Battery Charging Profile
A generic trapezoidal charging model for EV batteries is used all along this project. Details of the selected battery charge profile is explained in chapter 4.
CHAPTER 3
DRIVING PATTERNS & MOBILITY INFORMATION
As already mentioned in the previous chapter, driving patterns have an impact on the electric network by defining where PEVs will be when they are charged. So, it is necessary to study where PEVs are located when charging. The truth of the matter is that the final destination of most driving patterns is highly stochastic, but the average mileage driven during any given day has been determined to be roughly 26 miles (~ 42km) per day [2]. Thus, the majority of papers calculated the daily driven distance by using this statistic. In order to handle the randomness of the locations of the PEVs, multiple studies simply place the PEVs randomly across radial distribution networks.
There is a need to develop statistical mobility models for PEVs, based on typical driving patterns (origin, destination, distance traveled in a day, etc.). This allows determining the distribution networks from which the PEVs draw their electricity (mobile load) [2], as well as the temporal load profiles associated to EVs [11]. Socio-economical data are also required in order to forecast the penetration rate of EVs in different geographic territories.
We are interested in using stochastic models of driving. In other words, instead of using average and expected values for the number of miles driven per day, we will use stochastic models across multiple simulations in order to get a more realistic picture and analysis of this situation.
All data above are of course related to power system data, which also exhibit time-dependent probabilistic fluctuations. So, there would be the combination of these two layers of probabilistic events (electric load data and vehicles mobility data) that demonstrates our major modeling challenge.
3.1 Studied Network
The sector under investigation is supplied by a large 120/12 kV urban substation located in the Montreal area, Canada. The substation supplies 16 distribution feeders and more than 18,200 customers. The simulations realized in the project targeted one particular distribution feeder supplying 3621 clients through 43 transformers.
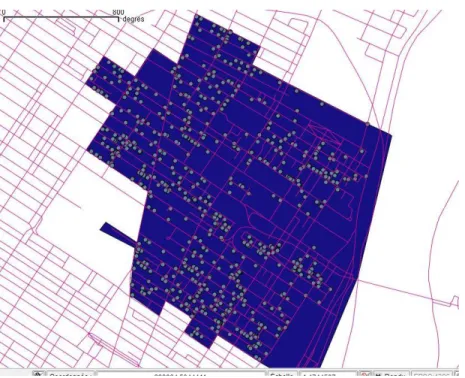
The map of this area (distribution substation of DeLorimier in Montreal) which has been prepared by HydroQuebec, is shown in Figure 3.1:
Figure 3.1: Area covered by the Delorimier substation in Montreal
Appendix B shows another layout of the studied area.
3.2 Source of Mobility Data
The main source of the mobility data used in this project is the Origine-Destination survey, conducted in Montreal in 2008, and aimed at providing a quite accurate picture of most important displacements habits of people, namely: origin, destination, trip purpose, transportation mode, and departure/arrival hours [37]. In this survey, some socio-economical variables were also collected, for instance the annual income of families, ages of people at a given address, etc. Figure 3.2 shows the sampling realized in the selected case study area.
Figure 3.2: Sampling used for the mobility survey in the area supplied by the considered substation
3.3 Statistical Data of the Selected Area
We computed the main information about the residents of this area by their transportation data. The main information is in excel file format and the required information are extracted via Matlab code. They are explained completely here.
Distribution of houses in the area
The number of houses in this area is 21879. The number of residents per house is presented in Table 3.1 and the income level of residents is presented in Table 3.2.
Table 3.1: Number of Houses with Different Number of Residents
No. of Residents Per House Every House
One Two Three Four Five Six and More No. of Houses 12019 6967 1625 950 219 99


![Figure 2.3: Charging stages of Lithium-ion batteries [34]](https://thumb-eu.123doks.com/thumbv2/123doknet/2323734.29751/41.918.198.720.418.838/figure-charging-stages-lithium-ion-batteries.webp)