an author's
https://oatao.univ-toulouse.fr/21833
https://doi.org/10.1016/j.commatsci.2018.09.005
Chatti, Fadhel and Bouvet, Christophe and Poquillon, Dominique and Michon, Guilhem Numerical modelling of
shear hysteresis of entangled cross-linked carbon fibres intended for core material. (2018) Computational Materials
Science, 155. 350-363. ISSN 0927-0256
Numerical modelling of shear hysteresis of entangled cross-linked carbon
fibres intended for core material
Fadhel Chatti
a, Christophe Bouvet
a•
*
, Dominique Poquillon
h,
Guilhem Michon
a a lnsdlut CUment Ader, CNRS UMR 5312, Universiti de Toulouse, ISAE-SUPAERO, 3 Rue Caroline �e, 31400 Toulouse, Fronœ b CIRIMAT, Universiti de Toulouse, INP-ENSIACET, 4, allée Emile Monso, BP 44362, 31432 Toulouse Cedex 4, Fran::eABSTRA CT Keywords:
Entangled cross-Hnlœd fibres Finite element mode! Shear hysteresis Vibration damping Core material
The analysis of an entangled cross-linked fibrous material at low deformation is explored as way of predicting the shear behaviour, especially the shear hysteresis. This paper presents a 3D finite element mode! to char acteriz.e the carbon fibre network rigidified by epoxy cross-links. The morphology of the representative volume element (RVE) is studied to guarantee that it is representative of the actual material that was characterized experimentally. Two steps are simulated, namely the initial compression during the shaping and before the polymerization of the epoxy resin and the cyclic shear testing of the material with its rigidified network of fibres. A numerical simulation of an RVE is used to present a description of the measured hysteresis loop that is de
composed of linear and nonlinear parts. A comparison between the numerical prediction and the experiment data is discussed. Even if the 3D numerical mode! under-predict the average shear stiffness of the material, it can capture the complex shapes of the measured hysteresis loops at different strain amplitudes.
1. Introduction
Composite materials have become increasingly used in numerous sectors, including automotive, aerospaœ and marine, due to their technical advantages, such as their desirable stiffness to weight ratio [1]. Sandwich structures are lightweight composite structures that have become indispensable in many industrial applications. They are corn posed of two thin and rigid skins separated by a thick and light core material in order to offer high stiffness for bending applications. Many theories and analysis methodologies have been presented to understand these structures [2 5). Studies have been conducted to develop and design different configurations of core materials in order to enhance the performance of the whole sandwich structure [6 8). Until recently, the honeycomb was the most used core material in sandwich structures because it offered the best stiffness to weight ratio. However, it has limitations with regards to the implementation in complex structures, proœss control and, most notably, vibration damping. Thus, different methods have been tested to enhance the damping of sandwich struc tures [9 11).
Based on the investigation of Poquillon et al. [12), Mezeix et al. [13,14) proposed a new fibrous material that can be used as a core material to enhance the vibration damping of the sandwich structure. This structure provides a high energy dissipation through friction
• Corresponding author.
between the fibres [15). lt is based on entangled cross linked fibres that can be manufactured from aramid, glass, carbon fibres or from a mix ture of them.
In this study, a 3D numerical modelling method was developed to better understand the intrinsic behaviour of the entangled cross linked material and to mode! its vibration behaviour. Dunlop [16) is among the first researchers to present an analytical mode! to exhibit mechan ical hysteresis. He produced the hysteresis loops during the compres sion release cycling of the fibre assembly by a combination of frictional slippage effects and van Wyk's [17) theory of compression of fibre as semblies.
In 1989, Carnaby and Pan [18) presented a theory for the corn pression hysteresis of fibre assemblies. They developed an iterative al gorithm, in which the system geometry is updated on successive in crements, to cope with large and nonlinear deformations. A comparison between the theoretical prediction and the experimental data showed a reasonable agreement. They concluded that the effects of slipping fibres are among the main causes that led to differences in the mechanical hysteresis behaviour. They also stated that the mode! could be im proved by taking the fibre viscoelasticity in the total hysteresis into account. Beil and Roberts [19) examined the phenomenon of corn pression hysteresis through an analysis of the energy of the fibre net work. Their mathematical mode! can predict the dissipation of energy
E-mail addresses: fadhel.chatti@isae.fr (F. Chatti), christophe.bouvet@isae.fr (C. Bouvet), dominique.poquillon@ensiacet.fr (D. Poquillon),
guilhem.michon@isae.fr (G. Michon).
due to dry friction. However, the stabilization of the mechanical be haviour during the loading cycle and the residual deformation were not properly modelled. According to the authors, this may be because the viscoelastic effects were neglected. Barbier et al.[20]used a discrete element simulation adapted from molecular dynamics in order to pre dict the hysteresis between the compression and release of entangled semiflexible fibres. They concluded that hysteresis is related to the friction of contact on normal forces [21]. However, because of the limitations of the computing resources available, they were not able to simulate a sufficient number of fibres to get a realistic initial config uration compared to the experimental data.
Thus far, studies on an entangled cross linked material have focused on the vibration behaviour [22]. An original method combining ex isting hysteresis models was introduced. Al Majid and Dufour Gen eralized Dahl’s Model[23,24], along with other hysteresis models, have been used to model the hysteresis loops. The three nonlinear parts of the behaviour were combined after modelling them separately.
This paper presents a numerical model that characterizes the hys teresis loop of an entangled cross linked material during shear cycling. It comprehends of the origin of the different parts of the behaviour through the study of morphological parameters.
2. Material and experimental data 2.1. Material fabrication
The manufacturing of an entangled cross linked material was done manually at the laboratory scale. Fig. 1(a) shows scanning electron microscope (SEM) images of an entangled cross linked material made with carbonfibres. The fibres have a diameter of several micrometres and are randomly bonded by the resin junctions.
The manufacturing process of the entangled cross linked material was devolved by Mezeix et al.[6,13]and it was described as consisting of four main steps.
•
The yarn is cut to afixed length because the appropriate length for better entanglement depends on the kind offibre.•
After placing the cutfibres in a 64 L blower room, compressed air at a pressure of 6 bars is used to separate the yarns and entangle the fibres simultaneously.•
Resin droplets are sprayed to block the contacts between fibres, where the pressure of paint spray gun is set at 2 bars.•
The moulding and polymerization process starts by placing the en tangled cross linked fibres in the mould. Epoxy polymerization is achieved in an oven at 70 °C during 8 h.Experimental data are available for materials made from carbon fibres, glass fibres and aramid fibres for different fibre volume fractions (from 6 to 12%). In the present work that is devoted to numerical si mulation, the most studied configuration involves an 8.5% volume fraction of the carbonfibre. This fibre was chosen because of its high performance compared to other types offibres. The numerical simula tions will be compared to the experimental data. These carbonfibres (Toho Tenax, HTS 5631, 800tex F1200) were cross linked after their entanglement by a resin epoxy (Sicomin, SR1710). Epoxy resins are widely associated with carbonfibres in the manufacture of aerospace composites.Table 1presents the characteristics of the carbonfibres and epoxy resin.
2.2. Experimental data
In a sandwich structure, the core material is used mainly in shear, so the investigation of the shear behaviour of an entangled cross linked material would be of great interest[25]. This investigation was carried out experimentally by Piollet et al.[22]. The dimensions of the tested samples were 60 × 40 × 20 mm3 and the cutfibres had a length of 31 mm. Thefibre volume fraction was 8.5%, which corresponds to 7.2 g of carbon. This also corresponds to more than 100 km of total fibre length and more than 3 millionfibres. For this work, 1.44 g of epoxy was sprayed on each sample to join the carbon fibres after the en tanglement. It is important to note that not all contacts became stuck and thefibre separation was not perfect. There were still small strands. The numerical simulation was made withfibres of the same diameter of at least 7μm. This parameter may be adjusted during the simulation to take into account the dispersion observed experimentally but for which no quantitative data is available.
The shear tests were carried out on a BOSE ElectroForce® 3330 machine. During each test, as detailed in[22], two samples were loaded simultaneously in a double lap configuration in order to guarantee shearing only, as illustrated inFig. 2. Experimental testing was carried out for frequencies varying from 1 to 80 Hz and for shear strain am plitudes ranging from 0.05% to 1%. No noticeable effect of the test
Fig. 1. SEM observation of entangled cross-linked carbonfibres with a volume fraction, f, of 8.5%. (a) The red circles indicate cross-linked fibres due to the epoxy resin, the green dashed circles indicate non-cross-linked contacts and the white arrows indicate that some yarn are not perfectly separated such that somefibres were grouped by two or more. b) Magnified view of a tiny yarn with four fibres in the background. (For interpretation of the references to colour in this figure legend, the reader is referred to the web version of this article.)
Table 1
Properties of carbonfibres and epoxy resin according to the supplier data. Diameter (µm) Length (mm) Young’s Modulus (MPa) Density (kg/m3) Poisson ratio Carbonfibre 7 31 240 1770 0.3 Epoxy resin 5 1800 0.3 F. Chatti et al.
P. Chatti et aL
Entangled
cross-linked
"v••···samples ;,".
Load cell
Fig. 2. Experimental set up of the shear tests. Adapted from [20].
I
L
=60mm
frequency was reported. For ail cases, the measured shear stress strain hysteresis loops showed a nonlinear behaviour. This behaviour was observed and analysed after subtracting the linear response of the fibre network. For the present study, the focus will be on the shear stress strain hysteresis curve measured at 1 % of the amplitude and a loading frequency of 20 Hz to validate the numerical modelling.The frequency independent behaviour confirmed that the energy dissipation was mainly due to the dry friction phenomenon and not to the epoxy junctions. This conclusion was the basis for the modelling of the bonded contacts by elastic springs without any consideration of viscous dissipation in the epoxy resin.
3. Initial geometry of the R VE
The numerical modelling of the hysteresis loop of the entangled cross linked material was based on the experimental data. Initially, at the beginning of fabrication, the distribution of the fibre orientation was isotropie and compression testing showed that ail directions were equivalent (6). On the other hand, the crosslinking of the contacts by the resin was done in a mould The introduction and the closing of the mould induced compression. This compression modified the orientation of the fibres. The entangled cross linked carbon fibres were then a transversely isotropie material (with respect to the direction of corn pression). Numerical simulation was therefore done in two stages. First, the compression of an isotropie fibre network where the contacts were free to slide (friction taken into account) was simulated. The volume fraction, as in the process, increased from 1. 7% to 8.5%. Second, a fraction of the contacts was blocked on the network that was generated. The anisotropie reticulated network was then submitted to numerical cyclic shear tests.
In each sample of the entangled cross linked material, there were about 3.35 million carbon fibres and dozens of contacts per fibre. No computer or supercomputer was available to simulate the entire sample due to computational limitations. In this work, a representative volume element (RVE) was determined during the first step as a result of this constraint.
3.1. Generation of fibres in the RVE
An in house pre processing program coded in FORTRAN was used to generate the fibre network in the RVE. The generation of the geometry in the RVE was carried out in the following five steps:
• A point was randomly chosen in the box with a size, s, and this was studied in the next section (Fig. 3).
• The fibre direction, which is represented by the dashed line in
Fig. 4(b), was chosen through a couple of angles (6, <p). Angle
e
is the polar angle that represents the orientation of the fibre against the compression axis, z. In order to obtain a uniform distribution of the fibre directions,e
is selected from a sinus distribution, and the•
Random
� oint
Fig. 3. R.andom point chosen in the RVE.
function of e is defined by sin&d&d<p (Fig. 8). Angle <p is the azi muthal angle representing the angle from the x axis, as shown in
Fig. 4(a). It is selected from a uniform distribution <p e (0, 2Jt). • Two nodes, which fixed the length of fibre, were defined and are
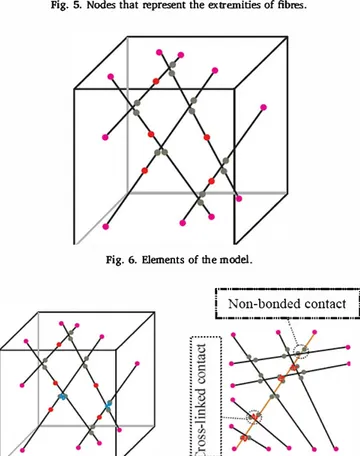
presented as pink dots in Fig. 5. They are the extremities of the fibre in the simulation box and were obtained through the intersection between the fibre direction and the box faces.
• Straight fibres are generated in the box. They are allowed to pass through one another. The green nodes that are represented in Fig. 6 correspond to the limits of the elements. Each fibre was modelled by a variable number of 3D Timoshenko beam elements, depending on both the number of contacts and on its orientation. These green nodes were created on each side of two fibres whenever the distance between them was smaller than the fibre diameter.
• The last step, consisted of linking some of middle nodes (green nodes) by elements that modelled the bonding of the contact by the epoxy cross links. These are presented by blue dots in Fig. 7(a). During the simulation of the first step of the manufacturing process, the resin has not polymerized and all the contacts can slip. On the other hand, after moulding and polymerization, some of the contacts can be blocked, as shown in Fig. 1. The item above was implemented to si mulate the cross linked material.
The insertion of links was carried out upon taking into account the distance between the resin junctions observed in experimental sample. Mezeix (6,14) found that for the same fibre and a volume fraction of 8.5%, the average distance between resin junction was equal to 120�½o40 µm using SEM analysis. This uncertainty is explained by the heterogeneity of the material due to the random spray of epoxy during the manufacturing process and the occasional imperfect separation of the yarn. Fig. 7(b) shows an example of how the insertion of a spring was managed in the model in the case where two out of three contacts were blocked. In this case, two successive contacts were blocked, the next was left free, and so on. At the end of this fibre, the positioning of epoxy "springs" continued on the next fibre. The springs are generated in the mode! following the knowledge of the positions of the generated fibres network.
3.2. Choice of the initial paramew-s of RVE
3.2.1. Size of RVE
The size of the RVE should be well studied to guarantee morpho logical isotropy for each generation of the architectures. Two important morphological parameters should be investigated to find the appro priate size of the RVE. The first one is the average distance between the contacts, because this can have an important influence on the global behaviour of the fibre assembly (26 28). In a former study (29), for each simulation box size tested, ten different draws were carried out to
P. Chatti et aL
Compression axis z
(a)
Random point ..
y
X I I I I I I I•
I•
'
Random
,'
�
oint
Fig. 4. (a) Definition of polar and azimuthal angles of the chosen fibre and (b) generated fibre direction.
Fig. 5. Nodes that represent the extremities of fibres.
Fig. 6. Elements of the mode!.
..
-
..
-.,,_,,_,,_,,,_.,_.,_.,_,,_,,_,,,
!
L,,_,,,_,,_,,_,,, __ ,_,,_,,,_,,_,,_,,_Non-bonded contact 1
Fig. 7. (a) Generation of springs modelling epoxy cross-links and (b) the way used to generate springs linking the contacts of one fibre, which is coloured in orange, with the other fibres. This is an illustration in the case where two out of three contacts are blocked. (For interpretation of the references to colour in this figure legend, the reader is referred to the web version of this article.)
test the representative nature of the simulations. In these previous si mulations, the fibre volume fraction, f, was 6% and it was proven that the more the size of the simulation box increases, the more the mor phological parameters of the simulation are close to those of the real material. In this former study, an RVE was obtained for a cube with a side length of 1 mm. In a preliminary calculation for this study, it was verified that this size is also suitable for a volume fraction of 8.5%.
A good agreement can be observed between the theoretical curve (in black) and the modelling of the RVE (8.5%) (Fig. 8).
This configuration was deemed an acceptable compromise between the representative nature of the fibres generated for the fini te element simulation and the computation time. lt was therefore used for the rest of the study. This study of random orientation distribution is not the only criteria for an RVE to be representative but it is can offer a good assumption about the representativity of the RVE.
3.2.2. Initial distribution of fibre orientations of enmngled cross linked
material
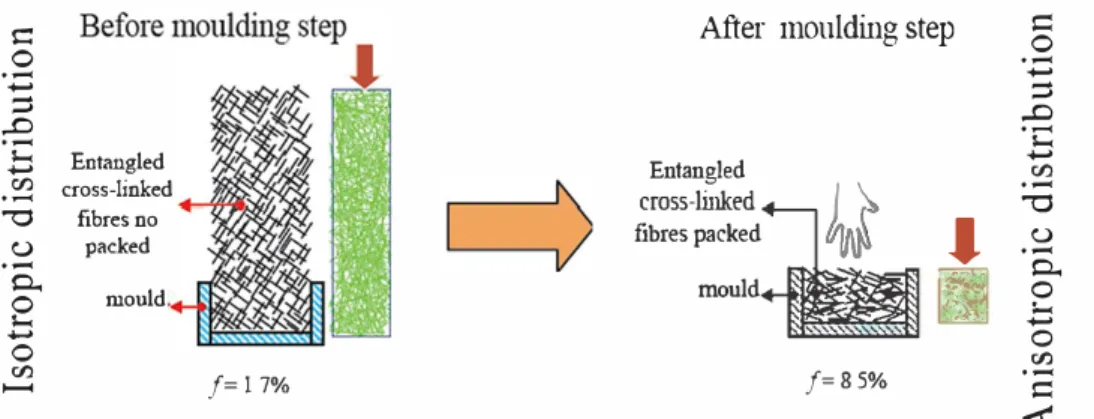
As explained before, during the manufacturing process developed by Mezeix et al. (6,13), two distributions of fibre orientations are en countered (Fig. 9). The first one is the isotropie distribution that is obtained after the entanglement step. This isotropy is lost after the packing of the fibres in the mould, where a new distribution of fibre direction is obtained with more horizontal ones. In this paragraph, the
6% - Size of the REV = 1 mm
5% -4% "
-�
3% 2% -1% ' 0% 0 20 40 60 80 100 120 140 160 180 8 (0)Fig. 8. Distribution of the fibre directions for the ten random geometries gen erated for a cube with a side length 1 mm as the RVE and with a volume fraction of8.5%.
P. Chatti et aL
::::
0·-
...
;::::s ,..0·-
...
1-< r:n·-"O
u
·-
o..
0 1-<...
0 r:n -Entangled cross-linked fibres no packed mould f= 17%After moulding step
Entangledcross
-
linked
6
�
/
fibres packed � mould/=85%
•
□
::::
0·-
...
;::::s ,..0·-
...
1-< r:n·-"O
u
·-
o..
0 1-<...
0r:n
·-
::::
�
Fig. 9. The numerical used method to determine the initial distribution of fibre orientation.
objective was therefore to determine the orientation distribution of the fibres at the end of the compaction process. The same technic, which is used in
(30),
is applied in the actual work.The compression of this RVE was carried out until a height of
1
mmwas obtained, which corresponds to the size of a normal RVE. At this level, the fibre volume fraction increased from
1.7%
to8.5%
and thenumber of contacts increases from
5823
contacts to25,141
contacts. At8.5%,
the average number of contacts per fibre is equal to10.
Thisvalue is former to that one found by Abd El Rahman and Tucker m
(31)
in the case of friction coefficient µ =0.3
and which is equal to 9 contacts per fibre.
The nonlinear FE solver in ABAQUS/Explicit was used for this FE simulation. A series of 3D Timoshenko beam elements with a circular section
(B31
(30
))
was used to build each fibre. The number and the length of the elements were variable for each fibre and were random. The diameter of each element section was 7 µm, which corresponds to the diameter of a real carbon fibre. Six hundred fibres were generated in the RVE to obtain a1.7%
fibre volume fraction. This generated geo metry was surrounded by six rigid faces that prevented the exit of the fibres during compression. The upper rigid face moved downward to apply the compression of fibres while the others rigid faces remained fixed. The ABAQUS/Explicit(30)
managed the contact between thefibres and the interaction between the fibres and rigid faces. The Cou lomb friction coefficient was set to capture contacts through the general contact algorithm of Abaqus/Explicit. lt was equal to
0.05
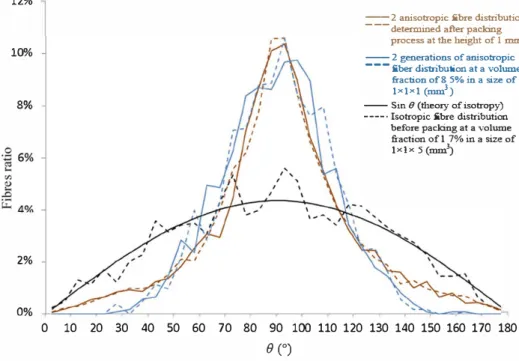
(32).At the end of the compression, a new distribution of fibre orienta tions was obtained. As explained before, this distribution was not iso tropic any longer, as illustrated by the brown curves in Fig.
10.
Since the objective of the study was to simulate the shear behaviour of the material with bonded junctions (epoxy cross links), it was im portant to model the orientation distribution obtained after the simu lation of this first phase of the experimental process in order to directly generate, through the Fortran in house pre processing, the set of fibres with this orientation distribution in the RVE (cube of side length
1
mm).Gauss's function was used to model the shape obtained for the or ientation distribution of the polar angle. Thus, Gauss's function (32)
was defined as the following:
(e-l!.)
sine - 2
g(0) = -- X
e
2xu2 X C2 (1)
1C
where C is a constant such that
f
g(0)sin0d0 = 1 andais
the standard0 • ul
deviation that was fitted to the results of several compression s1m a tions. A value of a = 0.4 was chosen because it provided a good fit to the distribution found after the packing process (see blue curves in Fig.
10
).
If the study of the shear behaviour was not started from the end of the simulation of compression, it is because there were not stresses in the fibres after the polymerization of the entangled cross linked sample
and before the experimental test, which is not the case after the nu merical simulation of compression. Thus, an RVE with the size of
1
x1
x1
mm3 was generated in which the geometry of the fibrescorresponded to Eq. (1) and to the one found after the simulation of compression. The RVE created in a
1
x1
x1
mm3 cube using the inhouse FORTRAN pre processing is used in the subsequent simulations of the shear behaviour of the entangled cross linked fibrous material. This set of fibres was generated without stresses in the fibre assembly, as detailed below. The epoxy cross links were also introduced in the simulation.
3.3. Identificati.on of epoxy joint stiffness
The numerical initial distribution of the fibre orientations corre sponds to the geometry of entangled fibres after the moulding step. From this distribution, springs were added to mode! the polymerised epoxy junctions that blocked some of the contact between the fibres.
A numerical model of two fibres bonded by epoxy cross linking was developed to determine the stiffness that will be included in the springs of the principle mode! of the entangled cross linked material
(Fig. 1 l(b)). The length of fibre is equal to twice the experimental value of average distance between epoxy junctions
(2
x120
µm). The twofibres are bonded in the middle in order to obtain a distance between the junction and the point of load equal to the measured average dis tance between epoxy junctions. This model relies on the approach in itiated by Mezeix (6). However, in the actual work, a more advanced identification was carried out. The stiffness related to the tension and torsion phenomena of the epoxy junction was identified. The finite element solver in ABAQUS/Standard was used to determine the beha viour of an ideal epoxy joint. The construction of this model was based on the SEM observations. The junctions had various configurations, and the angle between the fibres varied more so than for the extension of the epoxy resin. The geometrical configuration of the resin epoxy can make designing this part fairly complicated in ABAQUS. CATIA VS, which is more appropriate for the design of a complex geometry, was used to construct the part of the resin joint. A good resemblance was obtained between the real form of an epoxy joint (Fig. ll(a)) and the numerical one. A fine mesh of 3D solid elements was used to mode! the epoxy junction and the two carbon fibres because the angle between two bonded fibres was very dispersed, as shown in Fig. l(a). In order to simplify the problem, it was assumed in this model that the two bonded fibres were orthogonal. The purpose was to obtain two spring stiff nesses, namely one tension stiffness and one torsion stiffness. In reality, others spring stiffnesses exist, in particular one torsion stiffness and two bending stiffnesses. An isotropie stiffness matrix was obtained with this adopted simplification.
3.3.1. Tension spring stiffness
P. Chatti et aL
12%
--2 anisotropie fibre distributions Fig. 10. Different fibre orientation distributions. The solid black cmve (sinus) represents the theoretical distribution for an isotropie or ientation of the fibres and the dashed black cmve is an example of an orientation distribu tion for f = 1.7% (before compression). The brown cuives are the illustration of two or lèntàtiôn distributions obtàlnèd àftèt numèriœl compacti on up to f = 8.5%. The CUIVes in blue show the set of fibres obtained using Eq. (1 ). (For interpretation of the references to colour in this figure legend, the reader is referred to the web version of this article.)
---detennined after packing process at the height of 1 mm
10%
-- 2 generations of anisotropie---liber distribution at a volume
fraction of 8 5% in a siz.e of
1x1x1 (mm3)
8% -- Sin 8 (theory of isotropy)
----· Isotropie fibre distribution
2%
0%
before paeking at a volume fraction of 1 7% in a si:ze of 1x1x 5 (mm3)
0 10 20 30 40 50 60 70 80 90 100 110 120 130 140 150 160 170 180
B(
°)
nodes of the fibre, ô, was composed of that from one of fibres, ô
1,
and from one of epoxy junction, ô1 (Fig. 12), as illustrated in the following equation:Ô=2X�+�
�)
The relation between F and o1 is shown by the following equation:
F = K1e11sion X Ôj (3)
Variable
F
was defined as follows:Ôf
F
U2
U2
'.Î'ôi
.... ···_....
..
···•
"'"
Defonnect..
.. -•
·
··
··
····
··
···
,
'.
F
Fibres
(4)The tension spring stiffness , K.ension, was identified by an analytical model based on classical beam theory (5):
fibres
<>i.'
i Spring
, , , -
-,:'
<>r imposed
F
1
Kren.sion =
-
1----,L3.- Fig. 12. Mode! of perfect epoxy junction between two perpendicular fibres used to determine the tension spring stiffness.Km1 24EI
(5)
where Kmi is the tension stiffness of whole model that was determined through the numerical simulation, I is the moment of inertia of carbon fibre, E is the Young's modulus of carbon fibre and L is the length of fibre.
3.3.2. Torsion spring stiffness
Under a torsion load,
F,
the global angular displaœment for the extreme nodes of fibre, !!,.8, was composed of that from one of fibres, M., and from one of epoxy junctions, !::,/3 (Fig. 13), as illustrated in theP. Chatti etaL
U2
'-0
Spring
Fig. 13. Mode! of perfect epoxy junction between two perpendicular fibres used to determine the torsion spring stiffness.
following equation:
M=2Xt.a+t:.f3 (6)
The relation between the global moment M and t.e is presented by the
following equation:
M = Krorsion X t:.f3 (7)
Variable M is defined as following:
(8) The torsion spring stiffness, K,orsïon, was identified by an analytical model based on the classical beam theory (9):
1
Krasio11 = -..-1-...,.L-----2xKm2 6E1 (9)
where Km2 is the torsion stiffness of whole model that is determined through the numerical simulation.
The values of tension and torsion stiffness found by this approach are presented in Table 2.
3.4. Explicit simulation
As
for the simulation of the initial compression, ABAQUS/Explicit was used to perform the cyclic shear tests simulations because it is an efficient tool for the problem of large deformation with several me chanical contacts (30). The numerical analysis was decomposed into 20 domains. Domain level parallelization was utilized with 20 processors. Each performed simulation utilized 3 GB of memory per processor and it lasted about 86 h.As
explained previously, the RVE size wasTable 2
The values of tension and torsion spring stiffness identified on the idealized geometry and applied for all the junction configura tions.
Tension stlffness, K..,,,,00
Torsion stlffness, K,,,..,00
0.4N/mm 3·10 4Nmm
1 x 1 x 1 mm3 and a few thousand carbon fibres were generated inside the cubic box in order to obtain a targeted initial volume fraction of 8.5%. The fibre lengths were not fixed. In the simulation, the fibres pass through the cube and thus have lengths that vary with their initial di rection. The mean length of the fibre is equal to 0.8 mm.
The RVE box was bounded by six rigid faces that didn't allow the exit of fibres during the loading and were used to impose the
dis
placement. Fig. 14(a) presents just four of the six faces (coloured in green) in order to show the geometry of fibre network generated inside the box. Only the back and the opposite face were fixed. The other rigid faces were rotated in order to apply a shear load to the fibre as sembly, as ill ustrated in Fig. 14(b ).
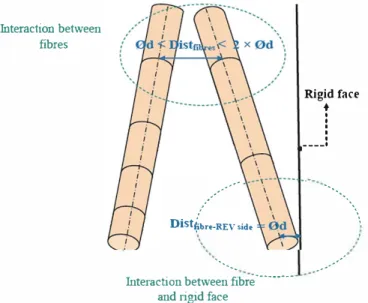
ABAQUS/EXplicit (30) was utilized to manage two types of inter actions. The first one was the interaction between the fibres and the other one was the interaction between the fibres and rigid faces (Fig. 15). If the distance between the axis of the two fibres was between one and two times the diameter of the fibres, a set of fibre surfaces was generated. This method allows the resolution of insufficient memory available in ABAQUS when a general contact algorithm is used to manage the contact in the RVE. More than two thousand contacts were initially activated in the box. A "hard contact" is a type of contact that was chosen in order to apply a no penetration condition. lt was applied between the fibres of each set and between the fibres and the rigid faces next to its extremities. The friction coefficient introduced in the model was kept at the same value used previously for the compression:
µ = 0.05. The same value was used between the fibres and the rigid
faces.
The use of beam elements to treat the cross linkers can very pre cisely consider stretching, torsion, bending and transverse shear (34). However, its use was not possible in our case because weird fibre de formation complicating the computational convergence is obtained when we tried to reposition the fibres allowing the avoidance of over closures and the insertion of beam elements.
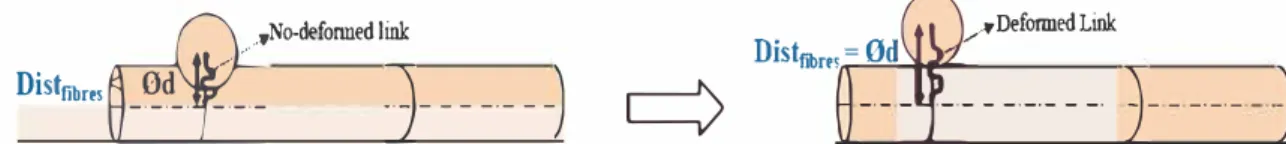
The modelling of epoxy joints was carried out through links, as shown in Fig. 16. Theses links are springs allowing the avoidance of overclosures and the modelling of epoxy junctions. The behaviour of this links was defined in user subroutine
VUEL
The purpose of the links introduced into the 3D model is to transmit
-t -t ----t ----t
forces (P', F') and moments (M', M1) between the beam with the
node, i, and beam containing the node, j, and to calculate the fibre displacement and rotation according to the following equations:
--t ---t P'
= -Krension
X t.u --t ---t Pl=
-Kie11sio11 X (-t.u) ---t ----+ -t 7' M'=
-Kiomon X t.0 + P' /\ Cl ---t ----+ -t 7' Ml= -Krorsio11 X (-t.0) + P1 /\ <;J (10) (11) (12) (13)[
U;-Uj 1where ÏliI =
::=!i
and is the difference of the displacements be[a;-aj 1
tween nodes i and j, Ïlll = /3;-0 is the difference of the angular
Y;-)'.;
displacement between the nodes, c is the middle of
ij
and the cross-t ➔ --t ➔
products P' /\ ci and p1 /\ cj are related to the displacement of the junction load.
Fig. 17 shows the loading steps imposed in the simulation. First, three steps for the set up position are carried out. During the first one, the springs react to avoid the interpenetration of fibres, as illustrated in
Fig. 18. If the distance between the central axis of the fibres is smaller than one diameter, the springs stretch in order to reach a distance equal to one diameter and new contacts between fibres are established. These
P. Chatti et aL Rigid face ----►Deformed Box 1mm __ .. Fibres network ________ ,► No-deformed box
(a)
(b)
Fig. 14. (a) Rigid surfaces in green that surrounded the geometry and prevented the fibres from leaving the box during the simulation. The z axis was vertical. The upper surface moved downward to compress the fibres and (b) caused the shear Joad for the RVE through rigid faces. (For interpretation of the references to colour in this figure legend, the reader is referred to the web version of this article.)
Interaction between fibres
/---Distf.bre-REV side
'
....
......
Interaction between fibrè ________ _ and rigid face
Rigid face ♦
' ''
'.
----·
·---.\
...
....
Fig. 15. Test of distances between beam elements in the RVE and between beam elements and the lateral rigid faces side in order to generate the surfaces of contact in ABAQUS/explicit. Section of K tension-
-1F
'
,
M'
Section of intersection of 1 st fibreFig. 16. Parameters used to develop the behaviour of springs introduced in the whole mode! via Fortran subroutine.
new contacts still existing in the two other steps of set up position which are applied to relax the Joad. After that, three cycles of loading/ unloading are carried out. Between the set up position steps and after each loading or unloading step, the motions of ail nodes are stopped in order to avoid the divergence of kinetic energy.
Even if ABAQUS/EXplicit is considered as a good tool in dynamic analysis, it can be relevant in quasi static studies if the loading time step
is carefully chosen. The time step is an important key to obtain the best balance between the quasi static response and the lowest computa tional time. In the load/unload step, the time increment used was equal to 10-9 s in order to have a strain rate that was much Jess titan the wave speed. ABAQUS/EXplicit allows the artificial increase of material den sity during the simulations in order to control this time increment. The simulation requires 5,000,000 time increments for a load/unload step with 1 % of shear, and thus the total physical time was equal to 0.005 s.
4. Results and discussion 4.1. Shear hysteresis
The first simulation was made with carbon fibres whose diameter was 7 µm, which means that ail of the yarns were well separated. This dimension corresponded to the real diameter of used carbon fibre .
Fig. 19 shows the results of one of the two numerical simulations that were carried out. The comparison in terms of shear stiffness shows a good agreement with the experimental data. The numerical result presents a shear stiffness very close to that one of experimental test. At y = 0, the slope of the stress strain curve equalled about 6 MPa for the two calculations.
Thus, the linear part of the mechanical behaviour was in good agreement with the experimental data. On the other hand, the hyster esis seemed far too pronounced based on practical experienœ and in dicated that the energy dissipation due to the nonlinear part (dry fric tion per (22)) was overestimated. As the average distance between epoxy junctions was representative of the SEM observations, titis can be explained by the use of the 7 µm diameter fibre in the numerical si mulation, which means that fibres were perfectly separated during the manufacturing process. Sorne of yarns were not perfectly separated and still existed in the sample as an entangled cross linked material, as il lustrated in Fig. l(b). The modelling of such yarns is not always straightforward Thus, an assumption was adopted that aims to take into account the heterogeneity of fibre separation. lt was assumed that a fibre assembly with small yarns corresponds to a geometry made with fibres with a larger diameter. In order to have the same section, an equivalent fibre with a diameter that equalled 7
.Jï
µm was used in the second round of simulations.In most previous studies (35 37], the analytical models are based on the bending of fibres which is the principle deformation mode of fibre during the loading. So, the bending stiffness is principally taken into account in the homogenisation technic. lt equalled the value for a small yarn composed of two fibres, so the young's modulus of an equivalent homogeneous fibre was half of the value used in the first round of FE simulations (Fig. 20). The choice of the number of fibres
P. Chatti et aL 0,01 0,0075 0,005 E E 0,0025 ..__, ;,- 0
'
i !! ! i i i ! !! ! j i i ! !! ! ! ·@ 0,005 0,61 ! 0,015 0,02 0,04 0,045 5 -0,0025o..
{/) 0 -0,005en
o..
...
fr
en
! ! !! !fr
i
...en
i i�
!
::i ! ! !! ! ! :::l...
-0,0075 if) 0o..
::i]
l
1
st
cycle
--0,01"E
(')!
!Time(s)
Fig. 17. Loading steps for the fini te element modelling of the RVE shear test composing the small yarn is carried out arbitrarily due to the absence of
experimental data of the quantity of yams existing in an entangled cross linked sample. After <lifferent case of homogenisation, the choice to compare the homogeneous fibre as a small yarn composed of two fibres is carried out because it can guarantee the best hysteresis loop with the reasonable distance between junctions compared to the ex perimental value. The increase of <liameter decreases the number of contacts and so the energy dissipation but it causes the increase of the distance between junctions and so the decrease of the numerical stiff ness. If the ben<ling stiffness is controlled, the homogenisation of other deformation modes is not taken into account.
The numerical results that take this assumption into account are presented in Fig. 22 and will be more discussed later.
A new numerical simulation was carried out with the new fibre <liameter of 7.fï µm in order to adjust the hysteresis loop. A total of 1230 fibres were generated in the
RVE.
TheFE
simulations were carried out using about 21,300 beam elements of <lifferent lengths. The same loa<ling as the one illustrated in Fig. 17 was applied. In the 1st set up step, the shear hysteresis increases due to the springs trying to avoid the interpenetration of fibres, as was explained in Section 3.4. The two next set up steps aimed at relaxing the stresses are characterized by a de crease in the level of shear stress. Depen<ling on the morphology of the initial set of fibres in theRVE
and the effect of the springs that prevent fibre interpenetration, the initial shear stress can be negative or posi tive. In the simulation illustrated in Fig. 21, the shear stress converges to a slightly negative value. During the shear cycling, the shear stress varies around it. Plots of three <lifferent shear cycles are given inFig. 20. The stability of the shear stress can be observed. For the rest of
the article, only the third cycle will be plotted.
The shear stress strain hysteresis loop gives valuable information for
the interpretation of the dissipative and nonlinear behaviour of the entangled cross linked material. Fig. 22 shows a comparison between the numerical curve and experimental data in terms of the shear stress strain hysteresis loop with an imposed <lisplacement of y0 =
1.10-
2•Compared to Fig. 19, the size of the hysteresis loop has notably de creased and is comparable to the experimental one for both simulations that were carried out. The reproducibility is good. However, the linear part of the mechanical behaviour is not as good as in Fig. 19. An ap preciated agreement can be detected between the two curves with re spect to two parts: the first is the linear part, which can be due to the influence of epoxy cross links fibre network (38), and the second is the hysteresis that carries the dissipation of energy. Numerically, as the volume fraction was kept constant, the contact distance increases ( + 42%) because the number offibres decreases. Thus, the linear part of the mechanical behaviour that corresponds to the network stiffness decreases. The numerical model can provide a shear modulus, which was defined as the following:
G- ôr 1
- ôy r=O (14)
The numerical shear modulus was equal to 4 MPa while the ex perimental value was 6 MPa. This <lifference can easily be explained by the <liameter of the equivalent fibre (7.fï µm) that increased the average distance between the contacts and also the average distance between the junctions. In the simulations, the average distance between the junctions equalled 160 µm, which is larger than the previous one for fibres of 7 µm (114 µm) and larger than the experimental value of 120�140 µm reported by Mezeix. Thus, there are Jess epoxy junctions in
the
RVE
and junctions were mainly responsible for the rigi<lity of theDi
s,..m
�
N
,
,.._,l�- _ --·---)
Distfibm = 0d / ,�A�-�
q
H---=--- )---)
P. Chatti et aL l"""I ro p.,
6
� V> V> Q) Q).c
1/)-
Exp.
[22]
-Num.
-0.01 -0.008 0.1 0.08 0.06 0.04 -0.06 -0.08 -0.1 0.006 0.008a
0.01Shear strain y
Fig. 19. Comparison between the experimental hysteresis [22] and numerical hysteres is loops (third cycle) for f = 8.5% and using a fibre diameter equal to 7 µm.
··-y;�n composed of 2
carbon fibres. For each
fibre: E= 240 GPa, D=7µm
2EI = Ebh
�'--..:'
..... ....
� .. --...Equivalent
,.,,""homogeneous fibre:
Eh=
E/2, Db=·../2 x D
Fig. 20. Technic used to take into account the no-separated fibres; A big fibre with a diameter Dh = 7./ï. µm is equivalent to two no-separated fibres of 7 µm of diameter in term of bending stiffness.
entangled carbon fibres
[14)
. The comparison between the two nu
merical curves presented in
Fig. 22
can prove the reproducibility of
numerical results with two <lifferent generations of fibres.
In order to focus on the efficient part of the curves from the damping
point of view, as proposed by Piollet
[22)
, the linear part was sub
tracted and the graphs focused on the shear stress, -r', defined by the
following equation and plotted versus
yin the final figures in this
paper:
r' = r-G x y
(15)
As shown in Fig. 23, the comparison between the numerical curve
and the experimental one shows a good correlation. A similar shape of
hysteresis loops was obtained. From
y=-0.005 to
y=0.005, the
variation of the shear stress is very low and corresponds to stick slip dry
friction behaviour. For a larger strain (-0.005 <y< -0.01 and
0.005 <
y< 0.01), the slope of hysteresis curve increases significantly
and this behaviour corresponds to a stiffening of the entangled cross
linked material. During the experimental tests, it was postulated that
this stiffening came from the increase in the number of activated
5E+4 4E+4 3E+4 2E+4 � 1E+4 � � OE+O � -1E+4
j
-2E+4 {/) -3E+4 -4E+4 -5E+4 o. � V) o. :::lv
{/) � o. � </) o. ;:lv
{/) "80,05
o. � V) o.:::lv
1
stcycle
2
ndcycle
3
rdcycle
{/) M
Time(s)
Fig. 21. Evolution of shear stress during the FE simulation for f = 8.5%.
contacts. Numerical simulations allowed verification ofthis hypothesis,
such that this stiffening was due to the creation of new contacts when
the fibres were moving and the contacts were slipping. The increase in
the contacts led in turn to an increase in the energy dissipation of the
material, which was characterised with a small overshoot in the hys
teresis loop.
Table 3
details the key parameters during the simulation.
The parameters include the number of contacts, the value of contact
forces and the tangential slopes of the stress strain curves at two spe
cific points (measured during the unloading for y
=0.01 and 0).
In contrast with the stiffening part, the overshoots were accom
panied
bya decrease in the number of contacts and of the force contact.
Other RVEs exposed to cyclic shear were also simulated and ana
lysed.
Fig. 24
shows that the numerical curves confirmed the re
producibility of the hysteresis loop. The stress vs. strain curves have a
similar shape to the experimental one with the phases mentioned above
(F
ig
.
24
). The small dispersion between the three numerical simulations
can be explained by the dispersion between the three initial fibre
P. Chatti et aL
Exp. [22]
Num.
0.08 0.06 0.04 -0.04 -0.06 -0.08 0.002 0.004 0.006 0.008 0.01Shear strain y
Fig. 22. Comparison between experimental hysteresis loop and numerical one using a fibre diameter equal to 7 ./2 µm and f = 8.5%. The dashed black line cor responds to the value of the linear part identified in [20] and Eq. (14) where G = 6 MPa. The blue and the purple curves are the third cycles of two simulations with two different set of fibres. (For interpretation of the references to colour in this figure legend, the reader is referred to the web version of this article.)
networks generated. However, simulations with the following para meters, namely an equivalent fibre diameter = 7✓2 µm, friction coef ficient µ = 0.05 and two junctions out ofthree glued by epoxy enabled catching the damping phenomenon in the entanglement, even if the linear part was underestimated (G = 4 MPa instead of 6 MPa)
Fig. 25 shows the plot of r' versus y at a smaller strain amplitude of
y = 0.004. A good agreement can be detected between the numerical
and experimental curves. As can be seen, the numerical model confums than even for small shear strain, the material nonlinearity was de monstrated and that no significant stiffening was observed for this level of solicitation. Like the experimental curves, the numerical ones exhibit a mitigation of the slope, r' (y), with the amplitude. Piollet (22) in terpreted this behaviour and assumed that when the direction of the
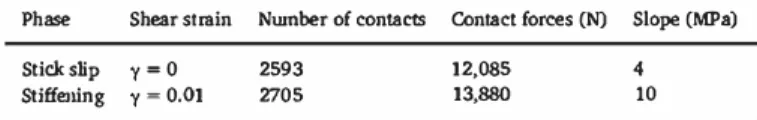
Table 3
The evolution of morphological parameters that explain the phase of stiffening. Phase Shear stmin Number of contacts Contact forces (N) Slope (MPa)
Stick slip y = 0 2593 12,085 4
Stlffening y = 0.01 2705 13,880 10
strain was reversed, all free contacts between the fibres were stuck and so an extra stiffness in the fibre network was obtained. Tuen, as the strain amplitude increases, the contacts started to slip one by one, until ail no bonded contacts were slipping. As a result, a very low network stiffness was obtained.
0·006
2593
stiffening
:
2705
overshoot
"t--"'
7 "' -0.012 -0.01"'
Q) ..cl C/)contacts
st· k 1.
:
0.004 :IC S lp
!
:/
7 0.012-Num.
-- Exp.
Shear strain 'Y
The simulation carried out in the present work confirmed these hypotheses.
In order to confirm that the dissipated energy in the entangled cross linked material was due to the friction betweenfibres, a numerical si mulation was carried out in which the friction was very low and equal to 0.01. In this case, the amount of hysteresis was negligible and almost no energy was dissipated during the shear cycling, as illustrated in
Fig. 26. The evaluation of the area inside the hysteresis loop (Fig. 25) indicates that the dissipated energy per unit volume was equal to about 75 mJ for the real sample of entangled cross linked material. This value is close to that one found for the numerical curve (≈83 mJ). 5. Conclusion
The aim of the current work was to study the shear behaviour of entangled cross linked carbonfibres. A numerical model, developed in ABAQUS/Explicit, was proposed to predict the shear hysteresis
behaviour of this material. This FE model used 3D beam elements to simulate all modes offibre deformation. The friction between the fibres, which was assumed to be responsible for the energy dissipation, was taken into account. The parameters of the initial generated morphology were studied carefully to guarantee that the RVE was representative of the real material in terms offibre orientation distribution. An original numerical technique was used to determine and generate the initial fibre distribution that was close to that of the entangled cross linked sample that was studied. A special approach was adopted to take into account the imperfect separatedfibres existing in the real sample. An assumption consisting to increase thefibre diameter is made to decrease the energy dissipation corresponding to the no separatedfibres in the real sample of entangled cross linked material. This assumption modi fies some morphological parameters like distance between junctions and the number of contacts but it gives a good agreement with ex perimental test in term of shear hysteresis. If this approach doesn’t consider the homogenisation of stretching and torsion, it takes into
Shear strain
Sh
ear stress
'[
M
Pa
]
Exp.
Num.
Fig. 24. Test of the reproducibility of FE calculations for three different sets of fibres. See Eq.(15)for the definition of τ’.
Shear strain
Sh
ear stress
'[
M
Pa
]
Exp.
=1 %
Exp.
= 0.4 %
Num.
= 1 %
Num.
= 0.4 %
Fig. 25. Influence of amplitude in the shape of hysteresis loop. See Eq.(15)for the definition of τ′. F. Chatti et al.account the homogenization of bending stiffness which is the most important deformation mode in a loadedfibrous material.
The model employed an in house Fortran subroutine and a special spring that was developed to account for the epoxy junction between fibres.
The results of the numerical simulations at different amplitude provided a correct hysteresis loop curve compared to those found ex perimentally. Even if there was a difference in terms of the shear modulus, G, being underestimated in the configurations tested, the proposed modelling can be a good key to designing the best archi tecture for an entangled cross linked material that can be used in vi bration damping.
The proposed model of hysteresis can simulate a variety of phe nomena in the shear cycling of entangled cross linked materials, such as friction, stiffening and softening. These numerical predictions allow a better understanding of the evolution of micromechanical parameters, such as the number of contacts during shear cycling. It also enables the independent study of the effect of different morphological parameters, such as the diameter of thefibre, coefficient of friction, distance be tween contacts, proportion of cross linked contacts and type offibres. In fact, as most of these parameters are interdependent in a real material, the proposed model is a tool to tune the theoretical config uration. However, the computations were achieved on a super calcu lator (CALMIP[39]) and remained time consuming. Nonetheless, they are very useful to confirm hypotheses for ongoing phenomena occur ring during mechanical tests. Currently, the resolution of in situ ima ging using X ray tomography at ESRF (European Synchrotron Radiation Facility) is not sufficient to discriminate a glue contact from a sliding contact for the level of strain and the fibre size used in this study. Numerical tools remain the only way to better understand the under lying mechanisms and to propose an optimal morphology for a given mechanical loading because the fibre volume fraction and the dis tribution of thefibre directions are easily tuneable.
CRediT authorship contribution statement
Fadhel Chatti: Conceptualization, Methodology, Software, Validation, Formal Analysis, Investigation, Resources, Data curation, Writing original draft, Writing review & editing, Visualization. Christophe Bouvet: Conceptualization, Methodology, Software,
Validation, Formal analysis, Investigation, Resources, Data curation, Writing original draft, Writing review & editing, Supervision, Project administration, Funding acquisition. Dominique Poquillon: Conceptualization, Methodology, Validation, Formal analysis, Resources, Data curation, Writing original draft, Writing review & editing, Supervision, Project administration, Funding acquisition. Guilhem Michon: Conceptualization, Methodology, Validation, Formal analysis, Resources, Data curation, Writing original draft, Supervision.
Acknowledgements
Thanks are due to CALMIP under the reference of program P1026 for the support and the computing power. Financial support for this work was obtained thanks to the joint project MAFIVA funded by the Midi Pyrénées region and by ISAE Supaéro.
References
[1] D. Gay, Composite Materials: Design and Applications, third ed., CRC Press, Taylor and Francis Group, 2015.
[2] F.J. Plantema, Sandwich Construction, Pergamon Press, New York, 1966. [3] H.G. Allen, Analysis and Design of Structural Sandwich Panels, Pergamon Press,
Oxford, 1969.
[4] D. Zenkert, An Introduction to Sandwich Construction, Department of Lightweight Structures, Royal Institute of Technology, 1993.
[5] J.R. Vinson, The Behavior of Sandwich Structures of Isotropic and Composite Materials Technomic, Lancaster, Pennsylvania, 1999.
[6] L. Mezeix, C. Bouvet, J. Huez, D. Poquillon, Mechanical behavior of entangledfibers and entangled cross-linkedfibers during compression, J. Mater. Sci. 44 (14) (2009) 3652–3661.
[7] S. Hyun, A. Karlsson, S. Torquato, A.G. Evans, Simulated properties of Kagome and tetragonal truss core panels, Int. J. Solids Struct. 40 (2003) 6989–6998. [8] Y.H. Lee, B.K. Lee, I. Jeon, K.J. Kang, Wire-woven bulk Kagome truss cores, Acta
Mater. 55 (2007) 6084–6094.
[9] C. Cai, H. Zheng, G. Liu, Vibration analysis of a beam with PCLD patch, Appl. Acoust. 65 (2004) 1057–1076.
[10] E. Fotsing, M. Sola, A. Ross, E. Ruiz, Lightweight damping of composite sandwich beams: experimental analysis, J. Compos. Mater. 47 (2013) 1501–1511. [11] Z. Li, Vibration and Acoustical Properties of Sandwich Composite Materials. Thèse
de doctorat, Auburn University, 2006.
[12] D. Poquillon, B. Viguier, E. Andrieu, Experimental data about mechanical behaviour during compression tests for various mattedfibres, J. Mater. Sci. 40 (2005) 5963–5970.
[13] L. Mezeix, C. Bouvet, J. Huez, D. Poquillon, Mechanical behaviour of entangled fibers and entangled cross-linked fibers during compression, J. Mater. Sci. 44 (14) (2009) 3652–3661.
Shear strain
Sh
ear stress
'[
M
P
a]
Exp.
Num.
μ=0.05
μ=0.01
Fig. 26. The influence of the friction coefficient, μ, on energy dissipation. See Eq.(15)for the definition of τ′. F. Chatti et al.
[14] L. Mezeix, D. Poquillon, C. Bouvet, Entangled cross-linkedfibers for an application as core material for sandwich structures part I: experimental investigation, Appl. Compos. Mater. 23 (1) (2015) 71–86.
[15] A. Shahdin, L. Mezeix, C. Bouvet, J. Morlier, Y. Gourinat, Fabrication and me-chanical testing of glassfiber entangled sandwich beams: a comparison with hon-eycomb and foams and wich beams, Compos. Struct. 90 (2009) 404–412. [16] J.I. Dunlop, On the compression characteristics offibre masses, J. Textile Inst. 59
(1989) 275–284.
[17] C.M. van Wyk, Note on the compressibility of wool, Textile Res. J. Inst. 37 (1946) T285–T292.
[18] G.A. Carnaby, N. Pan, Theory of the compression hysteresis offibrous assemblies, Textile Res. 59 (1989) 275–284.
[19] N.B. Beil, W.W. Roberts, Fibrous assemblies: modeling/computer simulation of compressional behavior, Int. J. Cloth. Sci. Technol. 16 (1/2) (2004) 108–118. [20] C. Barbier, R. Dendievel, D. Rodney, Numerical study of 3-D compressions of
en-tangled materials, Comput. Mater. Sci. 45 (3) (2009) 593–596.
[21] C. Barbier, R. Dendievel, D. Rodney, Role of friction in the mechanics of nonbonded fibrous materials, Phys. Rev. E (2009) 016115.
[22] E. Piollet, D. Poquillon, G. Michon, Dynamic hysteresis modelling of entangled cross-linkedfibres in shear, J. Sound Vib. 383 (2016) 248–264.
[23] A. Al Majid, R. Dufour, Formulation of a hysteretic restoring force model. Application to vibration isolation, Nonlin. Dyn. 27 (2002) 69–85.
[24] A. Al Majid, R. Dufour, Harmonic reponse of a structure mounted on an isolator modelled with a hysteretic operator: experiments and predictions, J. Sound Vib. 277 (2004) 391–403.
[25] D.J. Mead, A comparison of some equations for theflexural vibration of damped sandwich beams, J. Sound Vib. 83 (1982) 363–377.
[26] T. Komori, K. Makishima, Number offiber-to-fiber contacts in general fiber as-semblies, Textile Res. J. 47 (13) (1977) 13–17.
[27] N. Pan, A modified analysis of the microstructural characteristics of general fiber assemblies, Textile Res. J. 63 (1993) 6.
[28] S. Toll, Packing mechanics offiber reinforcements, Polym. Eng. Sci. 38 (8) (1998) 1337–1350.
[29] F. Chatti, D. Poquillon, C. Bouvet, G. Michon, Numerical modelling of entangled carbonfibre material under compression, Comput. Mater. Sci. 151 (2018) 14–24. [30] User Documentation, ABAQUS User’s Manual: Version 6.11.
[31] A.I. Abd El-Rahman, C.L. Tucker III, Mechanics of random discontinuous long-fiber thermoplastics. Part II: direct simulation of uniaxial compression, J. Rheol. 57 (2013) 1463.
[32] M. Tourlonias, M.A. Bueno, D. Poquillon, Friction of Carbon Tows and Fine Single Fibers.
[34] Y.H. Ma, H.X. Zhu, B. Su, G.K. Hu, R. Perks, The elasto-plastic behavior of three-dimensional stochasticfibre networks with cross-linkers, J. Mech. Phys. Solids 110 (2018) 155–172.
[35] C.M. van Wyk, Note on the compressibility of wool, Text. Res. J. Inst. 37 (1946) T285–T292.
[36] D.H. Lee, G.A. Camaby, S.K. Tandon, Compressional energy of the randomfiber assembly. Part II: evaluation, Text. Res. J. 62 (1992) 258–265.
[37] A.E. Markaki, T.W. Clyne, Magneto-mechanical actuation of bonded ferromagnetic fibre arrays, Acta Mater. 53 (2005) 877–889.
[38] J.P. Masse, D. Poquillon, Mechanical behavior of entangled materials with or without cross-linkedfibers, Scr. Mater. 68 (2013) 39–43.
[39] https://www.calmip.univ-toulouse.fr/consulted on July 23. F. Chatti et al.


![Fig. 19. Comparison between the experimental hysteresis [22] and numerical hysteres is loops (third cycle) for f = 8.5% and using a fibre diameter equal to 7 µm](https://thumb-eu.123doks.com/thumbv2/123doknet/3005185.84369/11.892.179.713.81.464/comparison-experimental-hysteresis-numerical-hysteres-loops-cycle-diameter.webp)