This is the peer reviewed version of the following article:
Brunelle, Cédric. 2013. "The Growing Economic Specialization of Cities: Disentangling Industrial and Functional Dimensions in the Canadian Urban System, 1971–2006." Growth and Change 44 (3):443-473. doi: 10.1111/grow.12015.
which has been published in final form at
https://dx.doi.org/10.1111/grow.12015
. This article may be used for
non-commercial purposes in accordance with
Wiley Terms and Conditions for
Self-Archiving
."
“The growing economic specialization of cities: disentangling industrial and functional
dimensions in the Canadian urban system, 1971-2006”
Submitted to Growth and Change, December 14th 2011; accepted January 22d 2012.
Cédric BRUNELLE
INRS [Institut national de la recherche scientifique] Centre Urbanisation Culture Société
Montreal, QC, Canada
Abstract
Decreasing spatial transaction and trade costs have given rise to growing economic specialization of cities. While most studies focus on industries–the final good or service produced–as the primary manifestation of urban specialization, a growing body of literature examines functions, i.e. activities and tasks performed within a given industry or firm.
This paper explores how the two dimensions (industries and functions) interact across the urban system, and their relative importance is over time. Is there a general trend towards increasing functional specialization in the Canadian urban system? How much of this phenomenon is attributable to spatial shifts in regional industrial structures, as opposed to spatial divisions within industries? The paper uses a unique spatial dataset drawn from Statistics Canada Census micro-data files between 1971 and 2006. Based on the employed population, the data are spatially organized and cross-tabulated over two dimensions: industries and functions (occupational groups). A decomposition methodology is used to describe and compare the relative weights of industry and regional (functional) effects in accounting for the changing spatial division of functions across Canadian urban areas.
Clear patterns of increasing functional specialization are found within the Canadian urban system. Regional effects are generally greater than industry effects, suggesting that spatial divisions of functions (spatial shifts within industries) are progressing more rapidly than regional shifts in industrial structure. As such, the findings are consistent with the broader literature on the growing spatial fragmentation of firms and parallel spatial separation of the various stages of production and service-delivery.
Keywords: functional specialization; urban economies; occupations; industry; JEL classification: R10
Acknowledgements
This research was made possible by the assistance of Statistics Canada’s Micro-Economic Analysis Division and by financial support from the Social Sciences and Humanities Research Council of Canada (Joseph-Armand Bombardier CGS Doctoral Scholarships). I gratefully acknowledge the advice of Mark Brown from Statistics Canada, the useful comments of André Lemelin from INRS-Urbanization, and the suggestions of Mario Polèse, who has read an earlier version of this paper. The usual disclaimer applies.
Introduction
“The majority of output of our economies is intermediate goods, and social and spatial divisions of labor create all manner of organizational clusters in the economy which do not correspond to final-output sectors.”
Storper, 1997, p.276. “Over the last few decades there has been a shift in the main dimension along which cities specialise, from a specialization by sector to a specialization by function…This transformation of urban structure has so far been unremarked.”
Duranton and Puga, 2005, p.343
Geographers and economists have long recognized specialization as a central feature of urban systems. As an outcome of both centripetal and centrifugal forces, urban specialization emerges and evolves from a complex interplay of economic externalities, favoring the uneven–often hierarchical–geographical distribution of activities across cities (Krugman and Venables 1996; Krugman 1991; Fujita, Krugman, and Mori 1999; Henderson 1997; Duranton and Puga 2000, 2001; Desmet and Fafchamps 2005). While most studies focus on industries–the final good or service produced–as the primary manifestation of regional specialization, a growing body of literature (see below) looks at functions–activities and tasks performed within a given industry or firm. Technological change and declining spatial transaction costs tend to favor the functional fragmentation of the firm, producing new spatial divisions of functions over time. This process is unfolding in parallel with industry specialization.
The main objective of this paper is to analyze the evolution of the two dimensions of urban specialization–sectoral and functional–over a fairly long period of time, to provide empirical evidence of the functional specialization patterns taking place in the Canadian urban system. The paper seeks to compare and disentangle the two dimensions of specialization over the past 35 years (1971-2006). Is there a general trend towards increasing functional specialization in the Canadian urban system? How much of this phenomenon is attributable to spatial shifts in regional industrial structures as opposed to spatial divisions within industries? Using employment data, cross-tabulated across the two dimensions, a decomposition methodology is used to evaluate the relative weights of industry and regional (functional) effects in the changing spatial division of functions across Canadian urban areas.
The growing economic specialization of cities
Abundant literature exists documenting industry location patterns and urban specialization. Patterns generally evolve according to relative city size and location (Duranton and Puga 2000). One of the most basic observed regularities is the specialization of larger cities in high-order services.1 In contrast, smaller centers tend to specialize in manufacturing and other non-services sectors (Henderson 1997). The literature also stresses the relative stability of patterns in the form of city-size distributions, a consequence of several factors such as locational fundamentals, increasing returns and the path-dependent nature of urban growth (Davis and Weinstein 2002; Black and Henderson 1999; Bosker et al. 2008; Sharma 2003; Dobkins and Ioannides 2001). Regional economies are also changing as a result of falling interaction costs and economic integration. For the European Union (EU), Resmini (2007), for example, finds that market integration since the 1990s has resulted in spatial dispersion of manufacturing employment. For the US, Desmet and Fafchamps (2005), while offering evidence of overall employment concentration, find that manufacturing and non-services industries have dispersed to nearby regions, while services industries have clustered in the largest metropolitan areas.
These trends mirror findings for Canada. Polèse and Shearmur (2006) describe a “crowding out” effect, documenting the movement of manufacturing out of large metropolitan areas. However, some manufacturing activities have re-clustered in nearby towns; a phenomenon they dub “deconcentrated centralization.” They also observe what they call “technology-induced centralization” for knowledge-intensive business services, facilitated by new communication technologies.
Insights from the international trade and product-cycle literature
One perspective on specialization over space is the product cycle (Vernon 1966), which stipulates that new products will emerge where local demand for novelty is the highest and where technology is the most advanced. As products become standardized, production shifts towards second tier markets, where production costs are lower. Drawing on cycle theory, Henderson (1997) notes that larger cities have a product-incubating function within systems of cities.2 In contrast, product-cycle theory suggests that smaller centers will
1 Duranton and Puga (2001) present a detailed review of empirical studies on regional specialization, summarized in five
stylized facts.
2 Along the same lines, Duranton and Puga (2001) suggest that large metropolitan areas may act as “nursery cities” in
specialize in the production of standardized goods. When products are fully developed and production processes standardized, mass production will move out of the urban core. Quoting Henderson (1997: 605): “product cycles apply at several spatial levels–decentralization into satellite medium-size cities within metro regions, decentralization of production from metro regions to hinterland.” The constant crowding-out of routine-like activities away from the urban core in turn reinforces the role of metropolitan areas as centers of innovation.
However, the international trade literature suggests that specialization patterns may not be as straightforward. Much of the literature is now concerned with analyzing the increasing complexity of the organization of production. Complexity involves the international unbundling of production, and the spatial clustering of given segments of the production process. Krugman (1995) notes that the international fragmentation of the value chain–“slicing up the value chain” as he calls it–is one of the chief tendencies characterizing modern international trade. While product-cycle theory focuses on the location and relocation of the making of “products,” value chain decomposition describes the production of “a good in a number of stages in a number of locations” (Krugman, 1995, p.334). Yet the dividing line between the two perspectives does not appear to be radically different, especially considering the mechanisms structuring the locational behavior of these emerging productive segments.
Economic integration has resulted in two seemingly opposite directions: (1) a growing fragmentation of activities and (2) a process of spatial functional agglomeration (Dean, Fung, and Wang 2007; Hummels, Ishii, and Yi 2001; Jones 2000; Dicken 2007; Storper 1997). Through processes such as offshoring, outsourcing and merging, firms have increasingly adopted localized multi-unit structures where similar “units” agglomerate in the same places reflected both in “global value chains” (Gereffi, Humphrey, and Sturgeon 2005; Sturgeon and Gereffi 2009; Sturgeon, Van Biesebroeck, and Gereffi 2008) and the spatial unbundling of the firm at the international level. Beugelsdijk et al. (2009) offer evidence of a growing (vertical) specialization of the value chain in US foreign affiliates between 1983 and 2003. Their analysis shows decreasing inter-firm flows over the period as opposed to growing intra-firm trade. Defever (2006) observes increasing functional fragmentation in European countries between 1997 and 2002; local wages and education levels have a positive effect on headquarter function, but a negative effect on the location of production facilities. Defever (2006) also points to the role of sectoral specialization in attracting specific functions; while production facilities tend to be
associated with a strong presence of same sector establishments, service functions are not affected by same sector’s presence.
Functional (and Sectoral) Specializations across the Urban System
Growing evidence suggests that functional fragmentation and specialization are taking place at a regional (urban) level. Functionally distinct segments within value chains increasingly cluster in specific cities and regions, fostering functional regional specializations and potentially decreasing sectoral specializations.
The effects can be quite pronounced. Hendricks (2011) observes that 80% of inter-urban skill gaps are due to within-industry variations, using the ratio of skilled to unskilled labor. He also finds that education gaps between US cities are correlated across industries: “highly skilled cities employ large amounts of skilled labor in all industries” (p.6). An explanation may lie in the increasing spatial division of functions within industries.
Analyzing employment in the manufacturing sector, Duranton and Puga (2005) propose stylized evidence of a decreasing concentration in US cities over the 1977 to 1997 period, overshadowed by an increasing functional urban specialization between 1950 and 1990, defined as the ratio of managers to blue collar workers. Large cities systematically showed growing ratios of managers to blue-collar workers over the period. Smaller and medium size cities conversely had falling ratios. Using the same methodology, Bade and al. (2004) note the increasing functional specialization of German cities between 1976 and 2002. Ratios of R&D to blue-collar workers increased in larger cities, while decreasing in smaller places. For Canada, Brunelle and Polèse (2008) show that functional fragmentation is not limited to the manufacturing sector. The Canadian energy industry exhibits patterns of metropolitan concentration for R&D and management functions, which spatially separate from power generation facilities. The latter are, however, sensitive to distance from large metropolitan centres.
While sectoral (industry) and functional specializations are both occurring, there is reason to believe that the level of functional fragmentation has generally been underestimated (see opening quotes by Duranton and Puga, 2005, and Storper, 1997) in part because multi-unit firms are classified as belonging to a single industry class. Internal shifts can be major. Firms often split entire units, i.e. functions, over space (Brown 2008). When considering relocations, organizations usually act on whole departments, offices, factories or
divisions. Specific functions will tend to cluster in similar locations. Headquarters, R&D laboratories, and specialized services departments may concentrate in large cities while plants and back-office services and production-like activities will move down the urban hierarchy.
Few studies have simultaneously examined both dimensions of urban specialization. Partial evidence is found in the occupational clusters literature (Barbour and Markusen 2007; Koo 2005; Markusen and Schrock 2006; Scott 2009, 2010). Generally, this literature suggests that occupational and industrial regional structures exhibit different patterns. Using aggregated occupational classes (managerial, clerical, manual workers) and knowledge groupings (engineers, scientists, programmers, etc.) for eleven California metropolitan areas, Barbour and Markusen (2007) find that occupational patterns across metro areas diverged markedly from industrial patterns for knowledge groupings, while not varying substantially for other occupational classes. However, none have systematically analyzed the relative evolution of both dimensions over time.
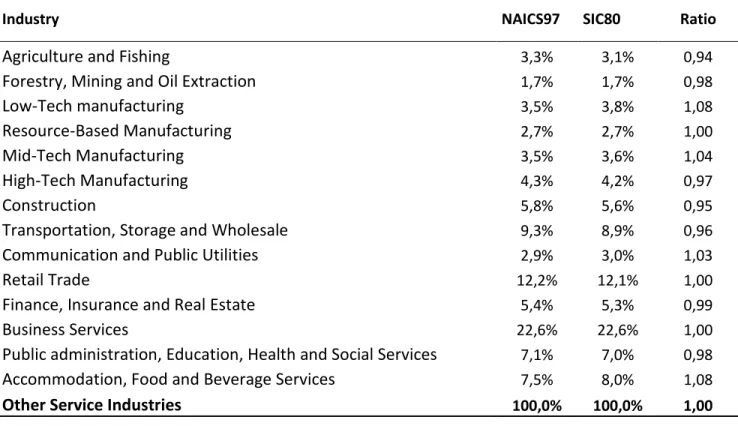
This paper seeks to analyze the parallel evolution of both dimensions of urban economic specialization. How do sectoral and functional dimensions interact across the urban system and what is their relative importance over time? There are powerful arguments supporting both dimensions. The restructuring of modern economies– the rise of the service sector and the concomitant decline of manufacturing–would suggest that industrial structure and industry shifts remain the principal drivers of regional economic specialization (Table 6, Appendix). In this study we examine the whole economy, not just manufacturing. Yet the steady decrease in communication costs–facilitating functional fragmentation–would suggest that functional specialization plays a growing role in defining specialization (Table 7, Appendix).
Data and methodology Data
No perfect metric of functional fragmentation exists in the literature. The classification of activities into “functions” is a fairly challenging exercise. This paper uses employment data. When cross-tabulated by occupational and industry classes, it is possible to isolate both dimensions by defining appropriate groupings of functions and sectors, the approach adopted by (Huws et al. 2009). This paper uses a unique spatial data set drawn from Statistics Canada’s census for the years 1971, 1981, 1986, 1991, 1996, 2001 and 2006. Data for
each year are cross-tabulated over three dimensions: synthetic regions (defined below), industries and occupations. Standardization of each dimension over time rests on census microdata. Aggregation of the data into broad categories–5 synthetic regions, 15 industries, and 9 functions–is helpful in ensuring data comparability over time.
The concept of synthetic region as a classifying typology of cities in this paper refers to a core-periphery model of the Canadian urban system. The use of a typology based on size and distance reflects the well accepted fact that economic activities at the core of the urban hierarchy differ substantially from the ones at peripheral locations. Although many similar typologies exist in the literature, this particular one has proven to be robust in the description of economic activity over time in at least two different national urban systems including Canada (Brunelle and Polèse 2008; Polèse, Rubiera-Morollon, and Shearmur 2007; Polèse and Shearmur 2006; Shearmur and Polèse 2005). Spatial units for all periods are based on the geographic boundaries of the 2006 census. Metropolitan areas are CMAs of more than five hundred thousand people. Central areas are spatial units less than an hour and twenty minutes of driving time (reticular distance) from a metropolitan area, while peripheral areas are further away. Urban areas comprise all CMAs, CAs and CDs of more than ten thousands individuals. We added a density criterion of more than fifty people per square kilometer to distinguish rural from urban areas in the case of CDs with more than 10,000 inhabitants. Table 1 defines synthetic regions. A map showing their location can be found in the Appendix (Figure 3).
Table 1– Definition of synthetic region
The definition of sectors (industries) is straightforward, drawn from the existing industry classifications. Sectors are classified at the one-digit level, except for manufacturing, which is divided into four classes at the two-digit level. The result is the division of the Canadian economy into 15 industries (Table 8). Although such broad aggregates are not optimal for pinpointing specific industrial divisions, the use of cross-tabulations (between occupational and industry classes) leaves little choice if a sufficient number of cases (jobs) per spatial unit is to be ensured, given Statistics Canada sampling and rounding procedures, where values below 50 can
vary by 30% in one direction or another.3 The Standard Industrial Classification of 1980 (SIC-80) serves as the base classification system for all periods. The methodology for merging classification systems over time (SIC-70 from 1971 to 1981; NAICS-1997 for 2006) into the SIC-80 relied on double-coded years at the three-digit level, allowing for passage to one or two-digit levels. The equivalence between classification systems over time is fairly robust (see Appendix Table 8; 9).
Table 2–Sector description and standard industrial classification equivalence
For the construction of functions using occupational classes, the scheme used draws on occupational groupings proposed by Bade et al. (2004). Occupations can be grouped according to skill categories (Koo 2007) or specific tasks (Huws et al. 2009). Both are considered here.
The creation of constant functional groupings is complex. Occupations have changed over the 35-year study period, as have classification systems. This study builds on a methodology developed by Beckstead and Vinodrai (2003) to create consistent occupational aggregates over time.4 The Standard Occupational Classification of 1991 (SOC-91) is used as the base correspondence system for occupations, double coded into the previous SOC-80 coding system. Occupational groups were created by differentiating between knowledge and non-knowledge categories, resulting in the creation of eight knowledge classes and 39 other occupational groups. Concordance with earlier classification systems was performed by aggregating categories at the three- or four-digit level into 47 occupational groups. A Tuckey test was carried out on wage rates by occupation whenever there was a doubt about correspondence.5 The quality of correspondences between the SOC-91 and the SOC-80 can be assessed by examining ratios between double-coded years (see Table 9 in Appendix).
Given the challenge of grouping occupations into coherent functions, I sought to consider as many indicators as possible. Using other variables in the census microdata at the individual level (hourly wages,
3 Cells with values below 50 have a standard error of 15; with values close to 100 a standard error of 20 and close to 200a
standard error of 30.
4 The authors would like to thank Mark Brow and John Baldwin from Statistics Canada’s Micro-Economic Analysis
Division for providing necessary tools and data.
5 See Beckstead and Vinodrai (2003) for the complete methodology and problems related to evolving occupational
gender, major fields of study, education levels), several tests were performed using hierarchical classification methods and factor analysis for 47 occupational classes. In the end, nine functional groupings were retained (Table 1). A detailed description of education levels, demographic and socioeconomic characteristics of the nine functions is provided in Table 10 (Appendix). Health care occupations did not fit into a functional framework easily, and were thus excluded. Another case is liberal professions, which, for reasons related to the initial grouping by knowledge categories, could not be disentangled from high school teachers and related occupations. This results in the Social Sciences and Education function being overrepresented by teachers relative to liberal professions.6 However, because teachers generally relate to a single industry (Education) and tend to be more evenly spread over space than liberal professions–a reflection of the presence of public schools in almost all places–their inclusion does not preclude the existence of distinct spatial patterns for liberal professions7. I thus chose to retain the function in the analysis, keeping its limitations in mind.
Table 1–Functions and corresponding occupational groups
Functional specializations
To measure functional specialization across the Canadian urban system, mean deviations (MD) per function were calculated for each of the five synthetic regions and time periods. The higher the MD, the more a location is specialized in a given function relative to the national average.
The MD for a function in a region is given by:
Deviation Mean j f f p p [001] Where j f
p
= Proportion of employment in function f, for all industries, in region i
6 The larger share of women (61.7%) within the Social Sciences and Education function confirms the overrepresentation
of education occupations within the aggregated group (Table 8 in Appendix).
7 Individual contributions of the Public Administration, Education, Health and Social Service industry to mean deviations
f
p
= Proportion of employment in function f, for all industries, nationallyDecomposition into industrial and regional (functional) effects
Economic specialization is analyzed along two planes: industrial and functional. If a region is overrepresented in industries in which a particular occupational group is dominant, one would expect that function to be overrepresented in that region. Conversely, if a region has more employment in functions resulting from spatial fragmentation within industries, then the industrial structures will not fully capture the level of specialization. To disentangle the two effects, I use a decomposition methodology similar to Brown (2005), 8 which allows the MD to be split into three subcomponents, while keeping each constant9: (1) an industry structure effect, (2) a regional (or functional) effect and (3) a covariance effect10.
Industrial structure effect
For a function in a region, the industrial structure effect denotes the difference between the local and the national mean, assuming the proportion of the function within each of the industries is equal to its share in the corresponding industry for all regions. It measures the sum of the weighted (by local share of each industry) differences between the (national) mean of the function in each industry and the (national) mean for that function across all industries.
The industrial structure effect is given by:
effect structure Industrial)
(
i f fi ijp
p
p
[002] Where ijp
= Proportion of employment in industry i, in region j fi
p
= Proportion of employment in function f, in industry i, nationally f
p
= Proportion of employment in function f, for all industries, nationally
8 The author thanks Mark Brown for his advice and assistance, and André Lemelin.
9 I have also considered (and to some extent tested) the decomposition of a generalized entropy index as a specialization
measure. Entropy measures allow for statistical testing through bootstrap methods. However, the left-hand side of the equation in that methodology was much harder to interpret than simple mean deviations – a consequence of representing three partitions over time (functions, sectors and regions). I therefore opted for the MD decomposition methodology.
10 Decomposition results can be sensitive to the level of industrial aggregation. However, testing of a subsample at the
Regional (or Functional) effect
For a function in a region, the regional effect denotes the difference between the local and the national shares of employment for that function and within each industry if that region had the same industrial structure as other regions. It measures the sum of the weighted (by national means for each industries) differences between the (local) mean of the function in each industry and the (national) mean for that function in each industry.
The regional effect is given by:
effect Regional ) (
i fi fij i p p p [003] Where ip
= Proportion of employment in industry i, nationally fijp
= Proportion of employment in function f, in industry i, in region j fi
p
= Proportion of employment in function f, in industry i, nationally Covariance effectAlgebraically, the decomposition is depleted only when a covariance-like term is added. The covariance effect refers to the interaction between the differences induced by industrial structure and by regional effects.
The covariance effect is given by:
effect Covariance ) )( (
i fi fij i ij p p p p [004]Although the covariance effect can be important in other contexts (Brown 2005), it represents only a marginal value here. I thus chose to split the covariance effect equally between the two others, a solution also adopted by Beckstead and Brown (2005) in a similar case.
Effect Covariance Effect Regional Effect Structure Industrial Deviation Mean ) )( ( ) ( ) (
i fi fij i ij i fi fij i i f fi ij f j f p p p p p p p p p p p p [005]Each effect in the MD decomposition accounts for a portion of the regional deviation in a given function. The hypothesis that industrial and functional structures are interchangeable, or that only sectoral specializations matter, would imply that the first term–the industrial structure effect–accounts for a significantly higher share of the mean deviation. Conversely, the hypothesis that industrial and functional structures are significantly different implies that the regional effect accounts for a larger share of total deviation.
Temporal trends are fairly easy to interpret because of the additive property of the deviations. Changes in mean deviation between two time periods are equal to the sum of the changes in industrial structure effects and the regional effect. For changes over t periods in mean deviations (MD) of function f in region j, this property can be summarized as:
Δ MDt, t-1 = Δ Industrial structure effect t, t-1 + Δ Regional effect t, t-1 + Δ Covariance effect t, t-1 [006]
If changes in the industrial effect over the period explain a larger part of changes in total MD than changes in the regional effect over the same period, then the trend is towards increasing sectoral specialization. Conversely, if changes in the regional effect explain a larger share of changes in MD over the period, the trend is towards functional specialization of cities (by means of functional fragmentation).
Findings
Functional specializations across the urban system
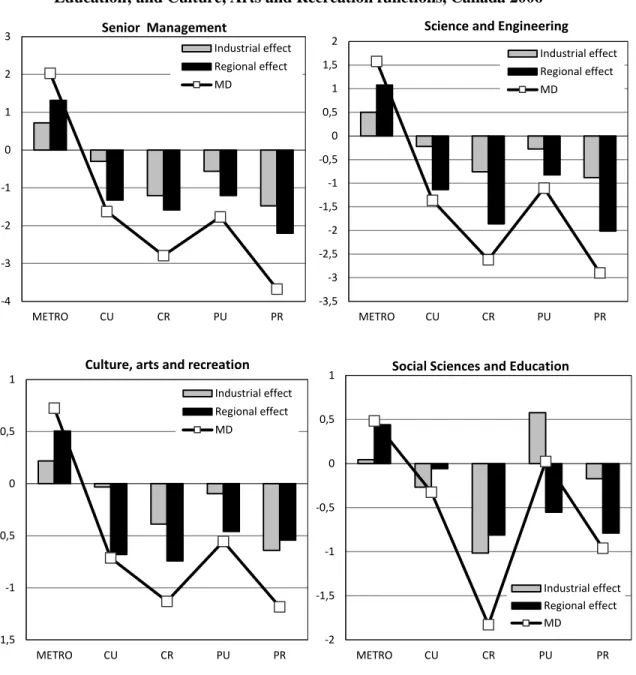
For each of the eight functions, spatial patterns (in 2006) of functional specializations are illustrated on Figure 1 and 2. The former shows results for more knowledge-intensive functions (Management; Science and Engineering; Social Sciences and Education; and Culture, Arts and Recreation), while Figure 2 shows spatial patterns for routine and production type functions (Clerical; Sales and Services; Specialized Production; and Standardized Production).
Each figure gives mean deviations (MD) across synthetic regions, decomposed by industry effects and regional effects. Positive MDs indicate overrepresentation relative to the Canadian mean, while negative MDs exhibit underrepresentations. Values close to zero indicate a pattern similar to the Canadian average for all locations. Following equation [005], industrial and regional effects sum up to the mean deviations. Synthetic regions ordered are from left to right by size and centrality: metropolitan areas (METRO); Central Urban (CU); Central Rural (CR); Peripheral Urban (PU); Peripheral Rural (PR). A downward sloping curve indicates a hierarchical location pattern for the relevant function. Conversely, an upward sloping curve would characterize activities located in peripheral and rural places (i.e. extraction or resource-based).
Figure 1–Spatial Divisions of Functions over the Urban Hierarchy: Mean Deviations, Regional
and Industry Effects in Senior Management; Science and Engineering; Social Sciences and
Education; and Culture, Arts and Recreation functions, Canada 2006
Figure 1 points to a clear pattern of spatial functional specialization, with hierarchical distributions for the four knowledge-rich functions. Senior management and science and engineering occupations have the highest metropolitan concentrations, while showing values below the national average in all other locations. Culture, arts and recreation and social sciences occupations are similarly located in the largest urban centers. These results are, on the whole, consistent with other findings in the literature.
However, in exploring the specific contributions of both industrial and regional effects, the results also show that the latter generally dominates in explaining MDs. This is somewhat surprising, because one would expect typical industrial mixes of metropolitan areas–generally leaning towards high tech, finance and business services industries–to capture the largest part of the local deviations in these knowledge-rich functions. At most, the industrial effect captures only 35% of the MDs in metropolitan areas. The highest regional effects (compared to industry effects)11 are found in Social Sciences and Education occupations,suggesting that such functions, where fragmented, are generally centralized in the largest cities. Similarly, local deviations in Science and
Engineering, Senior Management, and Culture, Arts and Recreation functions show a strong regional effect, with again a strong (relative) presence in metropolitan areas.12
Few exceptions are found in the non-metropolitan areas. For the Social Sciences and Education function, negative MDs in central urban and rural areas are primarily explained by an industrial effect. Given that teachers predominate in this class (as opposed to liberal occupations), one possible explanation would be that the Public Administration and Education sector is less prevalent in those locations, resulting in the teachers’ being underrepresented. However, analyzing the individual contribution of that sector to the overall effect indicates a strong positive weight in all locations. This is clearly anomalous. The only other industry contributing positively to the industrial effect is that of business services, which likely relates to its large contingent of liberal professionals. It appears that the negative industrial effects of all other industries outweigh the positive effects of business services and the education industry in those locations. This is not the case in central urban areas, where the industrial effect remains positive despite the weight of other sectors. This suggests that the Public Administration and Education and Business Services industries are relatively more present in peripheral urban places than elsewhere. Nevertheless, the weight of the industrial mixes is also paralleled by the strong presence of regional effects, most notably in metropolitan, central rural and peripheral urban areas. Although the two aforementioned industries also dominate in explaining the regional effect, all industries contribute to the overall spatial division of the function. In sum, spatial functional fragmentation is taking place in most industries, favoring a spatial hierarchical distribution of knowledge-rich functions.
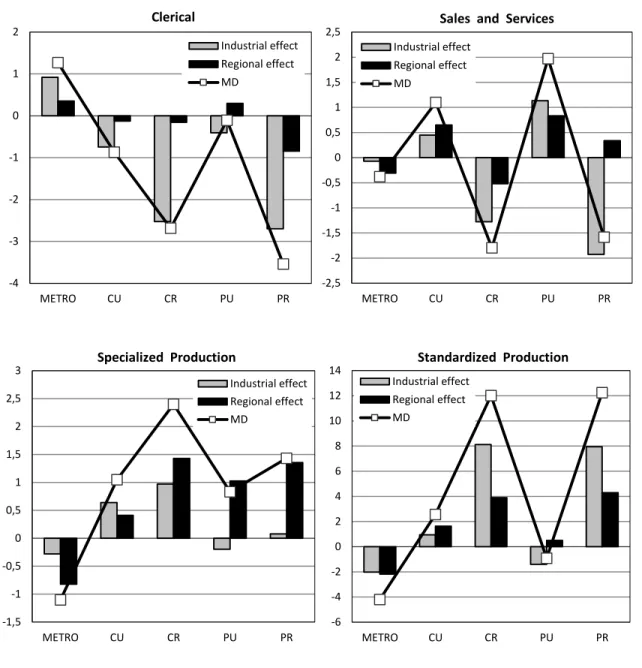
Figure 2–Spatial Divisions of Function over the Urban Hierarchy: Mean Deviations,
Regional and Industry Effects in Clerical; Sales and Services; Specialized Production;
and Standardized Production functions, Canada 2006
Location patterns for routine and production functions are more heterogeneous (Figure 2). Production functions tend to locate in rural areas. In contrast, clerical and sales functions concentrate in urban areas,
12 For Science and Engineering, Senior Management, and Culture, Arts and Recreation, the regional effect explains 68%,
although not necessarily in the largest cities–a pattern somewhat in-between that of the knowledge-rich groups. Industrial and regional effects are also more mitigated. In some cases, industrial structure appears to be the prime driver of specialization, whereas within-industry divisions lead in other cases.
Clerical occupations are the most hierarchical, while also the most similar to the knowledge-rich group, with higher metropolitan shares and other locations below the national average. Yet the pattern is largely limited to the industrial effect. Clerical occupations are mainly found in Finance, Insurance and Real Estate (FIRE), along with the Business Services and Public Administration industries. That is, the clerical function is more present in regions where such sectors cluster, most likely in the largest cities. However, small regional effects are also observed, with positive values in metropolitan and peripheral urban areas, showing that, when fragmented, industries will favor those regions in locating their clerical units. Potential explanations include the relocation of call centers, small regional offices or data processing facilities in lower-cost peripheral cities.
Sales and services are also concentrated in urban areas (both central and peripheral), although not in the largest cities, suggestive of a second-order role in the urban hierarchy. The function ranks below the national average in both rural areas and in the metropolitan regions. Although the pattern may partly reflect the greater share of retail trade industries in the economies of non-metropolitan urban places, the figure also shows that the trend is not limited to the industrial mix explanation–substantial regional effects are also observed. These suggest that smaller urban cities may act as regional outlet centers for many non-retail industries in the form of a center-hinterland relationship with nearby rural areas. Centrality and distance are two definite factors.
Production functions (specialized and standardized) exhibit a very different location pattern from the previous groups. Both are oriented towards rural areas, but are also more present in peripheral places. They are also the least present in the largest cities, production being more generally linked to activities that are space-consuming and resource-oriented. However, outside the largest cities, the two groups show substantially different location patterns. Specialized production, which includes science and engineering technicians, specialized operators, and skilled machinists (Table 3), is present in almost all places outside metropolitan areas, whereas standardized production, generally comprising assemblers, labourers, miners, foresters, farmers, etc. (Table 3), is generally concentrated in rural areas. For the former, the relatively high values found in central rural areas suggests spatially divided industries capturing the effects of employment nodes (i.e. industrial parks)
located in the nominally “rural” fringes of large urban centers. The important contributions of the regional effects to the overall pattern, reaching nearly 60% in the case of central rural areas, tend to confirm this interpretation. Medium-sized cities, both central and peripheral, exhibit similar patterns. In all cases, spatial fragmentation between the types of workers found in industries located in those areas and the ones found in the largest cities is equally shared among the 15 industries, indicative of a broader pattern than a simple sectoral effect.
Regarding standardized production activities, concentrations occur in rural (central and peripheral) areas, but not in medium-sized cities. Industrial effects are quite significant, reaching nearly 68% in rural areas, generally explained by the higher presence of such functions in the resource extraction industry, which is predominantly located in such areas. However, once again, regional effects are important. The type of workers found within industries such as mining, oil drilling or agriculture greatly differs between regions. Obviously, resource-extraction occupations, be they oil drillers, farmers, lumberjacks or miners, are, almost by definition, located near resource extraction sites. The observed patterns thus appear to be the necessary corollary of patterns found for the knowledge-rich functions, whereas management, science or liberal profession functions are clustered in the largest cities.
To summarize, clear patterns of economic specialization are found within the Canadian urban system. Not surprisingly, knowledge-rich functions concentrate in the largest metropolitan areas, whereas routine and production occupations lean towards smaller and rural areas, consistent with findings in the literature. However, in most cases, the trends are explained by strong regional effects that account for a larger share of the overall effect than that explained by industrial structure, suggesting a growing spatial division of functions within the Canadian urban system. The temporal scope of this phenomenon is explored in the following section.
Relative trends over time
Tables 6 and 7 show the mean deviation values for 1971 and 2006, along with their absolute and relative changes (compound annual growth rates) over the period for, respectively, the knowledge-rich and the routine-production functions across the five synthetic regions. They also give changes in industry and regional effects and their respective percentage changes in explanatory power (% of MD change), recalling the additive
properties of the change equation [006]. Trend lines for MDs and for the two effects are also shown. For each effect, the % of MD change represents its contribution to MD change between 1971 and 2006. For ease of analysis, I focus on MD % and, more specifically, on % of MD change relating to the regional effect.
Table 4–Changes in Mean Deviations, Industrial and Regional Effects by Region in
Senior Management; Science and Engineering; Social Sciences and Education; and
Culture, Arts and Recreation functions, Canada 1971-2006
The results are unambiguous. For the knowledge-rich functions, a clear tendency towards increasing metropolitan concentration emerges between 1971 and 2006 (Table 4). The trends are constant over time and indicate a continuous reinforcement of the hierarchical location patterns previously described (Figure 2). Indeed, MDs for the knowledge-rich occupations are systematically growing in the largest cities, while decreasing in all other locations. Senior management provides a good example. Whereas the function has been clustering in metropolitan areas at a 2.0% annual compound rate over the past 35 years, it faced a yearly decline ranging between 1.5% and 3.6% in all other locations. The results also show metropolitan concentration has been occurring at the expense of medium-sized cities, with the most dramatic decline occurring in peripheral urban cities (3.6% yearly). In the other knowledge-rich functions, the pattern is consistent and generalized in almost all cases. Science and engineering functions have been clustering in metropolitan areas by 2.7% per year between 1971 and 2006, while moving out of peripheral urban areas at a 5.0% annual rate. Culture-related occupations show similar trends: 1.6% yearly increase in metropolitan MDs, followed by a 3.5% annual decrease in peripheral urban areas. The only exception is social sciences and education, where the most dramatic decrease is found in peripheral rural areas (8.3% per year). However, strong negative effects are also found in peripheral urban areas (6.3%), which suggests that the results are nonetheless consistent with the broader picture. Overall, knowledge-rich functions are drawn from smaller urban centers to the largest cities, indicative of rising economic specialization across the urban spectrum.
Most striking is that the metropolitan clustering of knowledge-rich functions is in large part the outcome of spatial shifts within industries; true for all locations. The decomposition shows that MD variations are
primarily explained by changes in regional effects between 1971 and 2006–the industrial structure shifts account for much smaller shares of the overall location patterns.
The most radical manifestation is found in the Social Sciences and Education function, where the two effects move in opposite directions: 119% of metropolitan clustering is linked to intra-industrial changes, while industrial mix fluctuations generates a 19% negative effect over the period. Although anomalous, there are reasons to believe this is attributable to liberal professions within the group, given that a large part of the occupational group is composed of teachers. After verifying the weight of individual industry contributions, I found the negative effect to be largely attributable to the education sector (to which most teachers belong). The negative impact of the industrial effect is probably a reflection of the spatial diffusion of the education sector.
Nonetheless, that does not quite explain why liberal professionals would exhibit more acute spatial divisions than other functions. The most likely explanation lies in the rise of new communication technologies, which have made it easier, faster and cheaper to send information from a single location to the rest of the world. Because information can now be transported at virtually no cost, intellectual and immaterial types of activities are spatially “looser” than other activities requiring co-location with physical inputs. Liberal professionals such as consultants, lawyers, accountants, researchers or economists would certainly fall into that category. Yet having fewer spatial constraints does not mean that it is advantageous to be located away from everyone. The IT revolution might have made it easier to communicate information, but it has not replaced the importance of a handshake in doing business (Leamer and Storper 2001; Polèse and Shearmur 2004). In fact, the value of proximity may now be higher than ever for such functions involved in policymaking, legal, consulting or decision-type activities, often making the difference between gaining and losing in a transaction process. Being spatially “footloose” would then favor their relocation in “decision” types of places, most likely in the largest cities, where such attributes can be enhanced with the multidimensional benefits of agglomeration economies. As the IT revolution continues, growing shares of such functions would presumably concentrate in the largest cities, regardless of industry. Small offices and large headquarters alike will tend to locate in the largest city within urban systems.
Senior management provides a similar example. 69% of metropolitan clustering is attributable to changes in the regional effect, while only 31% is linked to structural changes in the industry. Deconcentration
from central and peripheral urban locations mirror these results, with 81% and 61% respectively explained by spatial division within industries. The logic is essentially the same as in the case of liberal professionals. Falling communication costs would paradoxically foster the clustering of senior management, as they become increasingly mobile in space. While the geographic fragmentation between production and management has long been documented within large firms (Chandler 1977; Pred 1975), the present results suggest that the logic may be expanding to smaller enterprises.
On a smaller scale, science and engineering is also clustering as a result of increasing divisions within industries. Shifts in regional effects explain 54% of the overall patterns in metropolitan regions. These smaller effects reflect the known behavior of many high-tech industries, mostly locating in very large agglomerations. Nonetheless, the regional effects are fairly large. Outside metropolitan areas, second-order cities show strong intra-industrial divisions, reaching 75% and 65% in the case of central and peripheral urban areas. Many non-high-tech sectors are also divided, clustering their scientific functions in larger cities, seeking the advantages of agglomeration economies and knowledge spillovers. In addition, the decline in transport costs has extended the spatial reach of many specialists–biologists, geologists, meteorologists, etc.–to a wider hinterland, allowing their concentration in larger cities where technical expertise and specialized equipment are found. The most radical expression of this spatial logic is found in emerging fly-in-fly-out forms of employment in remote areas. Canada has many examples, ranging from emerging mining projects in northern territories to Albertan oil extraction and offshore projects in eastern provinces. Again, the outcome is further spatial divisions of the function across the urban spectrum.
Culture and arts related workers likewise exhibit substantial spatial divisions that explain their concentration in larger cities between 1971 and 2006. Changes in regional effects capture 78% of the MD increase in metropolitan areas; it reaches 91% in central cities. Whereas the cultural economy may have historically been a phenomenon limited to a few industries–artists, painters or designers performing in national museums, specialized galleries and operas–the results partly suggest that arts-related workers may be found in a rising number of industries. In fact, photographers, writers or designers are now required in many sectors including manufacturing, publicity and specialized business services. As the demand for customized products increases, arts-related occupations should keep expanding in many industries. Results show that they are also
sensitive to agglomeration economies, which explains their clustering. The natural outcome is a growing spatial divide between functions and the industries in which they are embedded.
Taken together, these results show that the growing economic specialization of metropolitan areas in knowledge-rich functions is less an outcome of industrial restructuring within regions than the consequence of spatial fragmentation of the production process over time. Although some authors may have outlined a “death of distance” (Cairncross 1997) through the rise of communication technologies, our results suggest an ever increasing effect of IT technologies in developing new opportunities for firms to centralize their knowledge-rich functions. As the economy evolves towards an integrated market, we see a paradoxical situation where knowledge-rich activities–although in principle spatially “looser”–increasingly agglomerate.
Table 5–Changes in Mean Deviations, Industrial and Regional Effects by Region in
Clerical; Sales and Services; Specialized Production; and Standardized Production
functions, Canada 1971-2006
Whereas knowledge-rich functions have clustered, routine and production functions have increasingly spread-out from larger cities to smaller regions within the Canadian urban system (Table 5). The trends are constant over time, favoring a more even distribution of the functions across space. Clerical, sales and services and specialized production all show patterns that suggest a relative convergence process over time, where smaller urban and rural regions, initially less favored, are gaining. Specialized production shows the highest deconcentration trends, with a 4.3% annual compound decrease in metropolitan areas between 1971 and 2006. This process favors central rural areas, which have gained 4.2% annually over the period. While these gains are generally explained by a strong industrial effect in all locations, central urban areas are an exception. In this case, increased concentration is largely explained (at 67%) by a spatial division within industries. This suggests a reinforcement of the pattern previously illustrated (recall Figure 2), where central rural areas are becoming strategic sites for the location of specialized production functions. Firms may find it advantageous to fragment production functions, locating near the largest cities, combining the proximity to knowledge-rich functions (science and engineering) with lower land costs. Nevertheless, this logic is not generalized. In most cases, decentralization reflects the effect of changes in the industrial structure, where production tends to move towards more medium-size cities.
While also moving out of metropolitan areas, clerical functions paint a different picture. What could be called a crowding-out type of process has taken place, favoring the relocation in peripheral urban areas. This localization trend is quite important, growing by 7.2% annually over the past 35 years. More to the point, the changes observed over time are generally driven through a strong process of spatial divisions within industries: regional effects explain 152% of the clustering pattern in peripheral urban areas (74% in metropolitan areas). Given the considerations above (Figure 2), these results corroborate other studies on the geographic decentralization of back-office services (Bristow, Munday, and Gripaios 2000). Establishments such as call or administrative centers, and data processing facilities have been greatly affected by the IT revolution. Increasingly “footloose” through emerging communication technologies, they have faced important rationalizations in their pursuit of low-cost competitive advantages, favoring their diffusion in more remote locations. Carrying more routinized types of tasks and producing more standardized types of information, clerical functions may be less affected by agglomeration economies than knowledge intensive functions. In fact, many call centers have emerged in remote Canadian cities in recent decades. Places where a student workforce is abundant, with a higher share of bilingual (English and French) workers have been favored: Moncton (NB), Sherbrooke (QC) or Fredericton (NB) being three examples. Although the overall distribution is generally explained by stronger industrial effects (Figure 2), spatial functional divisions appear to be the primary drivers of spatial changes in the case of clerical functions.
Turning to sales and services, the results shows that the spreading-out essentially follows an industrial logic. In this case, the function has decentralized in what may seem a converging fashion, provoking growth in places where concentration has initially been limited. Rural areas are particularly affected. This decentralization behavior is directly linked to that of the retail trade industry. Indeed, retail industry and sales functions represent a growing and very large share of the Canadian economy (Tables 6; 7 Appendix). The growth of large outlet centers and superchains, such as Wal-Mart or Ikea–major employers for sales and services occupations–may provide part of the answer, because they have had an important effect on the spatial reorganization of the function over the past decade. Central rural areas are often targeted as strategic sites for the development of shopping malls, lifestyle and power centers where sales and services functions are most likely to be clustered. However, that explanation does not seem to hold for peripheral rural regions. There, rising MDs may reflect a
paradoxical decline in the economy of several remote regions, where retail trade becomes the major employer relative to the overall economy, often highly dependent on government transfer programs (Polèse and Shearmur 2006).
Within the routine-production functions, standardized production provides an exception. The function has been growing in metropolitan (although starting from a low–i.e. negative–MD) and in second-order cities, while declining in rural locations, primarily through industrial effects. In principle among the least knowledge-rich, this function shows an unexpected trend over the period. One explanation may be that because standardized production encompasses many extraction-related workers (fishermen, lumberjacks, farmers, miners, etc.) and manufacturing and trades personnel, a rapid decline in extraction industries would impact employment in rural areas, producing a relative concentration in other places where standardized production is more related to manufacturing. This largely corresponds to the changes that occurred in the Canadian economy over the past 35 years, where sectors such as fishing, logging and farming have seen their employment levels substantially decline. The “increase” in larger cities is thus more of a mathematical artefact than a real economic trend. Standardized production functions remain highly concentrated in rural areas (see Figure 2) due to higher industrial effects.
Conclusion
This study demonstrates rising patterns of functional specialization within the Canadian urban system. Knowledge-rich functions increasingly cluster in the largest metropolitan areas, whereas routine and production activities spread to smaller urban regions. These patterns are generally consistent with the literature on the economic specialization of cities.
However, the results also show that functional specializations are primarily fuelled by spatial shifts within industries (regional effects), less so by regional shifts in industrial structures (industry effects). This observation corroborates Duranton and Puga’s (2005) findings for manufacturing, while it extends their conclusions to the overall economy. I provide evidence that a generalized process of spatial functional fragmentation is taking place across all industries. The effects are quite substantial between 1971 and 2006, suggesting that functional specialization may have been largely underestimated in the literature.
Nonetheless, not all functions have the same potential for spatially separating within industries. Functional fragmentation primarily affects knowledge-rich functions. Senior management, science and engineering, liberal professionals and culture-related workers have all faced growing intrafirm spatial divisions. Conversely, sales and services, and production functions generally follow an industry logic. Clerical functions are in-between, showing greater industry effects overall, although rapidly evolving through spatial functional divisions.
The causality underlying these observations may be complex; the results do not affirm any explanatory factors. They must remain hypothetical. The most robust hypothesis relates to the level to which these groups may become “footloose” as the IT revolution takes place. Functions producing intellectual and immaterial types of outputs would likely be more affected by a drop in communication costs, becoming spatially “looser” than other activities requiring co-location with physical inputs. Yet paradoxically, once “footloose,” the functions may increasingly be exposed to centrifugal and centripetal economic forces, hence favoring their clustering in the urban system. Distinctions between levels of fragmentation for each function thus also seem closely related to their sensitivity to agglomeration economies.
Many questions remain unanswered. One obvious question relates to the factors that explain the regional effect. Future research might evaluate the interplay of specific factors–market accessibility, infrastructures, local amenities or institutions–based on more geographically disaggregated data. However, such research remains constrained by concordance and sampling issues of longitudinal datasets over time. Another question is linked to specific differences between sectors. Future research could assess whether functional specialization differs significantly between manufacturing and services industries. Finally, the relation between functional specialization and other urban characteristics could be assessed, providing insight into regional growth patterns. Future research might consider the role of spatial functional divisions in fostering regional disparities in human capital, socioeconomic characteristics and growth trajectories.
References
Bade, F.J., C.F. Laaser, and R. Soltwedel. 2004. Urban Specialization in the Internet Age — Empirical Findings for Germany. In Kiel Working Papers. Kiel: Kiel Institute for the World Economy.
Barbour, E., and A. Markusen. 2007. Regional occupational and industrial structure: Does one imply the other? International Regional Science Review 30 (1):72-90.
Beckstead, D., and T. Vinodrai. 2003. Dimensions of occupational changes in Canada's knowledge economy, 1971-1996. Ottawa: Statistics Canada - Micro-Economic Analysis Division.
Beckstead, Desmond, and Mark Brown. 2005. Provincial income disparities through an urban-rural lens: evidence from the 2001 census. In Insights on the Canadian Economy. Ottawa: Statistics Canada. Beugelsdijk, Sjoerd, Torben Pedersen, and Bent Petersen. 2009. Is there a trend towards global value chain
specialization? -- An examination of cross border sales of US foreign affiliates. Journal of International Management 15 (2):126-141.
Black, Duncan, and Vernon Henderson. 1999. Spatial evolution of population and industry in the United States. The American Economic Review 89 (2):321.
Bosker, M., S. Brakman, H. Garretsen, and M. Schramm. 2008. A century of shocks: The evolution of the German city size distribution 1925-1999. Regional Science and Urban Economics 38 (4):330-347. Bristow, G., M. Munday, and P. Gripaios. 2000. Call centre growth and location: Corporate strategy and the
spatial division of labour. Environment and Planning A 32 (3):519-538.
Brown, M. 2005. Renewing Canada's manufacturing economy: A regional comparison, 1973-1996. Growth and Change 36 (2):220-243.
Brown, Shannon. 2008. Business processes and business functions; a new way of looking at employment In Monthly Labor Review
Brunelle, C., and M. Polèse. 2008. Functional specialization across space: A case study of the Canadian Electricity Industry, 1971-2001. Canadian Geographer 52 (4):486-504.
Cairncross, Frances. 1997. The death of distance: how the communications revolution is changing our lives. Boston: Harvard Business School Press.
Chandler, Alfred D. 1977. The Visible Hand: The Managerial Revolution in American Business. Cambridge: Harvard University Press.
Davis, D. R., and D. E. Weinstein. 2002. Bones, bombs, and break points: The geography of economic activity. American Economic Review 92 (5):1269-1289.
Dean, Judith, K.C. Fung, and Zhi Wang. 2007. Measuring the Vertical Specialization in Chinese Trade: U.S. International Trade Commission.
Defever, Fabrice. 2006. Functional Fragmentation and the Location of Multinational Firms in the Enlarged Europe. Regional Science and Urban Economics 36 (5):658-677.
Desmet, Klaus, and Marcel Fafchamps. 2005. Changes in the spatial concentration of employment across US counties: a sectoral analysis 1972-2000. Journal of Economic Geography 5 (3):261-284.
Dicken, Peter. 2007. Global shift: mapping the changing contours of the world economy. 6th ed. New York: The Guilford Press.
Dobkins, Harris, and Y. M. Ioannides. 2001. Spatial interactions among U.S. cities: 1900-1990. Regional Science and Urban Economics 31 (6):701-731.
Duranton, G., and D. Puga. 2000. Diversity and specialization in cities: Why, where and when does it matter? Urban Studies 37 (3):533-555.
———. 2001. Nursery cities: Urban diversity, process innovation, and the life cycle of products. American Economic Review 91 (5):1454-1477.
Duranton, Gilles, and Diego Puga. 2005. From Sectoral to Functional Urban Specialization. Journal of Urban Economics 57 (2):343-370.
Fujita, M., P. Krugman, and T. Mori. 1999. On the evolution of hierarchical urban systems. European Economic Review 43 (2):209-251.
Gereffi, Gary, John Humphrey, and Timothy Sturgeon. 2005. The Governance of Global Value Chains. Review of International Political Economy 12 (1):78-104.
Henderson, Vernon. 1997. Medium size cities. Regional Science and Urban Economics 27 (6):583-612. Hendricks, L. 2011. The Skill Composition Of U.S. Cities*. International Economic Review 52 (1):1-32. Hummels, David, Jun Ishii, and Kei-Mu Yi. 2001. The nature and growth of vertical specialization in world
trade. Journal of International Economics 54 (1):75-96.
Huws, Ursula, Simone Dahlmann, Jörg Flecker, Ursula Holtgrewe, Annika Schönauer, Monique Ramioul, and Karen Geurts. 2009. Value chain restructuring in Europe in a global economy. In Work organization and restructuring in the knowledge society, edited by U. Huws. Leuven: Katholieke Universiteit Leuven: Higher Institute of Labour Studies.
Jones, Ronald. 2000. Globalization and the theory of input trade. Cambridge: The MIT Press.
Koo, J. 2007. Determinants of localized technology spillovers: Role of regional and industrial attributes. Regional Studies 41 (7):995-1011.
Koo, Jun. 2005. How to Analyze the Regional Economy With Occupation Data. Economic Development Quarterly 19 (4):356-372.
Krugman, P. 1991. Increasing returns and economic geography. Journal of Political Economy 99 (3):483-499. Krugman, Paul, Richard N. Cooper, and T. N. Srinivasan. 1995. Growing World Trade: Causes and
Consequences. Brookings Papers on Economic Activity 1995 (1):327-377.
Krugman, Paul, and Anthony J. Venables. 1996. Integration, Specialization, and Adjustment. European Economic Review 40 (3-5):959-967.
Leamer, Edward E., and Michael Storper. 2001. The Economic Geography of the Internet Age. Journal of International Business Studies 32 (4):641-665.
Markusen, Ann, and Greg Schrock. 2006. The distinctive city: Divergent patterns in growth, hierarchy and specialization. Urban Studies 43 (8):1301-1323.
Polèse, M., F. Rubiera-Morollon, and R. Shearmur. 2007. Observing regularities in location patterns: An analysis of the spatial distribution of economic activity in Spain. European Urban and Regional Studies 14 (2):157-180.
Polèse, M., and R. Shearmur. 2004. Is distance really dead? Comparing industrial location patterns over time in Canada. International Regional Science Review 27 (4):431-457.
Polèse, Mario, and Richard Shearmur. 2006. Growth and Location of Economic Activity: The Spatial Dynamics of Industries in Canada 1971-2001. Growth and Change 37 (3):362-395.
———. 2006. Why some regions will decline: A Canadian case study with thoughts on local development strategies. Papers in Regional Science 85 (1):23-46.
Pred, Allan R. 1975. Diffusion, Organizational Spatial Structure, and City-System Development. Economic Geography 51 (3):252-268.
Resmini, L. 2007. Regional patterns of industry location in transition countries: Does economic integration with the European Union matter? Regional Studies 41 (6):747-764.
Scott, A. J. 2009. Human capital resources and requirements across the metropolitan hierarchy of the USA. Journal of Economic Geography 9 (2):207-226.
———. 2010. Space-time variations of human capital assets across U.S. metropolitan areas, 1980 to 2000. Economic Geography 86 (3):233-249.
Sharma, S. 2003. Persistence and stability in city growth. Journal of Urban Economics 53 (2):300-320. Shearmur, R., and M. Polèse. 2005. Diversity and employment growth in Canada, 1971-2001: Can
diversification policies succeed? Canadian Geographer 49 (3):272-290.
Storper, M. 1997. The regional world: territorial development in a global economy. Edited by T. G. Press. New York.
Sturgeon, T., J. Van Biesebroeck, and G. Gereffi. 2008. Value chains, networks and clusters: Reframing the global automotive industry. Journal of Economic Geography 8 (3):297-321.
Sturgeon, Timothy, and Gary Gereffi. 2009. Measuring success in the global economy: international trade, industrial upgrading, and business function outsourcing in global value chains Transnational Corporations 18 (2):1-36.
Vernon, Raymond. 1966. International investment and international trade in the product cycle. Quarterly Journal of Economics 80:190-207.
Table 1–Synthetic Regions Definition
Label Synthetic regions Population
( x1000 ) Reticular distance from a metropolitan area (travel time) Density (KM2) Number of spatial units for
2006 (Canada=421)
METRO Metropolitan areas > 500 0 --- 9
CU Central urban areas 10 - 500 Less than an hour and
20 minutes ≥ 50 62
CR Central rural areas < 10 Less than an hour and
20 minutes < 50 83
PU Peripheral urban areas 10 - 500 More than an hour
and 20 minutes ≥ 50 93
PR Peripheral rural areas < 10 More than an hour
and 20 minutes < 50 174
Table 2–Industry (Sector) Classes
Sector SIC-80
Equivalent
Agriculture and Fishing A, B
Forestry, Mining and Oil Extraction C, D
Low-Tech Manufacturing 10, 11, 12, 15, 17, 18, 19, 24, 26
Resource-Based Manufacturing 25, 27, 29, 35, 36
Mid-Tech Manufacturing 16, 28, 30, 31
High-Tech Manufacturing 32, 33, 37, 39
Construction F
Transportation, Storage and Wholesale G, I
Communication and Public Utilities H
Retail Trade J
Finance, Insurance and Real Estate K, L
Business Services M
Public Administration, Education, Health and Social Services N, O, P
Accommodation, Food and Beverage Services Q
Table 3–Functions and Corresponding Occupational Groups
Functions Occupational groups
Senior Management Senior managers and business administrators
Science and Engineering Scientists, engineers, programmers, etc. Social Sciences and Education Economists, policy officers, researchers, actuaries, notaries, lawyers, teachers, etc. Culture, Arts and Recreation Arts, culture and recreation professionals and technicians
Clerical Secretaries, office clercks, receptionists, etc.
Sales and Services Cashiers, sellers, cooks, servers, etc.
Specialized Production Science and engineering technicians, specialized operators, machinists, contractors, mechanics, trades, etc.
Standardized Production Heavy equipment and transport operators, miners, fishers, forestry labourers, trades helpers, miners, farmers, assemblers, etc.
Table 4– Changes in Mean Deviations, Industrial and Regional Effects by Region in Senior Management; Science and Engineering; Social Sciences and Education; and Culture, Arts and Recreation functions, Canada 1971-2006
Table 5– Changes in Mean Deviations, Industrial and Regional Effects by Region in Clerical; Sales and Services; Specialized Production; and Standardized Production functions, Canada 1971-2006