HAL Id: tel-00161432
https://pastel.archives-ouvertes.fr/tel-00161432
Submitted on 10 Jul 2007HAL is a multi-disciplinary open access archive for the deposit and dissemination of sci-entific research documents, whether they are pub-lished or not. The documents may come from teaching and research institutions in France or abroad, or from public or private research centers.
L’archive ouverte pluridisciplinaire HAL, est destinée au dépôt et à la diffusion de documents scientifiques de niveau recherche, publiés ou non, émanant des établissements d’enseignement et de recherche français ou étrangers, des laboratoires publics ou privés.
Frédéric Bron
To cite this version:
Frédéric Bron. Déchirure ductile des tôles minces en alliage d’aluminium 2024 pour application aéro-nautique. Mécanique [physics.med-ph]. École Nationale Supérieure des Mines de Paris, 2004. Français. �tel-00161432�
Collège doctoral
N°attribué par la bibliothèque
T H È S E
∗pour obtenir le grade de
Docteur de l’École Nationale Supérieure des Mines de Paris
Spécialité “Sciences et Génie des Matériaux”
présentée et soutenue par
Frédéric B
RON
le 7 janvier 2004
DÉCHIRURE DUCTILE DES TÔLES MINCES EN ALLIAGE
D’ALUMINIUM 2024 POUR APPLICATION AÉRONAUTIQUE
Directeur de thèse : Jacques BESSON
M. Denis AUBRY MSSMAT, École Centrale Paris Rapporteur
M. Éric MAIRE GEMPPM, INSA de Lyon Rapporteur
M. Jacques BESSON CDM, École des Mines de Paris Examinateur M. Wolfgang BROCKS IMR, GKSS Forschungszentrum Examinateur M. Jean-Christophe EHRSTRÖM ALT, Pechiney CRV Examinateur
M. Michel SUÉRY GPM2, ENSPG Examinateur
M. André PINEAU CDM, École des Mines de Paris Invité
Centre des Matériaux Pierre-Marie Fourt de l’École des Mines de Paris, BP 87, 91003 Évry Cedex
∗Les résultats présentés dans cette thèse sont la propriété de Pechiney CRV
Sommaire
Remerciements 3
Introduction 7
1 Mécanismes de rupture 13
1 Introduction . . . 14
2 Rupture dans les tôles202407tn et202415tn . . . 15
3 Rupture dans les tôles202407t5 et202415t3 . . . 38
Résumé . . . 43
2 Comportement plastique des tôles 45 1 Introduction . . . 46
2 Nouveau critère anisotrope pour la tôle202415tn . . . 46
3 Utilisation du nouveau critère pour la tôle202407tn . . . 75
4 Comportement des tôles pré-étirées202407t5 et202415t3 . . . 75
5 Effet Portevin–Le Châtelier . . . 78
Résumé . . . 81
3 Simulation de la déchirure ductile 83 1 Introduction . . . 84
2 Simulation de la déchirure ductile dans les tôles de fuselage . . . 84
3 Analyse en courbe R . . . 119
Résumé . . . 128
Conclusions et perspectives 129 1 Conclusions . . . 130
2 Perspectives . . . 131
A Plans détaillés des éprouvettes 137
B Essais 147
Remerciements
Je tiens à remercier toutes les personnes sans lesquelles cette thèse n’aurait pas pu se dérouler dans de si bonnes conditions.
Le sujet de la thèse est né au Centre de Recherches de Voreppe de Pechiney grâce à Jean-Christophe Ehrström soutenu par Robert Macé et Bruno Dubost. Il a été judicieusement proposé au Centre des Matériaux de l’École des Mines de Paris où André Pineau, Jacques Besson et Jean-Pierre Trottier en ont assuré la promotion. Je suis donc très reconnaissant à ces personnes d’avoir su bâtir un sujet cohérent, répondant à une vraie problématique industrielle et mêlant harmonieusement des aspects métallurgiques, expérimentaux et numériques. Tout particulièrement, je sais gré à André Pineau d’avoir su me conseiller habilement pour le choix de mon sujet.
Je remercie pour leur générosité le Centre de Recherches de Voreppe de Pechiney, l’Association Nationale de la Recherche Technique et le Ministère de l’Économie, des Finances et de l’Industrie par son soutien au réseau Allègement des Structures Aéronautiques (ASA), qui ont assuré le financement de cette thèse en convention industrielle de formation par la recherche (CIFRE). En particulier, je loue le dévouement de Roger Fougères pour la mise en route du réseau ASA, extraordinaire outil de coopération entre universitaires et industriels.
Je suis extrêmement reconnaissant à mon directeur de thèse, Jacques Besson, pour son encadrement exceptionnel. Il a su se rendre disponible aussi souvent que nécessaire et me laisser une très grande liberté. Il m’a donné les moyens de travailler efficacement tout en me faisant une totale confiance. Il n’a jamais été avare d’explications et s’est toujours montré très impliqué dans mon travail. Enfin, il s’est passionné autant que moi pour le développement du nouveau critère de plasticité anisotrope et je le remercie pour ces folles journées de développement dans Zébulon. Merci aussi pour l’initiation à l’opéra qui n’a pas été vaine puisque la voix des enfants à naître a été doublement efficace !
De plus, je lui fais part de toute ma gratitude pour m’avoir initié à Linux, ce système d’exploitation extraordinaire créé par Linus Torvalds que je ne pourrai jamais remercier assez. Voilà enfin un système entièrement pensé en terme d’efficacité maximale, et non de profit maximal, qui permet d’automatiser tout ce qui est automatisable et d’utiliser au maximum l’outil informatique. Je remercie notamment tous les créateurs de logiciels libres dont la qualité n’a rien à envier aux logiciels payants. Je pense notamment à la Free Software Foundation.
Je tiens aussi à remercier Jean-Christophe Ehrström, mais aussi Bernard Bès et Raphaël Muzzolini, pour leur encadrement du coté industriel. Ils ont toujours été disponibles pour répondre à mes interrogations et par leurs questions très concrètes ils ont su montrer leur intérêt pour mon travail. Une partie du troisième chapitre, notamment, n’aurait pu être écrite sans leur souci constant de l’application de la thèse à des cas concrets.
Je souhaite aussi témoigner toute ma reconnaissance à Jacques Besson, André Pineau, Jean-Christophe Ehrström et Bruno Dubost qui ont relu avec beaucoup d’attention les nombreuses pages que je leur ai confiées dans des délais toujours très courts.
REMERCIEMENTS 5
Je voudrais aussi exprimer toute ma gratitude à Pierre Lorenzon pour son aide très convexe, à Fabrice Esposito pour avoir réalisé l’analyse d’images sur mes échantillons, à Christophe Chabriol, Jean-Claude Huet et Thierry Trouilleton pour avoir mené à bien les essais de courbe R et à Nasserdine Hank pour ses micrographies.
Je souhaite aussi remercier, pour leur soutien technique au Centre des Matériaux, Maria Betbeder, Gérard Brabant, Jean-Pierre Étourneau, Frédéric Feyel, Isabelle Galliet, James Gibier, François Grillon, Jérôme Labrousse, Brigitte Raviard, Michel Rousselot et Grégory Sainte-Luce. J’exprime aussi mes remerciements à Odile Adam pour son extrême efficacité dans la recherche de références en tous genres et pour sa vérification méticuleuse de la bibliographie.
Je voudrais rendre hommage à Éric Maire et Jean-Yves Buffière pour leur très grande amabilité. Ils ont accepté de passer trois échantillons en tomographie à haute résolution pendant l’une de leurs sessions au Synchrotron de Grenoble alors que leurs expériences les occupaient déjà nuit et jour. Ces échanges n’auraient pas pu avoir lieu sans le réseau ASA.
Je témoigne aussi toute ma gratitude à Denis Aubry et Éric Maire pour avoir accepté de rapporter mon travail à l’école doctorale. Je remercie également tous les autres membres du jury que Michel Suéry a accepté de présider. Ich danke besonders Herrn Professor Wolfgang Brocks, der extra von Hamburg gekommen ist.
Je remercie aussi mon père pour avoir construit la ligne de lumière ID19 du Synchrotron de Grenoble qui m’a permis de faire de la tomographie à haute résolution. Je remercie mes parents pour leur soutien permanent pendant mes études et leurs encouragements. Je dois rendre grâce à ma patiente épouse pour m’avoir sorti du travail le temps de promenades vitales et pour n’avoir jamais exécuté sa menace de jeter par la fenêtre l’ordinateur qu’elle avait surnommé « la bête » ! Je salue la ténacité de notre Aurélien qui a su patienter jusqu’à mon retour de Paris après la soutenance pour faire son apparition. Je remercie Anne-Françoise pour les tours de lac et les vendredis de Carême. Je suis extrêmement reconnaissant à mes amis pour leur hospitalité lorsque je n’avais plus de toit : Anne-Françoise et Pierre, Bruno, Claire et Jacques, Jean-Christophe, Sophie et Julien. Je remercie la navette pour ses joies et ses peines et en particulier Cindy pour son dévouement si peu récompensé.
Et enfin je remercie tous ceux du Centre des Matériaux que j’ai croisés et qui ont su rendre mon séjour agréable : Alain, Alexandra, Alexandra, Alexandre, Arnaud, Bénédicte, Benoît, Bruno, Christian, Franck, Franck, Géraldine, Isabelle, Jean-Sébastien, Joseph, Julie, Khaled, Laurent, Liliane, Liliane, Luc, Mélanie, Mihai, Quentin, Rachid, René, Samuel, Sandrine, Sarojinee, Sophie, Stéphane, Stéphanie, Thierry, Toufik, Virginie et Walter. . .
Introduction
Les années 1950 ont vu l’entrée de l’aviation civile dans une ère nouvelle, celle des turboréacteurs. Le premier avion commercial équipé fut construit par la société britannique De Havilland. Ainsi, le « Comet 1 » pouvait voler à plus de dix mille mètres d’altitude à 800 km/h. Cet avion, deux fois plus rapide que les avions à hélice, beaucoup plus stable et moins bruyant, fut plébiscité par les voyageurs dès son premier vol commercial en mai 1952. Pourtant, suite à trois accidents graves, il fut retiré du trafic aérien moins de deux ans après son lancement. Dans les deux derniers accidents, survenus en janvier et avril 1954, l’avion s’était désintégré en vol à plus de huit mille mètres d’altitude. C’est ainsi que les fissures de fatigue du fuselage entraient dans l’histoire de l’aviation. On savait pourtant que la fatigue existait et pouvait notamment intervenir au niveau des ailes mais la pressurisation de la cabine, rendue nécessaire par les hautes altitudes, avait aussi fragilisé le fuselage par des cycles successifs de pressurisation-dépressurisation. Ainsi cet avion révolutionnaire qui aurait dû propulser le secteur aéronautique britannique au premier rang mondial, l’a considérablement handicapé et ce sont deux compagnies américaines, quelques années plus tard, qui s’imposaient avec le Boeing B707 et le Douglas DC8.
Il fallut une année d’enquête et surtout un essai en vraie grandeur pour comprendre les causes des accidents. Une piscine fut spécialement construite et on y plongea un avion Comet de la même série afin de lui faire subir des cycles de pressurisation. L’eau fut choisie à la place de l’air afin de maîtriser les explosions et de conserver la structure pour déterminer les causes de la rupture ; avec de l’air, la cabine aurait été complètement désintégrée à la moindre explosion. L’essai avait pour but de simuler les conditions d’une série de vols pressurisés. La cabine et les ailes étaient alors soumises à des chargements répétés qui se rapprochaient au mieux du chargement en vol. De plus, des fluctuations de charge étaient appliquées sur les ailes afin de s’approcher davantage des conditions réelles. Enfin, pour simuler les autres causes de dommage, par nature imprévisibles, comme des surcharges au décollage ou à l’atterrissage ou encore dues à des perturbations atmosphériques, une pression d’épreuve 30 % plus élevée que la pression de service était appliquée tous les mille « vols ».
Cet avion qui avait fait auparavant 1230 vols pressurisés ne fit que 1830 vols simulés dans la piscine. Une fissure de fatigue commença à se propager à partir du coin d’un hublot et traversa plusieurs raidisseurs comme le montre la figure 1. D’autre part, l’analyse des débris d’un des appareils accidentés a permis de montrer des traces de fatigue près d’un trou de rivet qui confirmaient l’hypothèse que les accidents étaient dus à de la fissuration par fatigue dans des zones à forte concentration de contraintes. Le jugement rendu contre la société De Havilland concluait d’ailleurs : « il existe des méthodes de calcul de la distribution des contraintes dans la structure d’une cabine pressurisée qui devraient être employées avec profit plus largement. »
On pourrait donc penser qu’il suffise d’être capable de bien calculer la distribution des contraintes sur toute la structure de l’avion et de la dimensionner pour ne jamais dépasser la limite d’endurance du matériau. En effet, un tel raisonnement permettrait d’éviter de manière certaine tout problème de fatigue. Malheureusement, il impose d’augmenter les épaisseurs de tôles et conduit invariablement à des avions trop lourds. On admet
INTRODUCTION 9
Fig. 1 : Fissure de fatigue amorcée au coin d’un hublot au cours d’un essai de fatigue en piscine sur un avion Comet 1. La fissure s’est amorcée après 1230 vols réels et 1830 vols simulés. On peut observer sur cette photo la structure habituelle des fuselages modernes : une tôle mince de quelques millimètres d’épaisseur sur laquelle sont fixés des raidisseurs longitudinaux (lisses) et circonférentiels (cadres).
aujourd’hui des coefficients de sécurité relativement faibles (un facteur 3 sur la durée de vie), mais en obligeant par ailleurs à dimensionner la structure en tolérance au dommage. Deux problèmes essentiels se posent alors : il faut être en mesure (i) de pouvoir détecter les fissures et (ii) de garantir qu’une fissure non détectée ne conduise pas à la ruine de la structure en conditions de vol normales ou en cas de surcharge ponctuelle due à des conditions particulières (perturbations météorologiques, atterrissage brutal, etc). La détection des fissures est garantie par un contrôle régulier de l’intégrité de la structure dont l’échéancier est établi à partir d’une étude de la vitesse de fissuration da/dN (où a est la demi-longueur de fissure et N le nombre de cycles). Toute fissure détectée devant être réparée, les plus grandes fissures non détectables sont celles qui seront repérées lors la visite de contrôle suivante et les fissures initiées accidentellement. Il peut s’agir par exemple d’une pale de moteur à hélice qui viendrait transpercer le fuselage. Il faut donc garantir une résistance résiduelle pour une structure fissurée, c’est à dire une bonne ténacité ou résistance à la propagation de fissure.
La résistance à la propagation de fissure est évaluée par des essais de traction sur de grands panneaux rectangulaires pré-fissurés en leur centre (éprouvettes M(T)) ou sur des portions de fuselage réel mises en charge puis transpercées par une lame (Jeong et al., 1995). Traditionnellement, les résultats d’essais sont analysés par des méthodes analytiques basées sur la mécanique linéaire de la rupture. Avec les nouveaux alliages plus tenaces, la plasticité se développe plus largement et pour respecter le confinement de zone plastique imposé par les normes, il faudrait utiliser des éprouvettes dont la largeur pourrait atteindre plusieurs mètres (ASTM, 1999 ; Chabanet et al., 2003). Cependant, les structures réelles ayant une taille limitée, la perte de confinement est tolérée bien que cela fausse l’analyse des essais. Pour s’affranchir de ce genre de problèmes, la prévision de la ténacité par simulation numérique est d’un grand intérêt, notamment si elle est basée sur une bonne compréhension des mécanismes physiques mis
en jeu. L’objectif de la thèse était donc de comprendre et de modéliser la déchirure ductile des tôles minces en alliage d’aluminium 2024. Cet alliage, qui a été développé dans le but d’avoir une haute ténacité, est utilisé pour des parties d’avion soumises à des efforts de traction et pour lesquelles la résistance à la propagation de fissure est critique.
Trois méthodologies peuvent être utilisées pour modéliser la déchirure des tôles minces. La première approche est basée sur l’angle d’ouverture en pointe de fissure (« crack tip opening angle » ou CTOA) : la fissure se propage quand le CTOA atteint une certaine valeur critique. Cette méthode a été appliquée aux structures d’avion avec des formulations 2D ou 3D (Dawicke et al., 1997 ; Deng et Newman Jr, 1999 ; Gullerud et al., 1999) mais aussi à la déchirure des pipelines (O’Donoghue et al., 1991). La seconde approche est basée sur un modèle de zone cohésive. Le chemin de fissuration étant connu à l’avance, une loi reliant la contrainte normale à l’ouverture de la fissure y est appliquée. Cette approche a été utilisée pour des tôles d’aluminium par exemple par Chabanet et al. (2003) et Roychowdhury et al. (2002). L’intérêt de ces deux approches réside dans leur grande simplicité mais comme les mécanismes physiques provoquant la rupture (germination et croissance de cavités, localisation de la déformation, etc) ne sont pas représentés, elles sont difficilement transférables d’un matériau à un autre ou d’une géométrie à une autre. La troisième voie, qui est celle retenue pour cette thèse, est la mécanique continue de l’endommagement. Des équations développées spécifiquement pour les matériaux poreux sont utilisées (Rousselier, 1987 ; Tvergaard, 1989) ; elles permettent de représenter la croissance de cavités sphériques. Cette approche a été utilisée en premier lieu pour les tôles fortes où la triaxialité des contraintes élevée qui s’y développe entraîne une croissance des cavités importante. Le cas des tôles minces a été aussi abordé pour différents matériaux (Grange et al., 2000 ; Rivalin et al., 2001a ; Besson et al., 2001a). Cependant, la triaxialité étant plus faible dans ce cas, les cavités ont tendance à s’allonger et des modèles plus complexes peuvent être nécessaires (Benzerga et al., 1999 ; Pardoen et Hutchinson, 2000, 2003).
L’objectif de la thèse est l’utilisation de la mécanique continue de l’endommagement pour simuler la déchirure des éprouvettes de grande dimension M(T) à partir d’un ajustement du comportement sur des petites éprouvettes de fissuration (Kahn). Le modèle ainsi développé doit pouvoir servir pour étudier des voies d’amélioration du matériau.
Dans le premier chapitre, les deux matériaux de l’étude sont présentés. Il s’agit de deux nuances de l’alliage d’aluminium 2024 : une nuance standard et une nuance de plus grande pureté à haute tolérance au dommage. La différence principale réside dans la teneur en particules intermétalliques qui est fortement réduite dans la nuance à haute pureté. Des essais mécaniques sont effectués sur éprouvettes plates, lisses et entaillées pour caractériser le comportement dans différentes conditions de chargement. La fissuration stable est étudiée avec de petites éprouvettes Kahn ou de grands panneaux M(T). Les mécanismes de rupture sont étudiés à partir d’une analyse des faciès d’éprouvettes rompues.
Le deuxième chapitre présente un modèle développé spécifiquement pour décrire l’anisotropie plastique des alliages d’aluminium (Bron et Besson, 2004). Cet aspect
INTRODUCTION 11
n’est généralement pas pris en compte dans les modèle de CTOA ou à zone cohésive qui utilisent le critère isotrope de Mises. Dans d’autres études sur la déchirure ductile (Grange et al., 2000 ; Rivalin et al., 2001a ; Besson et al., 2001a) ou sur la localisation de la déformation (Brunet et Morestin, 2001), le critère anisotrope de Hill est utilisé. Cependant, l’anisotropie des alliages d’aluminium n’est pas bien représentée par ce critère.
Enfin, le troisième chapitre présente le modèle d’endommagement utilisé. Il est basé sur une version modifiée du modèle de Rousselier (Tanguy et Besson, 2002) qui permet de représenter la croissance de cavités. Le modèle est modifié pour tenir compte de la germination de cavités autour des particules intermétalliques et de l’anisotropie plastique. Il est utilisé pour simuler la déchirure des panneaux M(T) pour les deux nuances utilisées et pour étudier l’influence de la loi d’écrouissage, d’une pré-déformation et de l’anisotropie plastique sur la ténacité.
Mécanismes de rupture
Chapitre 1
1 Introduction
L’objectif de ce chapitre est de comprendre les mécanismes de rupture des tôles en alliage 2024 et de construire une base de données expérimentales permettant d’identifier les paramètres des modèles et de vérifier leur efficacité.
Le matériau de l’étude est un alliage aluminium-cuivre 2024. Un traitement thermique assure le durcissement structural du matériau : mise en solution à 500°C environ, trempe et maturation à la température ambiante (état T4). Deux nuances de l’alliage 2024 ont été étudiées : la première identifiée 202407 est une nuance standard commercialisée et la seconde identifiée 202415 est une nuance en développement à haute tolérance au dommage obtenue par une diminution conséquente de la teneur en fer et silicium à l’origine des phases grossières insolubles (cf. tableau 1.1).
nuance Si Fe Cu Mn Mg Al
202407 0,08 0,16
3,8–4,9 0,30–0,90 1,2–1,8 complément
202415 0,04 0,07
Tab. 1.1 : Composition chimique des nuances 202407 et 202415 (pourcentages massiques). Les teneurs en Si et Fe ont été mesurées ; les teneurs concernant les autres éléments correspondent à la norme ASM (1990).
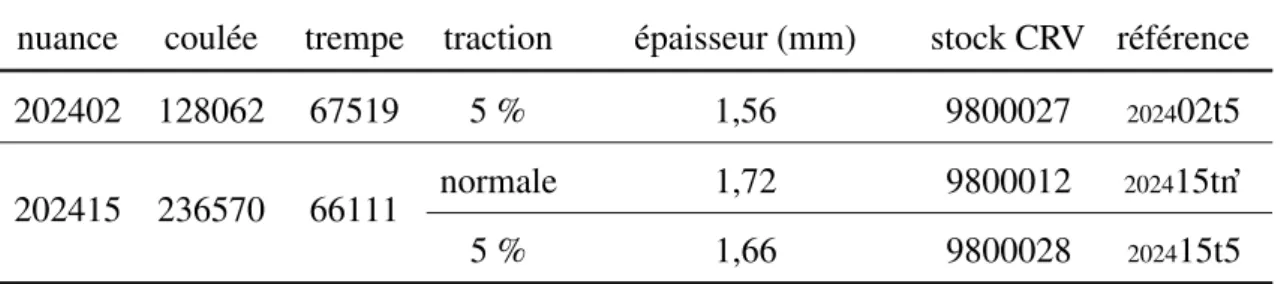
Pour chaque nuance, deux tôles ont été utilisées : la première est une tôle « en l’état » et la deuxième a été pré-étirée de 5 % pour la nuance 202407 et de 3 % pour la nuance 202415. La pré-traction est effectuée en usine mais la valeur indiquée n’est qu’approximative. Le tableau 1.2 donne les références des quatre tôles, la dernière colonne indiquant les références utilisées dans la suite de ce document. En raison d’un manque de matériau, dans certains cas, les tôles 202407t5, 202415tn et 202415t3 ont été remplacées respectivement par les tôles 202402t5,202415tn’ et202415t5 dont les références sont données dans le tableau 1.3. La composition de la nuance 202402 est très proche de celle de la nuance 202407. Par contre la tôle 202415t5 est pré-étirée de 5 % alors que la tôle202415t3 était pré-étirée de 3 %.
De nombreux essais mécaniques ont été effectués sur ces tôles avec sept types d’éprouvettes. Les plans détaillés de ces éprouvettes sont donnés en annexe A. L’éprouvette TR est une éprouvette de traction simple qui est utilisée pour caractériser le comportement élasto-plastique. Les éprouvettes entaillées EU05, EU1, EU2 et EV sont utilisées pour étudier les propriétés d’endommagement et le comportement sous des états de triaxialité différents. Les très grandes éprouvettes de fissuration M(T) permettent de réaliser une propagation de fissure stable de plus de 60 mm de chaque coté de la fissure centrale initiale. C’est l’essai standard dit de « courbe R » utilisé par les avionneurs pour qualifier les alliages de fuselage. L’éprouvette de petite taille Kahn est aussi utilisée. Elle permet une propagation stable sur plus de 20 mm. Les essais sont effectués dans plusieurs directions du plan de tôle. Les directions utilisées sont désignées par les repères indiqués
2. RUPTURE DANS LES TÔLES202407TN ET202415TN 15
nuance coulée trempe traction dim. L × T × S (mm3) stock CRV référence 202407 127448 65742 normale 1500 × 1250 × 1,59 9800090 202407tn
5 % 1500 × 1240 × 1,56 9800091 202407t5 202415 236570 68178 normale 1150 × 1250 × 1,74 9800058 202415tn 3 % 1500 × 1240 × 1,69 9800059 202415t3
Tab. 1.2 : Références des quatre tôles étudiées. L est la direction de laminage, T le sens travers long et S le sens travers court (épaisseur) ; une traction normale est de l’ordre de 1 %
nuance coulée trempe traction épaisseur (mm) stock CRV référence
202402 128062 67519 5 % 1,56 9800027 202402t5
202415 236570 66111 normale 1,72 9800012 202415tn’
5 % 1,66 9800028 202415t5
Tab. 1.3 : Références des trois tôles complémentaires. Une traction normale est de l’ordre de 1 %
dans le tableau 1.4. L’ensemble des essais réalisés au cours de la thèse est donné en annexe B.
Les mécanismes d’endommagement et de rupture sont d’abord étudiés dans les tôles non pré-étirées, 202407tn et 202415tn, à partir d’une analyse de faciès de rupture. Des essais de traction sont effectués sur éprouvettes plates lisses ou entaillées. Des essais de fissuration sont aussi effectués sur des éprouvettes Kahn et M(T). Dans un deuxième temps, la rupture des tôles pré-étirées202407t5 et202415t3 est étudiée.
2 Rupture dans les tôles
202407tn et
202415tn
Cette section a fait l’objet d’un article qui a été soumis à la revue Materials Science
and Engineering A le 13 mai 2003. C’est le texte de cet article qui est inséré ci-dessous. Résumé
Les mécanismes d’endommagement et de rupture des tôles minces en alliage d’aluminium 2024 sont examinés. Deux nuances sont étudiées : un alliage standard et un alliage à haute tolérance au dommage. La microstructure de chaque matériau est caractérisée afin d’obtenir la teneur en particules de seconde phase, les dimensions des particules et la teneur initiale en porosités. Les plus grosses particules sont des intermétalliques. Des
direction direction de laminageangle par rapport à la repère laminage 0 L π/8 LD diagonale π/4 D 3π/8 DT travers long π/2 T
travers court (épaisseur) – S
Tab. 1.4 : Repérage des directions dans les tôles
essais mécaniques sont effectués sur des éprouvettes plates dont la géométrie est lisse, entaillée en U avec différents rayons ou entaillée en V. Des essais de fissuration sont aussi effectués sur des éprouvettes Kahn et de grands panneaux M(T). On observe une propagation stable dans les deux cas. Les faciès de rupture macroscopiques sont observés au microscope électronique à balayage. Les éprouvettes lisses et modérément entaillées présentent une surface de rupture inclinée à 45° par rapport à la direction de traction. Quand la sévérité de l’entaille augmente, le mode de rupture change significativement. La rupture débute en fond d’entaille par une petite région triangulaire perpendiculaire à l’axe de traction. En dehors de cette zone on observe une rupture en biseau. Des observations microscopiques montrent deux mécanismes de rupture. La germination des porosités se fait à partir des phases intermétalliques dans les deux cas. Quand la pression hydrostatique est faible (éprouvettes lisses et modérément entaillées), ces porosités se rejoignent rapidement grâce à un mécanisme de germination en bande qui crée de plus petites cupules dans le ligament inter-porosités. À pression hydrostatique plus élevée, c’est à dire près du fond d’entaille des éprouvettes sévèrement entaillées, la croissance des porosités est favorisée et la rupture finale intervient par striction interne entre les grosses cavités. Dans les éprouvettes de fissuration, la fissure se propage en condition de déformation plane dans la direction de propagation. Cet état favorise la germination en bande et la rupture en biseau.
2. RUPTURE DANS LES TÔLES202407TN ET202415TN 17
Ductile rupture in thin sheets of two grades
of 2024 aluminum alloy
F. Bron
a,b,∗ J. Besson
aA. Pineau
aaCentre des Mat´eriaux, ´Ecole Nationale Sup´erieure des Mines de Paris,
BP 87, 91003 ´Evry Cedex, France
bPechiney Centre de Recherches de Voreppe,
BP 27, 38341 Voreppe Cedex, France
Abstract
The damage and rupture mechanisms of thin sheets of 2024 aluminum alloy (Al containing Cu, Mn and Mg elements) are investigated. Two grades are studied: a standard alloy and a high damage tolerance alloy. The microstructure of each material is characterized to obtain the second phase volume content, the dimensions of particles and the initial void volume fraction. The largest particles consist of intermetallics. Mechanical tests are carried out on flat specimens including U-notched (with various notch radii), V-notched and smooth tensile samples. Cracked samples are also tested, including “Kahn samples” and large center-cracked tension panels M(T); stable crack growth is obtained in both cases. The macroscopic fracture surface of the different specimens is observed using scanning electron microscopy. Smooth and moderately notched samples exhibit a slant fracture surface, which has an angle of about 45° with respect to the loading direction. With increasing notch severity, the fracture mode changes significantly. Failure initiates at the notch root in a small triangular region perpendicular to the loading direction. Outside this zone, slant fracture is observed. Microscopic observations show two failure mechanisms. Primary voids are first initiated at intermetallic particles in both cases. At low hydrostatic pressure (smooth or moderately notched samples), these voids tend to coalesce rapidly according to a “void sheet mechanism” which leads to the formation of smaller secondary voids in the ligaments between the primary voids. At higher hydrostatic pressure, i.e. near the notch root of severely notched samples, void growth is promoted and final rupture is caused by “internal necking” between the large cavities. In cracked specimens, the crack propagates under plane strain conditions in the propagation direction. This state favors void sheeting failure and slant fracture.
Key words: 2024 aluminum alloy, ductile rupture, damage growth, crack initiation, crack
propagation, fracture mechanisms
∗ Corresponding author. Tel.: (33) 4 76 57 81 53, fax.: (33) 4 76 57 80 99
1 Introduction
Alloys of the Al-Cu-Mg series, especially 2024, show a good combination of static tensile properties, damage tolerance and formability. For this reason, they have been used for a long time in airframe structures, especially for fuselage skin (see e.g. Jeong et al. (1995)). They are manufactured in the form of clad thin sheets, which exhibit a good corrosion resistance. Fuselage skin is expected to arrest certain isolated large cracks which may initiate under standard loads. Airplane designers estimate the fracture resistance of fuselage thin sheets using ductile crack growth resistance tests (so called R-curve tests) carried out on very large center-cracked tension panels M(T) (ASTM, 1999). Besides, full scale tests are performed on sub-components. These large scale tests are expensive and require a large amount of time and material. However they could possibly be replaced by tests on small sized Kahn specimens (ASTM, 2001) which also allow stable crack propagation. The aim of this project is to develop a methodology to predict results on large specimens from results on small ones. The main difficulty is that Kahn samples are under large scale yielding whereas M(T) specimens are designed to be under small scale yielding.
This paper deals with mechanical testing, metallographic observations and failure mechanisms of a commercial 2024 alloy and a high purity alloy improved for high damage tolerance. Second phase particles and voids in both materials are characterized by image analysis on optical micrographs. Mechanical tests are carried out on flat specimens including U-notched with various notch radii, V-notched and smooth tensile samples. Cracked samples are also tested which include small sized Kahn samples and large M(T) panels; stable crack growth is obtained in both cases. The macroscopic and microscopic fracture surface of the different specimens is observed in detail and the rupture mechanisms are analysed. In particular, rupture mechanisms for Kahn and M(T) panels are compared.
2 Test materials
Two grades of 2024 aluminum alloy sheets with a nominal thickness of 1.6 mm were supplied by the aluminum manufacturer Pechiney. They are subsequently referred to as 202407tn and 202415tn. Variant 202407tn is a commercial alloy and variant 202415tn is a high purity alloy improved for high damage tolerance. Table 1 gives their chemical compositions. Both grades were solution heat-treated, quenched and naturally aged to a substantially stable condition (T4). To avoid corrosion the sheets are covered with a thin cladding (less than 80 µm) of 1050 aluminum on both faces. In the following, the rolling direction is referred to as L, the long transverse direction as T and the short transverse direction (thickness) as S. D stands for the diagonal direction (45° between direction L and T in the sheet
2. RUPTURE DANS LES TÔLES202407TN ET202415TN 19
Table 1
Chemical composition of 202407tn and 202415tn materials (weight percent). Si and Fe
contents have been measured; data for other elements correspond to the standard ASM (1990).
Si Fe Cu Mn Mg Al
202407tn 0.08 0.16
3.8–4.9 0.30–0.90 1.2–1.8 remainder
202415tn 0.04 0.07
plane). All specimens used in this work were machined from a single plate of the 202407tn or202415tn material. The dimensions of the original plates were 1250 mm in the T direction and 1500 mm in the L direction.
One of the major factors regarding damage tolerance is the presence of coarse intermetallic second phase particles, voids and dispersoids. They are nucleation sites for damage ahead of the crack tip during crack propagation. Thus, they are rather detrimental and must be avoided. Dispersoids can be seen only by field emission gun scanning electron microscopy and transmission electron microscopy (Fig. 1). Most of them are composed of Al-Cu-Mn in proportions close to Al21Cu2Mn3. Their average diameter is about 70 nm and their volume fraction lies between 0.5 and 2 %. Figs 2 and 3 show the microstructure of the two materials observed on two perpendicular cross-sections. The grains are almost equiaxed; their size for both materials is about 30 × 30 × 10 µm3 (directions L×T×S). The as-polished micrographs reveal the presence of intermetallic particles and initial porosities. The volume fraction of coarse intermetallic particles is largely influenced by the iron content which has been reduced in202415tn material (Table 1). The number of coarse second phase particles is much less in 202415tn which confirms its higher purity. Hahn and Rosenfield (1975) and Nakai and Eto (2000) also showed that the fracture toughness should be proportional to the square root of the spacing between second phase particles. The mean spacing is clearly increased for 202415tn material. Most of those particles are composed of either Al-Cu-Fe-Mn(-Si) or Al-Cu-Mg. The first ones have an irregular shape and a size between a few micrometers and 15 µm. The second ones are round with a diameter less than 3 µm. Similar observations have been reported by Gao et al. (1998). The porosity revealed on 2D micrographs could have been created by the polishing process but high resolution X-ray tomography (Maire et al., 2001) confirms this observation. 2D reconstructed slices of the tomography volume (Fig. 4) indicate that second phase particles and voids have the same size and shape than those observed by optical microscopy (Fig. 3, bottom). Fig. 5 provides a volume rendering of202415tn material. It makes it possible to see that the positions of second phase particles and voids are independent.
The morphology of coarse intermetallic particles and voids has been studied by image analysis on 2D micrographs with 256 gray levels (25 micrographs in LS plane and 37 in TS plane for 202407tn, 36 in LS plane and 33 in TS plane
200 nm
Fig. 1. Transmission electron micrograph of dispersoids (dark) in202407tn material
T L
S
50 µm 50 µm
25 µm 25 µm
Fig. 2. Microstructure of 202407tn material in planes LS and TS (optical microscopy).
Polarized light micrographs of the electroetched microstructure reveal the grains of the material (top). As-polished microstructure reveals the second phase particles in gray and the initial porosity in dark (bottom).
2. RUPTURE DANS LES TÔLES202407TN ET202415TN 21
T L
S
50 µm 50 µm
25 µm 25 µm
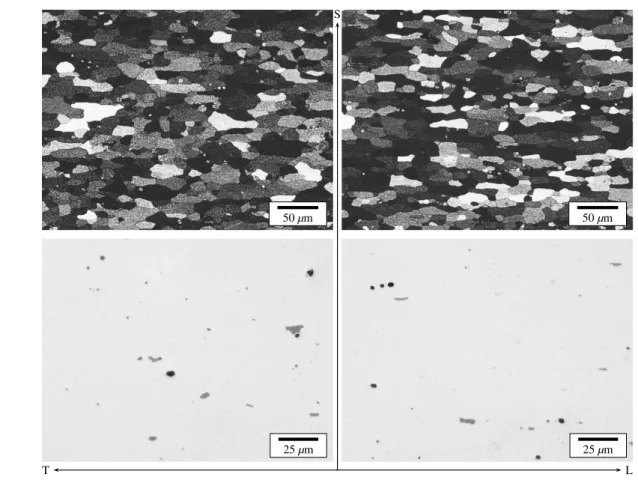
Fig. 3. Microstructure of 202415tn material in planes LS and TS (optical microscopy).
Polarized light micrographs of the electroetched microstructure reveal the grains of the material (top). As-polished microstructure reveals the second phase particles in gray and the initial porosity in dark (bottom).
T L
S
25 µm 25 µm
Fig. 4. Microstructure of202415tn material in planes LS and TS (2D reconstructed slices
from high resolution X-ray tomography). The porosities are in black, the second phase particles in white and the matrix in gray.
T
S L
Fig. 5. Volume rendering of202415tn microstructure (high resolution X-ray tomography).
The porosities are in black and the second phase particles in light gray. The size of the box is 128 pixels = 89.6 µm in each direction (pixel size is 0.7 µm).
for 202415tn). The image size is 720 × 572 (in plane L×S or T×S) and the pixel size is 0.25 µm. An entropy thresholding method was applied to gray scale images to compute threshold levels automatically (Kapur et al., 1985; Sahoo et al., 1988). The results are summarized in Table 2. One notices that dimensions in directions L and T are very similar and that second phase particles, but also voids in some degree, have a “pancake” shape flattened in the S direction. Voids in202407tn are a little smaller than in202415tn but the number of second phase particles is four times that of the high purity alloy and the number of holes is multiplied by one and a half. Finally, the second phase volume fraction is about three times that of202415tn when the void volume fraction remains almost the same. Due to the finite pixel size, the volume fractions should be considered with an error bar of ±40 %. This value is obtained when adding one pixel along the whole perimeter of each particle or void. By moving the optimized threshold 10 gray levels higher or lower, the second phase volume fraction varies by ±40 % and the void volume fraction by ±20 %. This confirms that the global confidence on volume fraction is about ±40 %.
3 Mechanical testing
In this study seven types of samples are used (Fig. 6). The TR sample is a conventional smooth tensile bar used to determine the elastic-plastic behavior. The differently notched samples EU05, EU1, EU2 and EV are used to characterize the behavior under various stress triaxiality ratios and to evaluate damage properties. Center-cracked tension panels M(T) are used to obtain a stable crack propagation
2. RUPTURE DANS LES TÔLES202407TN ET202415TN 23
Table 2
Image analysis on202407tn and202415tn materials. P stands for second phase particles and
V for voids. Small figures in brackets are the standard deviations.
202407tn 202415tn P V P+V P V P+V dimension (µ m) L 2.58(2.2) 2.88(1.3) 2.60(2.2) 2.87(2.6) 4.18(2.1) 3.08(2.6) T 2.63(2.4) 2.53(1.2) 2.63(2.3) 2.59(2.4) 3.70(1.3) 2.78(2.3) S 1.87(1.4) 2.30(0.9) 1.90(1.4) 1.86(1.3) 3.20(1.1) 2.08(1.4) area (µm 2 ) LS 4.25(8.6) 5.80(4.5) 4.36(8.4) 5.14(9.5) 11.4(9.6) 6.14(9.8) TS 4.43(7.9) 4.42(3.6) 4.43(7.6) 4.35(7.2) 9.49(5.7) 5.23(7.3) number (u/mm 2 ) LS 2845 225 3070 751 142 893 TS 3067 247 3313 817 170 987 fs(10−3) 13.0 1.18 14.2 3.71 1.62 5.33
over more than 60 mm at each side of the initial crack. This standard R-curve test is used by aircraft manufacturers to qualify aluminum alloys (Jeong et al., 1995; ASTM, 1999). However, this test is expensive and could be replaced by tests on small sized Kahn specimens which also allow a stable crack propagation over more than 20 mm (ASTM, 2001).
3.1 Experimental setup and testing conditions
All tests are carried out at room temperature on a servo-hydraulic testing machine under displacement control. The specimen thickness is that of the as-received materials: 1.59 mm for 202407tn and 1.74 mm for 202415tn. The tests on small specimens are performed for both materials in at least three directions in the sheet plane (L, D and T). Three specimens at least are tested in each condition and the mean curves are used (scatter is very small). However, tests on M(T) specimens are carried out only once in only two directions (L and T).
The original crack length of large M(T) specimens is 253 mm. The first 249 mm are made by electrical-discharge machining and the last millimeters are obtained by fatigue precracking. The applied maximum load during precracking is 20 % of the yield strength applied to the net section. The stress ratio is 0.1 and the frequency is 3 Hz. To prevent buckling, two rigid face plates are affixed to the central portion of the specimen. A window is kept along the crack path to allow crack length monitoring by a traveling-stage camera. Lubrication is provided between
64 12 18 r 10 18 10 60° 60 25 10 r = 3.75 30 60° 1230 760 253 1030 TR EUr EV Kahn M(T)
Fig. 6. Specimens for mechanical tests (all dimensions in mm) – For TR specimen, longitudinal and transverse deformations are measured. For EUr (r = 0.5, 1 or 2 mm) and EV, left and right opening displacements are measured; the mean value is used. For Kahn and M(T), the crack opening displacement and the crack length are measured. The notch radius of Kahn and EV is less than 60 µm.
the face plates and the specimens. A displacement gage is used to measure the crack-opening displacement across the crack mouth. The gage length is 60 mm. A 1000 kN load cell is used and the cross head speed is 0.1 mm/min.
Kahn specimens are not precracked. The radius of the V-notch is less than 60 µm. The test consists of stretching the specimen with two pins. A 20 kN load cell is used and the cross head speed is 0.085 mm/min. Straight lines parallel to the loading direction are drawn each millimeter from the notch root to enable crack length measure on pictures taken with a fixed digital camera. With this method, the measured crack length is relative to the initial geometry. However the simulation carried out in section 5 shows that the deformation in the propagation direction is nearly zero outside the initiation region. The simulation indicates that the difference between the crack length measured on the initial configuration and the crack length on the deformed configuration is less than 0.05 mm.
For M(T) and Kahn specimens, the resistance to ductile tearing can be evaluated by the energy dissipation rate R proposed by Turner and Kolednik (1994):
R = 1 B0 ∆Udiss ∆a a=5–15 mm (1) where B0 is the initial thickness and ∆Udiss is the energy dissipated in the failure process zone and the surrounding plastically deforming zone for a crack propagation∆a = 10 mm (a = 5 to 15 mm which corresponds to stationary crack growth conditions).
2. RUPTURE DANS LES TÔLES202407TN ET202415TN 25
Table 3
Static mechanical properties of 202407tn and 202415tn materials. YS stands for the yield
strength at 0.2 % offset, UTS for the ultimate tensile strength and Aneckfor the engineering
elongation corresponding to UTS.
angle 202407tn 202415tn
YS (MPa) UTS (MPa) Aneck YS (MPa) UTS (MPa) Aneck
0 (L) 325 452 0.16 337 452 0.15
π/8 298 440 0.21 312 443 0.17
π/4 294 436 0.19 297 433 0.18
3π/8 302 448 0.19 298 438 0.20
π/2 (T) 304 448 0.18 303 443 0.19
For notched specimens, opening displacement is measured on both sides and the mean value is used. A 10 kN cell is used and the cross head speed is 0.085 mm/min for EV and EU05, 0.17 mm/min for EU1 and 0.34 mm/min for EU2 specimens. Smooth tensile specimens TR are used with two displacement gages so that both longitudinal and transverse strains are recorded. A 10 kN cell is used and the cross head speed is 4 mm/min. The different cross head speeds were chosen to obtain approximately the same plastic strain rate in the notch region (≈ 10−3s−1). Nevertheless, tests conducted at different strain rates (10−5–10−1s−1) show that strain rate does not affect the plastic behavior of these materials.
3.2 Results
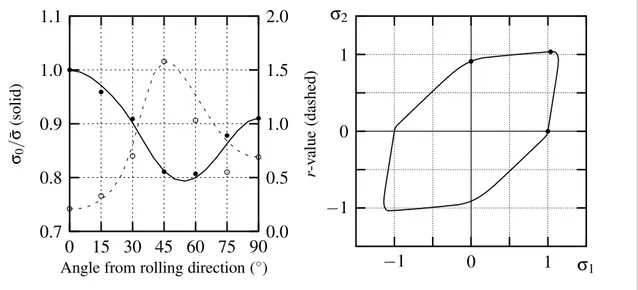
Fig. 7 shows the results of mechanical tests performed in the T direction for smooth and differently notched specimens. It emerges that the elastic-plastic behavior of both materials is very similar whereas the fracture resistance of202415tn is much better: although the uniaxial tensile curves are very close, rupture in notched samples arises much earlier for material202407tn. The load-opening curves of the four differently notched specimens point out the notch effect: when the notch severity increases rupture occurs earlier and for a given opening displacement, the load increases little. EU1 and EU2 specimens lead to a slightly higher load than the tensile specimens. The mechanical tensile properties measured in five directions in the sheet are collected in Table 3 while Fig. 8 displays the flow stress (defined as the true stress) and the width to thickness plastic strain ratio (r-value) of both materials for a plastic deformation of 0.05. The anisotropy of both materials is similar and relatively small. The flow stress is maximum in the L direction (0 rad) and minimum atπ/4. The r-value varies exactly in the opposite way.
EU2 EU1 EU05 EV 202415tn Opening displacement (mm)0.2 0.4 0.6 0.8 1.0 1.2 0.0 EU2 EU1 EU05 EV 202407tn TR 202415tn ∆L/L0 F /S 0 (MP a) 0.20 0.15 0.10 0.05 0.00 400 300 200 100 0 TR 202407tn F /S 0 (MP a) 500 400 300 200 100 0
Fig. 7. Experiments on smooth and differently notched specimens loaded in the T direction for202407tn and202415tn materials. F stands for the load and S0for the initial cross section.
∆L/L0is the longitudinal engineering elongation.
202415tn 202407tn
b) r-value
Angle from rolling direction
1.8 1.6 1.4 1.2 1.0 0.8 0.6 π 2 3π 8 π 4 π 8 0 202415tn 202407tn
a) Flow stress (MPa)
Angle from rolling direction
π 2 3π 8 π 4 π 8 0 435 430 425 420 415 410 405
Fig. 8. Flow stress and r-value anisotropy (width to thickness plastic strain ratio) in the sheet plane for a plastic deformation of 0.05
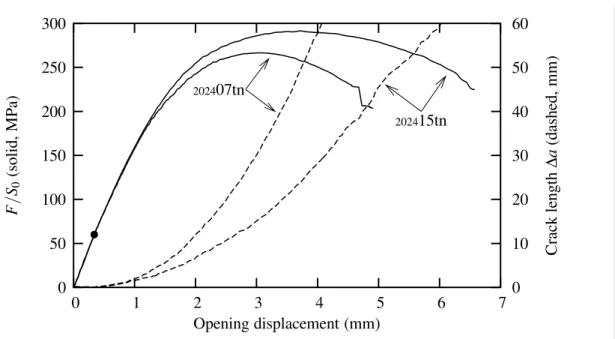
Figs 9 and 10 display the load-opening curves and the crack length measurements on Kahn and M(T) samples. The toughness difference between both materials is significant: in material 202415tn the crack propagates slower and the supported load is higher. Notice that with M(T) sample the propagation initiates at a value almost equal to the fatigue precraking load, i.e. much before the load maximum.
2. RUPTURE DANS LES TÔLES202407TN ET202415TN 27
Table 4
Rupture energies R (J/mm2) for a crack extension in the L direction (loading in the T
direction) between 5 and 15 mm
Kahn M(T) 202407tn 0.17 4.8 202415tn 0.24 10 202415tn 202407tn Opening displacement (mm) Crack length (dashed, mm) F /S 0 (solid, MP a) 20 16 12 8 4 0 5 4 3 2 1 0 150 120 90 60 30 0
Fig. 9. Experiments on Kahn specimens loaded in the T direction for202407tn and202415tn
materials. F stands for the load and S0 for the initial ligament section. Symbols represent
the202415tn simulation.
In all cases (EUr, EV, Kahn and M(T)), rupture anisotropy remains small. Rupture energies for crack propagation in the L direction (loading in the T direction) are reported in Table 4. These energies can be expressed as the sum of two terms (Turner and Kolednik, 1994). The first one is related to the energy dissipated in the rupture process zone while the second one corresponds to the energy dissipated in the plastic zone developed around the crack tip. Due to its small size, Kahn specimen develops large scale yielding. Therefore the plastic zone size is the same for both materials as it is limited by the specimen size; the difference in rupture energies characterizes well the difference in damage resistance: the better damage tolerance of 202415tn corresponds to a higher rupture energy. In M(T) specimen, crack initiation occurs under small scale yielding conditions and the plastic zone is much smaller than the specimen size. The consequence is that the higher load supported by202415tn induces a larger plastic zone that requires more energy. This explains why the relative increase in fracture energy in M(T) (×2.1) is larger than for Kahn specimen (×1.4). The much higher rupture energy in M(T) specimen for both materials is essentially due to the larger plastic zone volume.
202415tn 202407tn Opening displacement (mm) Crack length ∆a (dashed, mm) F /S 0 (solid, MP a) 60 50 40 30 20 10 0 7 6 5 4 3 2 1 0 300 250 200 150 100 50 0
Fig. 10. Experiments on center-cracked panels M(T) loaded in the T direction for202407tn
and202415tn materials. F stands for the load and S0for the initial net section. The black dot
indicates the load maximum during fatigue precracking.
4 Fractography
Fig. 11 shows the fracture surfaces of broken samples from mechanical tests. The appearance of the fracture surface depends on the notch severity. M(T), Kahn and EV exhibit the same aspect: the crack begins with a flat triangular shape perpendicular to the loading direction. This triangle has its base on the notch root and its maximum height is about one and a half of the sheet thickness. The remaining fracture surface is slanted with a 45 degrees angle with respect to the loading direction. When notch severity decreases (EU05) the triangle diminishes in size and finally, for EU1, EU2 and smooth specimens, there is no triangle at all and the whole surface is slanted.
To better understand the failure mechanisms, interrupted tests were performed on Kahn samples in which stable crack growth is obtained. In these tests the specimens are firstly given increasing loads and then broken under fatigue. The fatigue facies is significantly different so it is rather easy to locate the crack front corresponding to the load applied to the specimens. Successive positions of the crack front are shown in Fig. 12. One notices that fracture is initiated well before the load maximum is reached in (b). It starts with the formation of a small flat triangular zone in (a) perpendicular to the loading direction. This triangle grows with increasing load and at the maximum, it reaches both free-surfaces of the sample in (b). From that moment, a slanted zone is formed around the triangle in (c). Then the triangular zone and the slanted zone grow together in (d) and eventually the whole crack front becomes slanted and slightly curved in (e).
2. RUPTURE DANS LES TÔLES202407TN ET202415TN 29
M(T), Kahn, EV EU05 EU1, EU2, TR
loading
direction
notch severity decreases
Fig. 11. Macroscopic shape of the fracture surface
500 µm
e)
c) d)
a) b)
Fig. 12. Failure initiation in a 202415tn Kahn sample (interrupted tests). F stands for the
load and S0for the initial ligament surface.
At a higher magnification, the appearance of the triangle and the slanted plane are very different. In the triangle (Fig. 13b) void growth mechanism is dominant: large dimples can be seen around second phase particles. Their size is about 7 µm in 202407tn and 12 µm in 202415tn. The smaller interparticle distance in 202407tn explains this difference. On the contrary, in the slanted plane (Fig. 13c) void growth is limited and very small secondary dimples are observed (see also Sarkar et al.
(2001)). Their size is less than 1 µm in both materials and particles which size corresponds to that of dispersoids can be seen in each dimple (Fig. 14a). In the slanted plane, the rupture surface also exhibits smooth areas where small dimples cannot be seen (Fig. 14b, left). This indicates that friction between both surfaces has occurred during the failure process: grooves are shown in Fig. 14b (right). These observations are more frequent in smooth tensile specimens.
Finally Fig. 13a shows polished sections of TR specimens deformed at homogeneous elongation (about 17 %). In both materials, only broken particles and holes can be seen. These observations are consistent with those reported by other investigators (Stone et al., 1974). This indicates that debonding and cracking of particles is relatively rapid.
It is important to note that the small sized Kahn samples and the large M(T) panels exhibit exactly the same macroscopic and microscopic fracture appearance: a flat triangular initiation zone with large dimples and a slanted fracture surface with small dimples in the stable propagation zone. This indicates that the same rupture mechanisms occur in both cases.
5 Discussion: failure mechanisms 5.1 Simulation
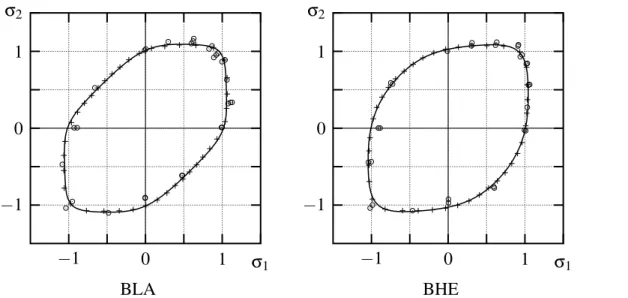
To have a better understanding of the difference between flat and slant fracture modes, a 3D simulation of a Kahn test with crack propagation is performed. The calculation is performed with the object-oriented finite element code Z´ebulon (Besson and Foerch, 1997). The constitutive model for porous materials proposed by Rousselier (1987) and extended by Tanguy and Besson (2002) is used. Damage is represented by a single scalar variable: the porosity f . The mesh size in the propagation region is 160 µm in the loading direction, 200 µm in the propagation direction, and 218 µm in the thickness direction. Using this mesh size slant fracture is not reproduced because it requires a much finer mesh (Besson et al., 2001a,b).
This calculation is similar to those carried out by Chabanet et al. (2003). Isotropic hardening is used with an anisotropic yield surface (Bron and Besson, 2004). This yield criterion is an extension of the one proposed by Karafillis and Boyce (1993). It is adjusted to fit TR, EU1 and EU2 tests. The initial void volume fraction is 1.6 × 10⁻³. It corresponds to the void volume fraction measured by image analysis on 202415tn material (Table 2). A constant nucleation controlled by the equivalent plastic strain is supposed to represent debonding and cracking of second phase particles. Nucleation is treated like in the Gurson-Tvergaard-Needleman (GTN) model (Chu and Needleman, 1980;
2. RUPTURE DANS LES TÔLES202407TN ET202415TN 31 c) b) a) 202407tn 202415tn 20 µm 20 µm 20 µm 20 µm 20 µm 20 µm loading direction
Fig. 13. Broken particles in TR sample at homogeneous elongation (a), large dimples in Kahn sample in the triangular zone (b) and small dimples in Kahn sample in the slanted plane (c). The left column refers to202407tn material and the right one to202415tn material.
Tvergaard and Needleman, 1984; Needleman and Tvergaard, 1984). The total void nucleation corresponds to the volume fraction of second phase particles measured by image analysis: 3.7 × 10⁻³ (Table 2). The nucleation stops when the equivalent plastic deformation is that of homogeneous elongation in a smooth tensile test. Then, the evolution of the porosity is obtained by:
˙f = ˙fgrowth+ ˙fnucleation (2)
= (1 − f )tr ˙ε∼p+3.7 × 10⁻³(p < p0)˙p/p0 where ˙ε∼pis the plastic deformation rate second order tensor and p
0is the equivalent plastic deformation at homogeneous elongation in a smooth tensile test. The two parameters of the modified Rousselier model are adjusted to best fit Kahn tests:
b) a) 20 µm 2 µm 10 µm 400 nm
Fig. 14. Slanted fracture zone in202415tn material. Zoom on small dimples with dispersoids
(a), smooth areas (b, left) with friction marks (b, right)
D = 4.8 and q = 1.05. As finite element calculations using softening models are
mesh size dependent (Liu et al., 1994), these two parameters depend on the chosen mesh size. In particular, the large value for D is related to the relatively coarse mesh used to simulate crack extension.
The macroscopic response is given in Fig. 9 (symbols). The crack growth process initiates slightly too late but the rate is consistent with experiments. This is likely due to the fact that failure mechanisms are different at initiation and during crack extension as shown in section 4. The model parameters were fitted to represent the stationary crack growth and give a poor prediction of initiation.
5.2 Results of the simulation
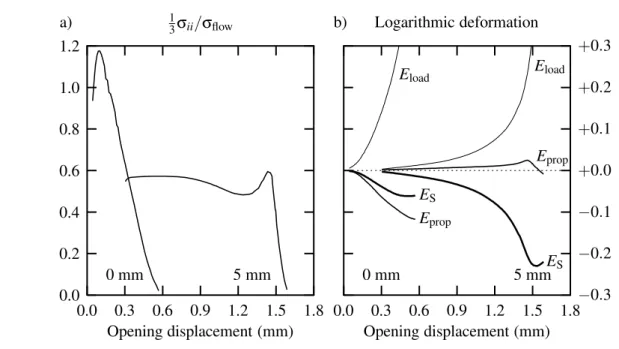
In the modified Rousselier model, as in the GTN model, damage is controlled by the hydrostatic pressureσii/3 normalized by the flow stressσflowof the undamaged material. The stress ratio 13σii/σflowis plotted in Fig. 15a for two different locations: the first one is at the notch root and the second one is 5 mm away in a region where stable slanted cracking is observed. The stress ratio at notch root is twice that in the slanted region. In this situation, void growth around second phase particles is promoted and this explains why large dimples are observed. The decrease of 13σii/σflow is caused by growing damage so that σii → 0. The flow
2. RUPTURE DANS LES TÔLES202407TN ET202415TN 33 b) ES Eload Eprop ES Eload Eprop 5 mm 0 mm Logarithmic deformation Opening displacement (mm) +0.3 +0.2 +0.1 +0.0 −0.1 −0.2 −0.3 1.8 1.5 1.2 0.9 0.6 0.3 0.0 a) 5 mm 0 mm 1 3σii/σflow Opening displacement (mm) 1.8 1.5 1.2 0.9 0.6 0.3 0.0 1.2 1.0 0.8 0.6 0.4 0.2 0.0
Fig. 15. 3D Kahn simulation; comparison of the flat triangular fracture zone (0 mm: at the notch root) and the slanted fracture zone (5 mm away from the notch root). Stress ratio controlling damage growth in constitutive models (a) and strain state (b). Eload, Epropand ES
stand for the logarithmic deformations in the loading direction, in the propagation direction and in the S direction respectively. The results are given from the onset of plasticity to rupture.
stress of the undamaged material does not decrease. Fig. 15b shows the logarithmic deformations at the two locations. Eload stands for the deformation in the loading direction, Eprop for the deformation in the propagation direction and ES for the deformation in the S direction. At 5 mm the deformation in the propagation direction is very small so that almost plane strain state is observed in a plane that is perpendicular to the propagation direction. This situation promotes easy strain localization as mentioned by Needleman and Rice (1978) and justifies the observed slant fracture mode and the limited void growth. The observed localization angle (45°) is that corresponding to plane strain conditions. At notch root, ES and Eprop are close which delays band localization (Needleman and Rice, 1978). Thickness reduction (ES) is much larger in the slanted region than at notch root as observed on broken samples and by Pardoen et al. (1999). In this latter work, flat fracture was always observed. This is likely to be related to the higher hardening capability of the studied material.
5.3 Failure mechanisms
The comparison of the fracture surfaces obtained on smooth and differently notched specimens indicates two failure mechanisms (Fig. 16). Voids are first initiated at intermetallic particles in both cases. In regions where the stress ratio
1
S loading
direction second phase particles dispersoids
S loading direction
plane strain plane
internal necking localization
Fig. 16. Two failure mechanisms: internal necking (left) or localization of the deformation (right).
to the low stress ratio, void growth is limited. However the strain state promotes shear band localization causing the void to coalesce rapidly according to a “void sheet mechanism” (Garrison and Moody, 1987; Bandstra and Koss, 2001) which creates smaller dimples in the inter-void ligaments nucleated at dispersoids. This mechanism is consistent with fractographs shown in Fig. 13c. The failure of the specimens is essentially controlled by a plastic instability: the localization of plastic deformation into a shear band (Rice, 1976). This situation prevails in smooth tensile specimens and slightly notched samples but also in the slanted plane of severely notched samples. Near the notch root of severely notched samples, 13σii/σflow is higher. This promotes void growth. In addition the strain state delays localization and final rupture is caused by “internal necking” (Thomason, 1985) between the large cavities initiated at intermetallics. Shear bands are avoided and secondary dimples created on dispersoids cannot be observed (Fig. 13.b).
6 Conclusions
In this study a commercial 2024 alloy and a high-purity 2024 alloy were investigated. As expected the high-purity alloy contains less second phase particles than the standard alloy. Consequently the damage resistance, as measured from fracture tests performed on smooth, notched and cracked specimens, is improved.
Two particular fracture modes were pointed out corresponding to different stress/strain states. Damage initiates at second phase particles and initial voids in both cases. High hydrostatic pressure promotes void growth leading to large dimples and rupture by internal necking. Low hydrostatic pressure leads to the localization of the deformation into a shear band and the nucleation of smaller dimples on dispersoids between the initial cavities (void sheeting). Smooth and moderately notched samples develop low hydrostatic pressure and void sheeting. Kahn, M(T) and severely notched samples develop high hydrostatic pressure near the notch root and rupture arises by internal necking. However ahead of the crack tip, outside the initiation region, the loading develops high thickness reduction
2. RUPTURE DANS LES TÔLES202407TN ET202415TN 35
leading to a plane strain state in the propagation direction which favors band localization and void sheeting.
Both small sized Kahn samples and large M(T) panels were found to have identical failure mechanisms which suggests that numerical modeling of fracture by a local approach to rupture should be transferable from Kahn samples to M(T) panels.
Acknowledgments
The authors would like to thank very much ´E. Maire and J.-Y. Buffi`ere (INSA, Lyon, France) and P. Cloetens (ID19 beamline, European Synchrotron Radiation Facility, Grenoble, France) who made it possible to have a few hours of synchrotron beam time at ESRF for high resolution tomography. They also would like to thank F. Esposito and B. B`es (Pechiney CRV, Voreppe, France) for their technical support in image analysis and R-curve testing. This research was supported by Pechiney CRV and the French Ministry of the Economy, Finance and Industry (ASA network) for which the authors are grateful.
References
ASM, 1990. ASM Handbook Vol 2: Properties and selection: nonferrous alloys and special-purpose materials, tenth Edition. ASM International.
ASTM, 1999. E 561–98 Standard practice for R-curve determination. Annual Book of ASTM Standards 03.01, 509–521.
ASTM, 2001. B 871–01 Standard test method for tear testing of aluminum alloy products. Annual Book of ASTM Standards 02.02.
Bandstra, J. P., Koss, D. A., 2001. Modeling the ductile fracture process of void coalescence by void-sheet formation. Mater. Sci. Engng A 319–321, 490–495. Besson, J., Brocks, W., Chabanet, O., Steglich, D., 2001a. Ductile rupture of
aluminum sheet materials. Eur. J. Finite Elem. 10, 401–415.
Besson, J., Foerch, R., 1997. Large scale object-oriented finite element code design. Comput. Meth. Appl. Mech. Engng 142 (1–2), 165–187.
Besson, J., Steglich, D., Brocks, W., 2001b. Modeling of crack growth in round bars and plane strain specimens. Int. J. Solids Struct. 38 (46–47), 8259–8284. Bron, F., Besson, J., 2004. A yield function for anisotropic materials, application to
aluminum alloys. Int. J. Plasticity 20 (4–5), 937–963.
Chabanet, O., Steglich, D., Besson, J., Heitmann, V., Hellmann, D., Brocks, W., 2003. Predicting crack growth resistance of aluminium sheets. Comput. Mater. Sci. 26, 1–12.
Chu, C. C., Needleman, A., 1980. Void nucleation effects in biaxially stretched sheets. J. Engng Mater. Tech. 102 (3), 249–256.
Gao, M., Feng, C. R., Wei, R. P., 1998. An analytical electron microscopy study of constituent particles in commercial 7075–T6 and 2024–T3 alloys. Metall. Mater. Trans. A 29 (4), 1145–1151.
Garrison, W. M., Moody, N. R., 1987. Ductile fracture. J. Phys. Chem. Solids 48 (11), 1035–1074.
Hahn, G. T., Rosenfield, A. R., 1975. Metallurgical factors affecting fracture toughness of aluminum alloys. Metall. Trans. A 6A (4), 653–668.
Jeong, D. Y., Orringer, O., Sih, G. C., 1995. Strain energy density approach to stable crack extension under net section yielding of aircraft fuselage. Theor. Appl. Fract. Mech. 22 (2), 127–137.
Kapur, J. N., Sahoo, P. K., Wong, A. K. C., 1985. A new method for gray-level picture thresholding using the entropy of the histogram. Comput. Vision, Graphics and Image Proc. 29 (3), 273–285.
Karafillis, A. P., Boyce, M. C., 1993. A general anisotropic yield criterion using bounds and a transformation weighting tensor. J. Mech. Phys. Solids 41 (12), 1859–1886.
Liu, Y., Murakami, S., Kanagawa, Y., 1994. Mesh-dependence and stress singularity in finite element analysis of creep crack growth by continuum damage mechanics approach. Eur. J. Mech., A/Solids 13 (3), 395–417.
Maire, E., Buffi`ere, J.-Y., Salvo, L., Blandin, J.-J., Ludwig, W., Letang, J. M., 2001. On the application of X-ray microtomography in the field of materials science. Adv. Engng Mater. 3 (8), 539–546.
Nakai, M., Eto, T., 2000. New aspects of development of high strength aluminum alloys for aerospace applications. Mater. Sci. Engng A 285 (1–2), 62–68. Needleman, A., Rice, J. R., 1978. Limits to ductility set by plastic flow localization.
In: Koistinen, D. P., Wang, N.-M. (Eds.), Mechanics of sheet metal forming: material behaviour and deformation analysis. Plenum Press, pp. 237–267. Needleman, A., Tvergaard, V., 1984. Analysis of ductile rupture in notched bars. J.
Mech. Phys. Solids 32 (6), 461–490.
Pardoen, T., Marchal, Y., Delannay, F., 1999. Thickness dependence of cracking resistance in thin aluminium plates. J. Mech. Phys. Solids 47, 2093–2123. Rice, J. R., 1976. The localization of plastic deformation. In: Koiter, W. T.
(Ed.), Theoretical and Applied Mechanics. North-Holland Publishing Company, Amsterdam, pp. 207–220.
Rousselier, G., 1987. Ductile fracture models and their potential in local approach of fracture. Nuclear Engng Design 105, 97–111.
Sahoo, P. K., Soltani, S., Wong, A. K. C., Chen, Y. C., 1988. A survey of thresholding techniques. Comput. Vision, Graphics and Image Proc. 41 (2), 233– 260.
Sarkar, J., Kutty, T. R. G., Conlon, K. T., Wilkinson, D. S., Embury, J. D., Lloyd, D. J., 2001. Tensile and bending properties of AA5754 aluminum alloys. Mater. Sci. Engng A 316 (1–2), 52–59.
2. RUPTURE DANS LES TÔLES202407TN ET202415TN 37
Stone, R. H. v., Merchant, R. H., Low, J. R., 1974. Investigation of the plastic fracture of high-strength aluminum alloys. In: Hickey, C. F., Broadwell, R. G. (Eds.), Fatigue and fracture toughness cryogenic behavior ASTM STP 556. pp. 93–124.
Tanguy, B., Besson, J., 2002. An extension of the Rousselier model to viscoplastic temperature dependent materials. Int. J. Fract. 116 (1), 81–101.
Thomason, P. F., 1985. Three-dimensional models for the plastic limit-loads at incipient failure of the intervoid matrix in ductile porous solids. Acta Metall. 33 (6), 1079–1085.
Turner, C. E., Kolednik, O., 1994. Application of energy dissipation rate arguments to stable crack growth. Fatigue Fract. Engng Mater. Struct. 17 (10), 1109–1127. Tvergaard, V., Needleman, A., 1984. Analysis of cup-cone fracture in a round
L L S
25 µm 25 µm
202407t5 202415t3
Fig. 1.1 : Microstructure des tôles202407t5 et202415t3 dans le plan LS avec particules rompues
avant essai.
3 Rupture dans les tôles
202407t5 et
202415t3
3.1 Microstructure
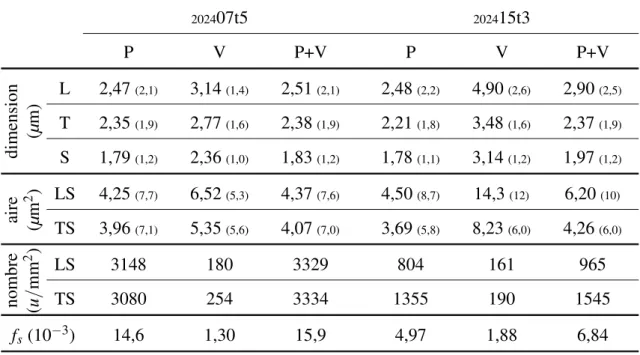
Les tôles pré-étirées présentent une microstructure semblable aux autres tôles mais il est possible de mettre en évidence des particules rompues comme sur la figure 1.1. La morphologie des phases grossières et des trous a été étudiée par analyse d’images (42 micrographies dans le plan LS et 49 dans le plan TS pour la tôle202407t5, 34 dans le plan LS et 46 dans le plan TS pour la tôle 202415t3). Les résultats donnés dans le tableau 1.5 indiquent que les dimensions des phases et des porosités sont pratiquement inchangées par rapport aux tôles non pré-étirées (en tenant compte de la précision des mesures). Ceci montre qu’à 3 ou 5 % d’allongement, la décohésion et la rupture des phases ont déjà commencé mais ne sont pas encore très développées. Comme il a été confirmé dans la section précédente que ces phénomènes sont terminés à la striction, on peut supposer, en première approximation, que la rupture des phases grossières est régulière jusqu’à une déformation correspondant à la striction des éprouvettes lisses.
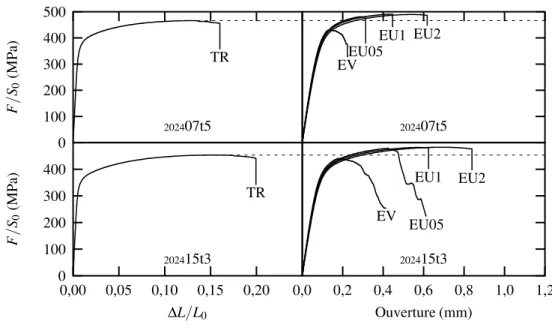
3.2 Essais mécaniques
Les essais mécaniques ont été effectués sur les tôles pré-étirées en suivant le même plan d’expérience que pour les tôles non pré-étirées. La figure 1.2 présente les essais de traction dans la direction T sur les éprouvettes lisses et entaillées. On observe toujours l’effet d’entaille : plus l’entaille est sévère, plus la charge est élevée. Par contre la pré-traction plus importante sur la tôle202407t5 (5 %) que sur la tôle202415t3 (3 %) entraine une limite d’élasticité et des charges globalement supérieures ainsi qu’une plus faible