OATAO is an open access repository that collects the work of Toulouse
researchers and makes it freely available over the web where possible
Any correspondence concerning this service should be sent
to the repository administrator:
tech-oatao@listes-diff.inp-toulouse.fr
This is an author’s version published in:
http://oatao.univ-toulouse.fr/21118
To cite this version:
Ramos, Manuel A.
and Rocafull, Mariona
and Boix, Marianne
and Aussel, Didier and Montastruc, Ludovic
and Domenech, Serge
Utility network optimization in eco-industrial parks by a multi-leader
follower game methodology. (2018) Computers & Chemical
Engineering, 112. 132-153. ISSN 0098-1354
Utility network optimization in eco-industrial parks by a multi-leader
follower game methodology
Manuel A. Ramas
a,Mario na Rocafull
a,Marianne Boix
a,*,Didier Aussel
b,Ludovic Montastruc
a,Serge Domenech
aa Laboratoire de Génie Chimique, U.M.R 5503 CNRS/INP/UPS, Université de Toulouse, 4, Allée Emile Manso, Toulouse Cedex 4 31432, France b Laboratoire PROMES, UPR CNRS 8521, Université de Perpignan, Via Domitia, Perpignan 66100, France
ABSTRACT
A multi-leader-follower game (MLFG) mode! for the design of the utility network in an eco-industrial park (EIP) is studied and implemented by introducing the concept of an environmental authority. The method ology also considers the flowsheet simulation of each enterprise involved in the EIP in order to obtain utility consumption of each enterprise operating by itself. The approach is validated on a case study of a potential Norwegian EIP. In the latter, multi-leader-single-follower and single-leader-multi-follower game models are studied. Each enterprise's objective is to minimize the total annualized cost, while the EIP authority objective is to minimize the equivalent C02 consumption related to utility consumption within the ecopark. The MLFG is transformed into a MOPEC and solved using GAMS® as an NLP. The method ology proposed is proven to be reliable in multi-criteria scenarios compared to traditional multiobjective optimization approaches, providing numerical Nash/Stackelberg equilibrium solutions and specifically in EIP planning and optimization.
1. Introduction
Due to an increasing depletion of natural resources such as fresh water or natural gas, important environmental researches have been developed in the last decades. Process industry is an industrial sector particularly affected by this issue. Indeed, the en vironmental impact induced by the process industry is linked bath to the high volumes involved and to the diversity of taxie products generated along the processing chain.
Consequently, there is a real need for industries to ensure minimum natural resources consumption, while maintaining good production Ievels. In particular, industrial development is often linked to the use of high volumes of freshwater and other utili ties (Boix et al., 2011 ). In order to work towards global environ mental preservation while increasing business success, the concept of industrial ecology has emerged (Frosch and Gallopoulos, 1989). This concept, which is directly linked to sustainable development, aims at engaging separate industries, geographically closed enough, in a collective approach so that exchanges of raw materials, by products, energy and utilities (Chertow, 2000) are maximized. In deed, the most widespread manifestations of these kinds of indus trial symbiosis are eco-industrial parks (EIP). A definition widely
accepted of EIP is "an industrial system of planned materials and energy exchanges that seeks to minimize energy and raw materi als use, minimize waste, and build sustainable economic, ecological and social relationships" (Alexander et al., 2000; Montastruc et al., 2013). As it can be highlighted, a basic condition for an EIP to be economically viable is to demonstrate that benefits of each indus try involved in it by working collectively is higher than working as a stand-alone facility.
Among the methodologies to planning E!Ps in a process engineering framework, mathematical modeling and optimization is the most practical and most adequate one. Nevertheless, Boix et al. highlighted the Jack of studies dealing with optimization in order to design optimal configuration and design of an EIP (Boix et al., 2015). Thus, it is important to develop methodologies able to design or plan an EIP where each industry has a plausi ble gain compared to the case where they operate individually, by also taking into account environmental concerns. Among EIP de sign studies, water-using network is the most common type of cooperation modeled in literature (Boix et al., 2015). In this kind of studies, the case is often solved as a water-allocation problem through a superstructure-based mode! where water has to be dis tributed, treated and discharged in an optimal way between the process units of each enterprise involved in the EIP.
An interesting option to plan EIP consists in modeling the prob lem in a bi-level program according to the concept of game theory.
Nomenclature Latin symbols np= P= nep = EP= nu= U= Rut= Gut= Ud= Up= Uf= Udis = futot = ctot =
X=
Y
=g=
m=
l= Acronymsnumber of processes per enterprise index set of processes
number of enterprises index set of enterprises number of enterprises index set of utilities required utility generated utility utility requirement
utility flow between processes fresh utility flow
utility flow to the discharge total CO2 equivalent mass flow
annualized operating cost of enterprises decision variables of the authority decision variables of the enterprises inequality constraints of the authority equality constraints of enterprises inequality constraints of enterprises AWH annual enterprises operating hours EIP eco-industrial park
HPS high pressure steam KKT Karush-Kuhn-Tucker LPS low pressure steam
MPCC mathematical programs with complementarity con-straints
MLSFG multi-leader single follower game SLMFG single leader multi-follower game Greek symbols
a = fresh utility cost
p = CO2 equivalent emission rate f3 = Recycled utility pumping cost
The problem of EIP planning may constitute a leader-follower game where each participant has their own decision variables and an tagonistic objective functions (usually the cost of the company). To the best of our knowledge, there is no study dealing for the opti mization of a utility network through a game theory modeling. We propose to develop a single leader - multiple followers methodol ogy based on our previous study about game theory approach de voted to the design of water networks (Ramos et al., 2015). Hence, the main novelties of this study are:
- Although bi-level modeling frameworks such as SLMF and MLSF have been already explored and developed in various research domains, the novelty of this work is to apprehend how to for mulate and to apply these concepts to an EIP. Here, we propose an integrated approach to optimally plan a utility network in an eco-industrial park through a bi-level program that allows dis crete decisions: a heat exchange between two unit operations exists or does not exist.
- To apply this whole methodology, the granularity of the mod eling is crucial and we propose the utilization of advanced pro cess engineering tools such as a flowsheeting simulation soft ware combined to optimization tools and game theory concepts to overcome this difficulty.
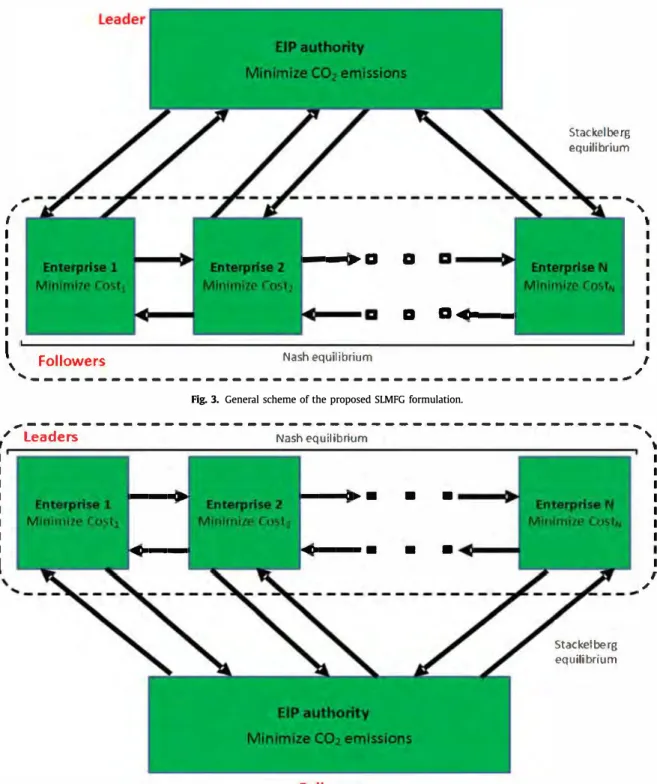
- The EIP is modeled with a SLMF approach where a Stackelberg game (von Stackelberg, 2010) between an environmental au thority and the different companies of the park is involved whereas a Nash game operates at the lower level between
companies. Another novelty of this work is then to propose a comparison between different formulations: SLMF versus MLSF, where the opposite structure is modeled.
2. Previous studies
In the majority of studies, taking process data as a starting point, water-sharing networks between industries/enterprises are planned using linear programming (LP) or mixed-integer linear programming (MILP) models. Furthermore, it is widely known that EIP planning entails the formulation of several objective functions, given that there is completely different interests in play e.g. en vironmental objectives, enterprises gain and resource consumption (Boix et al., 2012; Chew et al., 2011; El-Halwagi, 1997; Lovelady and El-Halwagi, 2009; Rubio-Castro et al., 2012; Tan and Aviso, 2012). Other studies deal with the energetic integration in E!Ps (Chae et al., 2010) or by taking into account simultaneously water and energy integration, following also a multi-objective optimiza tion framework (Fichtner et al., 2004). More recently, Nair et al., (2016) developed a methodology for inter-plant heat integration in an EIP. These authors also proposed to apportion the different costs of participating enterprises. Another recent study dealt with the optimal allocation of renewable energy sources in an EIP with an MILP optimization mode! (Theo et al., 2016). Moreover, very few studies deal also with raw material/products sharing in E!Ps (Kantor et al., 2015).
On the other hand, regarding modeling and optimization meth ods, different recent studies deal with advanced decision-making techniques based on optimization in order to deal with the de sign of EIPs, staying based on the water-sharing network design (Chew et al., 2009) developed a game theory approach for the de cision making process for water integration in an EIP. Nevertheless, the game theory approach was employed a posteriori, i.e. in the decision making process after the optimization step. In this study, different configurations of EIP's are obtained by classical optimiza tion and then, the different integration schemes were evaluated re garding Nash equilibrium. Secondly, Aviso et al. (2010) developed a single-leader multi-follower game (SLMFG) mode! with fuzzy op timization in order to mode! water exchange in EIP. The method ology is then evaluated in a medium-sized case study and under different scenarios. Finally, Ramos et al.(2016) developed an alter native methodology to multi-criteria optimization generally used in the field of process engineering, by applying the methodol ogy in an industrial ecology context (water networks), by using multi-leader-follower game (MLFG) models due to the introduc tion of an EIP authority in the mode!. The latter research com pared the obtained results with traditional multi-objective opti mization results and proved that the proposed game theory mode! methodology was indeed more effective than traditional multi objective/multi-decision optimization methods, e.g. goal program ming. Andiappan et al. (2016) also demonstrated a framework that couples a cooperative game mode! with a stability analysis (Maali, 2009) and a stability criterion (Wang et al., 2013). Their work allows proposing a cost-optimal network by satisfying the stability of raw material costs.
Besides previous works about optimization of EIP's, we can find numerous works related to the application of bi-level pro grams applied to other fields. Game theory concepts have been largely developed and applied to drinkable water network designs (Peldschus and Zavadaskas, 2005), and to the design of dereg ulated electricity markets (Aussel et al., 2016). Moreover, sup ply chain design constitutes an important subject where Stack elberg leader-follower game has been widely applied. Indeed, Chen et al. (2017) investigated the effects of a dual-channel sup ply chain coordinated by the retailer's margin profit on the sup ply chain's profit through a Stackelberg equilibrium. Similarly,
Feng et al. (2017) explored the effects of introducing contracts in such a supply chain. Yue and You (2014) have also differently modeled the supply chain structure through a generalized Nash equilibrium between supplier and customer with the development of a single leader-multiple follower mode! based on generalized Nash equilibrium of multi-echelon supply chain design. Regard ing multiple leader single follower models, one can cite Ang et al. (2013) who developed a mode! where n suppliers (leaders) com pete to provide a product to one manufacturer (follower).In this study, the leaders game is a generalized Nash equilibrium. More recently, Yue and You (2017) developed a bi-level program to opti mally design an integrated forestry and a biofuel supply chain in volving a Stackelberg game between a forestry company and a pulp and paper mil!, by using a single leader - single follower ttnder Stackelberg game. Hjaila et al. (2017) also explored the game the ory approach by developing a non-cooperative Stackelberg game between several enterprises in a supply chain under a competitive uncertain environment. Finally, Gao and You (2017a, 2017b) pro posed a two-players Stackelberg approach, mixed with a multiob jective technique to mode! and solve a Shale gas supply chain.
Ali the aforementioned studies show that a MLFG mode! is a very reliable method to accomplish the design of complex sys tems involving multiple participants. We found it relevant to ex plore an energy network for the planning of an EIP in this context. Indeed, the approach has several demonstrated advantages when compared to traditional approaches and introduces the concept of environmental authority in an EIP context. On the other hand, very few studies deal with utility integration in EIPs. In this work, an optimal utility network planning is addressed by using both MLSFG and SLMFG models. In addition, a general methodology is intro duced in order to further expand on the game theory approaches in EIPs. This work focuses also on the importance of process engi neering in the process of EIP planning and integration, by imple menting process simulation in order to obtain process utility con sumption data for the aforementioned mode!.
3. Methodology
In order to successfully design EIP using the methodology pro posed in this work, several assumptions and aspects have to be taken into account.
First of ail, it is clear that the enterprises involved have to be in feasible geographical vicinity, in order to make matter or energy exchanges directly (to make piping viable). This, as being the main idea behind an EIP, has as consequence that supply chain mod els are not included (at least in the present) in its conception and planning. For this application, the aim is to mode! exchanges be tween unit operations in the same company and simultaneously to exchanges of energy between companies. Thus, the modeling scale is chosen to be at the level of unit operations in order to be able to mode! ail the types of exchanges. Finally, it is very im portant to note that the vital idea behind EIPs is the more sustain able operation of industries, i.e. minimization of natural resources consumption, by providing a significant economic benefit to the participating enterprises. Consequently, EIP optimization models are far from being single-objective classical optimization problems. Zhang et al. (2008) provided a general procedure to early planning and design of an EIP. In the present work, we center our approach on a combination of modem engineering tools, such as process modeling, simulation, mathematical modeling and optimization. 3.1. General approach
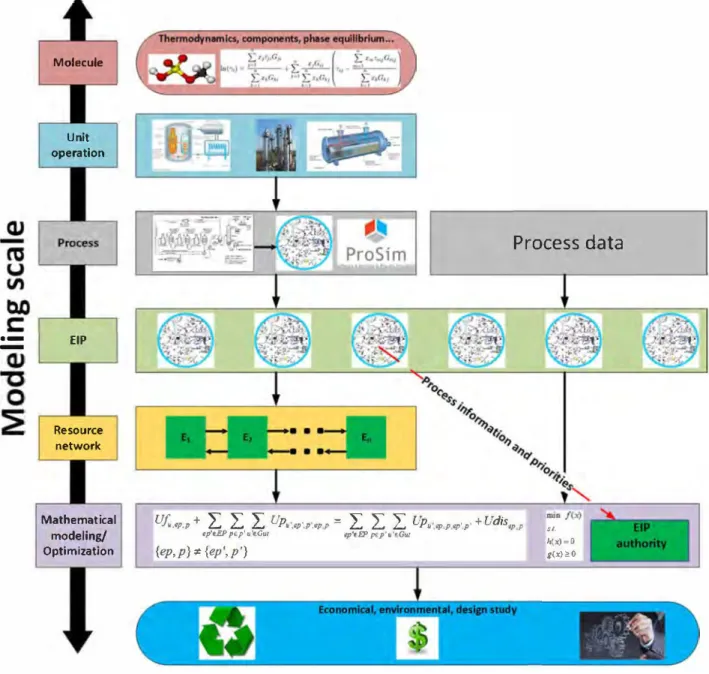
Given the aforementioned assumptions, the proposed method ology is as follows:
The following steps to follow the methodology developed in Fig. 1 are detailed in a chronologie order so that every operator can apply it. The aim is that the participating enterprises give available data to the authority of the park which is represented by a design and planning operator guarantying the confidentiality of the given data and proposing the final exchanges solution of the EIP to the potential companies.
1. Relevant operating conditions procurement and analysis. First, individual operating parameters, process conditions and constraints should be obtained for ail enterprises potentially participating. This is indeed the crucial step in EIP design, since the scale of modeling depends from it; e.g., each independent enterprise can be seen as a whole where raw material is trans formed into a product, or instead, emphasis could be made in each unit operation which constitutes the whole enterprise. Moreover, even rigorous models of unit operations could be considered, in a very large-scale modeling. However, this is very impractical since the latter models are very difficult to solve and are very-large scale in size. It is evident that these lev els of modeling change completely the nature of the EIP plan ning. Thus, it is critical to analyze and classify data provided by enterprises (if it is the case) in order to define beforehand the modeling scale. If data is not provided by enterprises, flow sheeting and simulation should be completed in order to obtain relevant operating conditions of streams and unit operations. This is accomplished by rigorously simulating ail processes unit operations, based on the complete flowsheet defined by each enterprise. In this way, process operating conditions and re quirements i.e. energy and raw material can be obtained in a reliable way. On the other hand, it is a plus to accomplish indi vidual optimization of each flowsheet and energy integration to obtain more advanced data. Process simulation software plays a crucial rote in this step.
II. Type of network definition. With ail process data and operat ing conditions obtained from the step before, it is subsequently needed to conceive a network suitable for exchanges in the EIP. In other words, it is about establishing potential networks of raw material, waste or energy that may benefit the entire EIP, by highlighting potential sources and potential sinks. Examples include water-contaminant networks (Boix et al., 2012), simul taneous heat and water networks (Boix et al., 2011) and utility networks (this work). Once defined, it follows the calculation of additional data needed in order to better understand the po tential exchanges. A sensitivity analysis may be also pertinent at this step.
III.Define a mathematical model for the aforementioned se lected network. Indeed, this step is crucial for the subsequent steps, since it is at this point where the modeling scale cornes into play. Here, several modeling scales may be chosen, de pending on the degree of detail desired. On the other hand, as the degree of detail increases, the larger the scale of the mode! and in consequence more difficult to solve. We pro pose a grey box approach, where each process of each enter prise has already fixed operating parameters obtained from step 1. Moreover, the types of models considered in network op timization in general are often mixed-integer, linear, MILP, or non-linear MINLP problem, which increases the difficulty of the mode!. As such, very detailed models such as rigorous thermo dynamic, kinetic, equilibrium models of unit operations should be avoided. Superstructure-type models are preferred at this stage, where ail interconnections between processes are possi ble (Yeomans and Grassmann, 1999). It is important to define at this point design constraints for the network, in order to ac complish a feasible design of the EIP, e.g. minimum flowrates
Process data
Mathematical modeling/ OptimizationUf..,,p,p + tp'e.EP pep'u'f.Gru
L L L
Up,.,,p'.p',•P,P =L
L
L
UP,•,,p,p,,p',p' + Udis,p,p ,,_ 11p'f.FP Pf.p'u'!Gtil�x)=O g(xJ:eO {ep,p} ;é {ep', p'}
Fig. 1. General methodology. between processes (Ramas et al., 2016) and minimum heat ex
changer transfer area (Boix et al., 2011 ).
IV. Solve each individual enterprise problem. First, each single objective optimization of each enterprise is accomplished by minimizing their operating and/or capital costs. These results will provide important data prior to the results of the EIP op timization problem and will be used to compare the latter ob tained results.
V. EIP Solution methodology. At this point, the optimization mode) is already defined. On the other hand, it is critical to point out that, as aforementioned, EIP optimization problems are multi-criteria, or multi-objective optimization problems. As such, this kind of problems could be solved by advanced decision-making tools as multi-objective optimization methods (Ramas et al., 2014) or as in the present work, by using the concept of EIP regu/ator introduced by Ramas et al. (2016) in the context of E!Ps and using game theory optimization models such as multi-Ieader single-follower game (MLSFG) or single leader multi-follower game (SLMFG) formulations. The latter formulations are very useful in the context of EIP conception
and planning, since it successfully describes the distinction be tween different Ievels of modeling, i.e. environmental objective functions and enterprises profit objective functions, as demon strated by Ramas et al. (2016). Let us note that additional mod eling takes place by adapting the EIP mode) to these game the ory models approach. A suitable solution method has to be se lected as well.
The question of the acceptance of the proposed solu tion/equilibria is an important one. The answer is intrinsi cally included into the MLSF and SLMF game approaches. Indeed the enterprises will accept the proposed solution for two reasons:
- On one hand, each enterprise will have a positive gain compared to the stand-alone situation,
- On the other hand if one enterprise decides to change unilaterally the values of its variables, proposed by the designer, it will either loose or at best equalize its cost of production. Moreover, since their interactions are by
Mixer Process uni t Spli er Fresh u ty U ty from other proce ss units To discharge To other process units Ud • •
⎡ ⎣
⎤ ⎦
, ,
1 1 1 1 1 1 1 1 ---i►a
D
a
a ..
--Stackelberg equilibrium--
...
'
'
1 1 1 1 1 1 1 1 11
Followers Nash equilibrium 1\
'---
,
Fig. 3. General scheme of the proposed SLMFG formulation.
---,
' Leaders Nash equilibrium '
,
'
1 1 1 1 1 1 1 --·---a
►■■ ■
1 1 1 1 1 1 1 1 ·-- ·---■
■ ■
1
1 I,
Stackel be rg equi!ibrium FollowerFig. 4. General scheme of the proposed MLSFG formulation. For the sake of clarity, it is defined:
Uf
=
(Ufu,ep,p: 1::; u::; nu, 1 ::; ep::; nep, 1 ::; p::; np)Upep
=
(UPu,ep,p,ep',P' · ::; uâfl1u, 1 ::; ep'::; nep, 1 ::; p, p'::; np, {ep, p} ;f ep', p' )
Udis
=
(Udisep,p: 1 ::; ep::; nep, 1 ::; p::; np) (8) Additionally, by grouping authority variables in x and each en terprise variables in Yep, we obtain:x
=
(U f, Udis)Yep
=
(UPep), Vep E EP (9)Table 1
Interactions between participants and variables in the different problems. SLMF (following the definitions in Eqs. (8) and Leader
(9)
Follower MLSF (following the definitions in Eqs. (8) and Leader (9) Follower Variables Uf, Udis Upep, VepEEP Upep, VepEEP Uf, Udis
Table 1 sums up what are the different entities controlling each variable in the SLMF/MLSF formulations of the problem.
⎧ ⎪⎪⎪ ⎪⎪⎨ ⎪⎪⎪ ⎪⎪⎩ v ⎫ ⎬ ⎭ ⎧ ⎪⎪⎪ ⎪⎪⎨ ⎪⎪⎪ ⎪⎪⎩ v ⎫ ⎬ ⎭ • •
Fig. S. Flowsheet of the coal g;isilication process. 4.2. Coal gasification
This process entails, broadly speaking, the transformation of coal into a synthesis gas (H2 + CO). The coal gasification is in fact the beginning of the syngas production that consists of coal gasifi cation, C02 capture, and fuel synthesis (in this case methanol and DME). Furthennore, this process allows the option of using the syngas produced as a supplementary fuel in the power plant to gain the advantages by introducing a duct humer for supplemen tary fi ring, as explained by Zhang et al.. (2008 ).
Since the supplementary information provided by Zhang et al. (2008), was not complete enough to successfully sim ulate rigorously ail the coal gasification process, extra sources on the subject were considered. ln fact, Preciado et al. (2012) worked on the simulation of gas production from steam oxygen gasi fication similar to the coal gasification process studied by Zhang et al. (2008), based on a Fischer-Tropsch process and other techniques to separate the sulfur from synthesis gas. Thus, using the known information from both studies it was possi ble to successfully simulate the coal gasification process, whose flowsheet is illustrated in Fig. 5.
The process was divided in two sections as recommended by the works cited above. The first one, i.e. the gasifier itself con sists of an equilibrium reactor after a pre-combustion module in which some of the pyrolysis and the combustion were achieved using oxygen and coal as the feed streams. The other part con sists of a water shift reactor (WSR) where the ratio of H2/CO in the synthesis gas would be defined. ln order to simplify the sim
ulation, the water shift reactor is also considered as an equilib rium reactor. This simplification is not far from reality, since al most ail combustions and water shift reactions proceed rapidly to a very near equilibrium state. The thermodynamic mode! chosen was Peng-Robinson for the vapor phase and ideal for the liquid
phase, since almost ail species intervening are in vapor phase and are mostJy hydrocarbons.
As proposed by Zhang et al. (2008), surat-type coal was se lected as feedstock for the gasifier ( carbon: 0374, volatile matter:
0.4, ash: 0.14, moisture: 0.08, sulfur: 0.005, nitrogen: 0.001 in mass fraction). ln the present work, the ash in the coal was considered to be an inert constituent, so it was not included in the simulation, and on the other hand volatile matter was considered to be com posed of 50/50 n-pentane and n-hexane in mass fraction. The gasi fication reagents were oxygen and steam coming from the HRSG
(heat recovery steam generator). The final composition of the syn gas depends significantly on the operating conditions of the gasi fier. Thus, process design specifications were introduced in order to obtain operating conditions to obtain desired compositions.
The three components coal, oxygen and steam, are fed to the
gasifier to produce raw syngas. The reactions taking place in the gasifier were selected according to Preciado et al. {2012). The sec ond equilibrium reactor, the WS reactor, is where the hydrolysis of the carbonyl sulfide and the water shift reaction (to produce H2, C02 and CO) takes place, ensuring with a design specification, that molar ratio of H2/CO of syngas is approximately 3. Subsequently, in the dewatering unit (De-H20), the elimination of the biggest part
of residual water takes place. Finally, the clear syngas is recovered
in the desulfonation unit; methanol and dry syngas are fed to the
absorption column but, as a result, methanol, H2S and other con
taminants are generated. Furht ermore, a flash separator is used to
recover methanol to recycle it to the desulfonation unit.
4.3. C02 capture
Zhang et al. (2008) proposed a C02 capture process based on
chemical absorption with amines, which consumes a significant arnount of energy regenerating the solvent but is able to extract
11
9
1
Mie.pvaer1
,,.,��� �---151---.i
�---i71---�
Fig. 6. Flowsheet of the syngas m2 capture process.
more C02 than others, and has a high degree of technological ma
turity.
The simulated C02 capture process consists of an absorption column and a regeneration column with solvent recirculation. A water-diluted solution of Diethanolamine (DEA) and water was used as solvent, with a mass fraction of roughly 0.28 of DEA and some traces of carbon dioxide which cornes from the atmosphere. The proposed EIP in this work includes two C02 capture processes: one for the syngas originated from coal gasification and other for the exhaust gas coming from the power plant. There were no dif ferences between the two processes, only the quantity of solvent. due to the differences between the amounts of syngas and flue gas fed. Peng-Robinson equation of state was also chosen to calculate thermodynamic properties. ln Fig. 6, the syngas C02 capture pro cess is illustrated. The exhaust gas C02 capture process is therefore equivalent to the syngas C02 capture process.
As it is illustrated in fig. 6, clear syngas is fed to an absorption
column, in which the carbon dioxide is absorbed into the liquid solvent. Tuen, the COrsolvent phase is fed into a distillation col umn where C02 is recovered as distillate and solvent as bottoms, which is recycled into the process.
4.4. MeOH and DME synthesis
As explained by Zhang et al. (2008), this process is divided in
two parts: MeOH and DME synthesis. The former is composed by an equilibrium reactor followed by a flash separation drum. Re action parameters were obtained from Chang et al. (1986), and Soave-Redlich-Kwong thermodynamic model was used. On the other hand, the
□
ME synthesis process is composed by a stoichio metric reactor and two distHlation columns. The□
ME reaction con sists in methanol dehydration with A1203 as catalyst (Xu et al.,1997). ln this case, UNIQUAC was chosen as the thermodynamic model.
The H2 + CO mixture from the C02 capture is fed to the first reactor where the methanol synthesis takes place as well as the
water gas shift reaction (to produce CO and H20). Subsequently, in
the flash unit, volatile gases are separated easily from the main liq uid products (MeOH and H20) and recirculated for better reaction
yield. At this point, a methanol is either stored for commercializa tion or to feed the second reactor, where the
□
ME synthesis takes place. Finally, two distillation columns are used to obtain DME and MeOH as final products.4.5. Refine,y
ln order to be consistent with the other processes of the park, it was necessary to simulate the refinery plant in order to obtain the needs of utilities. ln the work of Zhang et al. (2008) there was no precision on this process but the quantity of the gas going to and from it, is indicated. With this information and other follow ing assumptions, it was possible to simulate via PROSIM Plus® the whole refinery.
The objective of the refinery plant is to separate and produce petroleum products from crude oil, where are included several classes of fuels, asphalt, paraffin wax, lubricants etc. The procedure for a good distillation of the crude oil is dependent of the compo sition of the feedstock. Every refinery has its own proper specifi
cations when it cornes to the desired product. ln general terms, all the products obtained differ on their boiling point and thus, can be recovered from different heights of the tower. ln order to simulate the fractions of the products it was necessary to divide the process in atmospheric and vacuum d.istillation.
The thermodynamic mode! used in this case was the Peng Robinson's mode! as being the most used when working with petroleum oils, as explained above. General flowsheet of the con ceived refinery is illustrated in Fig. 8.
In order to simulate the fractions of the products it was neces
sary to divide the process in atmospheric and vacuum distillation. In the atrnospheric part, a use of two-phase liquid-vapor separa tor was needed for the components of light hydrocarbons that are gas at room temperature and gases such as N2 , H2S, C02 , and air.
The residue from the two--phase liquid-vapor separator was the in let for the first distillation column which was used to separate the
naphtha from the heavier hydrocarbons like diesel and kerosene and immediately afterwards a second distillation column to divide de diesel from the heavier hydrocarbons (Fig. 9).
�---<211---�
�---<?>---IMjta-n
�s/Wll19
IPvtO! �I
Fig. 7. MeOH/DME synthesis process flowsheet.
For the next fraction, it was necessary to rnake vacuum distüla
tion in order to separate the llydrocarbons from C12 to C22 (as the
!lghtest), C22 to C27 and everything over C29 as residue and which
was considered as asphalt.
Naphtha reforming has an important role in the petro chem istry industry. The core of this process consists of three or four fixed-bed adiabaticalJy operated reactors in series. The feedstock is mixed with a recycled gas stream containing 0.6-0.9 molar fraction of hydrogen which is heated again. The other product is named re formate which is blended for gasoline purposes and can be treated accordingly ta the desired products of the refinery. Each reactor (Fig. 10) was made for a different process in the refining: the
first one was made to simulate the dehydrogenation (Turaga et al., 2003). The next reactor was used to ma.ke the isomerization and the last one for the hydrocracking process. ln this process. alkanes are broken into lower alkane chains thanks to catalyst that is usu ally used. Another benefit is to saturate the fractioned alkanes and then, to decrease the consurnption of hydrogen.
4.6. Power plant
The power plant will be the main energy and steam supplier
in the EIP. therefore is one of the most relevant units. The big
arnounts of energy produced wiU be distributed among the other
faci!ities participating in this park. Thus, ail enterprises will be linked. and this favors the symbiosis within the park.
ln order to implement a flowsheet and simulation of the power plant, a gas turbine is used to produce most part of the power. lt uses a mixture of natural gas (troll gas) and the gas from the refinery as feedstock, for the sake of consistency with Zhang et al. (2008). Operating conditions of unit operations and
requirements were retrieved from Ertesvag et al. (2005). The Peng
Robinson mode) was used in this process simulation.
On the other hand, supplementary firing is one of the post combustion processes employed to improve the power plant and gain some advantages. This complement produces an increase of
the exhausts gas temperature without changing combustion condi tions. Additionally, firing carburant again, will increase the quan tity of C02 in flue gas and that could be a benefit for the following
processes, as the C02 Capture. In our case, the feedstock carburant
was part of the syngas, coming from coal gasification, not used in the MeOH and DME synthesis. Fig. 11 illustrates the flowsheet for the power plant.
The mixture of natural gas and refinery gas enters, together
witb the pre-compressed a.ir to the gas turbine to produce both en ergy and exhaust gases. Afterwards, this gas preheats the cmde oil
for the refinery plant, and later is fed in the boiler with the syngas
to generate the supplementary firing. Subsequently, the flue gas ar
rives to the HRSG (boiler) where, though the introduction of boiled
water, an energy exchange takes place. At this stage, the remaining
exhaust gas is recirculated to heat the natural gas, and sent to the
C02 capture. On the other hand, low-pressure steam is produced
i i
i
!
r
---0--�
lligi �1
i _ ... ,---151---I�- --�
i i1�
Rtarrirg1
IA.Vat >�I
otftjy -
IH,ocg3n 1
i i 1li-œ.y Nvml
Fig. 8. General flowsheet of the conceived refinery. 4.7. Air separation
The air separation process presents the proposed EJP proposed by Zhang et al. (2008) and is considered as a potential im portant process for the conception of the optimal utilities net work within the EIP. ln consequence, a simple air separation fa cility is implemented and simulated in the present study, even though the original authors did not take into consideration such a process.
InitiaHy three different technologies were contemplated: Pres sure swing adsorption process (PSA), which uses the adsorption with zeolite as an alternative to liquefaction, membrane technolo gies, where the gas can be separated by synthetic membranes and
it is also a non-cryogenic process and the cryogenic distiUation process, which needs liquefaction to be implemented. The first two methods are usually used to produce relatively small amounts of air separation, and on the contrary, the cryogenic distillation pro- cess is the most common method in industry by producing higher
ITo�I
□
□
□
tr
----�□□□
lf o� Rtarrirg1
□
□
□
Fig. 9. Atmospheric distillation train.
amounts of production, ensuring the required purity. Hence, this kind of process may be very well suited to an EIP.
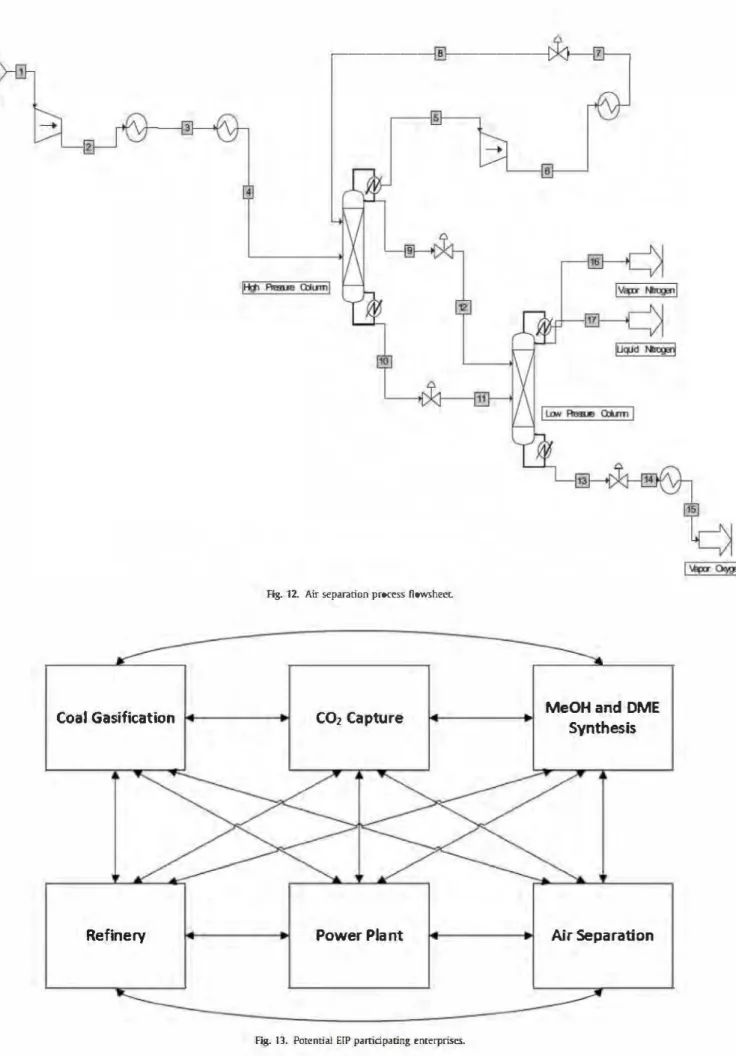
The air separation module was simulated based on Cornelissen and Hirs {1998), using Iow and high pressure dis tillation columns (Fig. 12). The SRI< thermodynamic model is used.
The pre-compressed air is cooled by two heat exchangers to reach liquefaction, at about - 174 °C and is fed to the high pressure column. ln this unit, a portion of the nitrogen, in liquid state. is separated from the remaining mixture, oxygen and nitrogen, which will flow out through the bottom of this column and will reach the low pressure column. Here, liquid oxygen wi11 exit as bottoms from
the column being almost completely separated from nitrogen. lt is then vaporized and sent to storage or distribution.
4.8. Potential partidpating enterprises and utility analysis
Once ail processes have been defined and simulated, the ErP potential participating enterprises are defined. ln fact, similarly to Zhang et al. (2008), each one of the processes simulated in this work would correspond to a potential participating enterprise. As a result, six enterprises would participate in this EIP, as it can be seen in Fig. 13.
Prior to the utility network planning step, it was required to de fine what were the processes potentially involved in energy (util
ity) exchanges, given the energy requirements obtained from the simulations. ln this work, the exploitable processes for the util
ity network optimization are those which need an externat con tribution to produce the energy exchange. The clearest case would be heat exchangers, which must increase or decrease a stream temperature. Moreover, condensers and reboilers of distillation
columns and reactors with energy requirements required as well utilities. On the contrary, electricity was not considered. ln addi tion, note that fired heaters were not included in the present work neither. By taking into consideration these assumptions, different utilities were considered for the potential EIP with different oper ating temperature ranges {Table 2), by carefully exploring and ana lyzing operating temperatures and by choosing the mostly adapted potential utilities, taking into account their temperature ranges. Also, utilities which could be used in more than one process were considered as an important aspect to take into account. For in
stance, severa1 different temperature ranges for the same utility (e.g. water) were considered, since only one temperature range would not suffice for the given energy requirements. Moreover, these different temperature ranges in utilities were considered as a standalone utility, for practicality. In addition, it was considered that several uti.lities have the potential of generating another util
ity after first use, i.e. by recycling it potentially to another process which may exploit it.
Utilities data and parameters, purchase cost and C02 equivalent emissions included were retrieved from Aspen Properties® utili ties database. At this point, it is straightforward to calculate the utility massflow requirements of each process in order to be in accordance with the mode! described earlier. Defined processes with their respective utility massflow requirements (R) expressed in ton/hour are listed in Table 3.
Note that the power plant has 2 processes which generate ex clusively LPS and HPS for use within the EIP (processes 2 and 3), i.e. they correspond to boilers.
5. ResuJts and discussion
Results are presented for both the SLMFG and MLSFG prob lems introduced in the methodology above. On the other hand,
in order to fulfill a significant analysis, annualized utility costs as
suming 8200 h/yr as well as fresh utility consumption when en terprises do not participate in the utility network are beforehand calculated by optimizing each single-objective enterprise problem by itself (described by the mode! above), in other words, by op timizing the internai utility network. Nevertheless, a comparison between the results obtained in this work and those obtained by Zhang et al. (2008) is in fact not possible, since the final objec tive in bath works is not the same. ln fact, in their work, utility networks are not taken into account at the same level as in the present work, whereas in the present work no raw material ex changes are contemplated.
For instance, annualized utility costs and fresh utility consump tion are reported in Table 4.
! i
□□□
J
fmî14rn
□m11œaj□ □
□
D D D11-m,y�I
Fig. 10. Naphta reforming flowsheet.Table 2
Utilities specifkation and parameters.
Utilicy Temperature range (°C) Acronyrn Generate Cast (S/tonne) CO, emission (tonne CO2/tonne utilicy) Cooling Cooling water LPS generation HPS generation 2CJ<'C water Refrigerant 1 Rl 5-20 20--148 LPSG cw LPS LPSG/HPSG/20W/MW 0.0133 5.02 3.509E-03 1.748E-01 R2
Very low temperature
LPS generation 2 HPS generation 2 Heating 70°( water 20--335 20--70 -40- -30 -65 - -55 -103 - -93 -270 - -260 147-148 334-335 70--60 HPSG 20W Rl R2 R3 VLT LPSG2 HPSG2 70W HPS 6.39 1.686E-01 70W 0.0443 1.167E-02 0.0443 7.495E-05 0.0789 7.495E-05 0.114 7.495E-05 0.119 7.495E-05 LPS 4.01 1396E-01 HPS 2.73 7207E-02 6(],N 0.00889 2336E-03 60°C water 60--40 60W 40'C water 40--20 40W Mild water 20--5 MW 40W LPSG/HPSG/20W/MW cw 0.0178 0.0178 0.0133 4.666E-03 4.665E-03 3.509E-03 LPS 148-147 LPS LPSG2 HPS 335-334 HPS HPSG2
As can be seen, the air separation process is the enterprise which consumes the great bulk of fresh utility and on consequence the most elevated utility cost, given that it mainly needs cooling utilities which cannot be shared with other processes once used without regenerating them. ln addition, it should be noted that the main part of fresh utilities correspond in fact to cooling util
-4.16 1396E-01 4.30 7.207E-02
ities, i.e. 78,303.9 tons/hr. vs. only 1716.8 tons/hr. of hot utilities. mostly contributed by the air separation enterprise (which rep
resents 48,984.7 tons/hr.). ln the second place, the power plant
does not need fresh flowrate of the utilities considered in the
present work, since its main utility requirements concern fuel fired heaters to achieve high temperatures needed for the combustions.
Air
Natural Gas Troll Gas Refinery Gas
Combustion Turbine
Turbine Coal Syngas from CO2 Capture
3 4
7
Waste Water
15
HP Steam to Ref. and MeOH … 17
Exh. Gas
LP Steam to CO2 Capt…
16 1 Crude Oil 23 Boiler 5 8 9 6 13 10 14 2 11 12 18
Coal Gasification
Refinery
�---<Bt---1
Fig. 12. Air separation process flowsheet.
C02 Capture
Power Plant
Fi_g. 11. Potential EIP participating ent�rises.
MeOHand OME Synthesîs
Table 5
Table 4
Results of enterprises operating by themselves.
Enterprise Utility costs (MMUSD/yr) Fresh utility consumption (tonne/br) C02 emissions (tonne/br)
Coal gasification 11.94 3819.68 28.46
C02 capture 6.21 6112.17 43.7
MeOH and DME Synthesis 5.17 12396.12 16.99
Refinery 12.37 8708.44 63.83
Power plant 0.056 0 0
Air separation 45.04 48984.27 4.99
Total 80020.7 157.98
Results for the MLSFG utility network optimization.
Enterprise Utility costs Relative Cold/hot fresh utility C02 emissions Utility flowrate (MMUSD/yr) gain(%) consumption (tonne/br) (tonne/br) sent (tonne/br)
Coal 2.78 76.74 3125.45/0 4.31 2263.73 gasification C02 capture 1.7 72.58 5746.26/23.54 23.45 2255.618 MeOH and 4.01 22.38 12261.25/0 14.01 1397.12 DME synthesis Refinery 7.46 39.69 7225.6/142.65 45.25 3901.787 Power plant 0.056 0 0/0 0 0 Air separation 44.99 0.126 49110.12/0 5.34 1224.067 Total 77468.7/166.19 92.35 11042.32 Table 6
Results for the SLMFG utility network optimization.
Enterprise Utility costs Relative Cold/hot fresh utility C02 emissions Utility flowrate (MMUSD/yr) gain(%) consumption (tonne/br) (tonne/br) sent (tonne/br)
Coal 2.75 76.96 3125.45/0 4.31 1818.7 gasification C02 capture 2.13 65.67 5524.29/0.982 19.52 2310.68 MeOH and 3.69 28.63 11923.24/0 12.83 2169.79 DME synthesis Refinery 6.57 46.86 7785.57 /137.12 46.44 2130.79 Power plant 0.056 0 0/0 0 28.09 Air separation 44.98 0.133 49110.12/0 5.34 1031.32 Total 77468.7/138.1 88.43 9489.4 Utility flowrate received (tonne/br) 2420.77 784.429 2636.72 4215.654 66.882 917.867 11042.32 Utility flowrate received (tonne/br) 2418.73 1072.51 2257.14 2785.14 37.73 918.06 9489.4
Indeed, resuits from bath the MLSFG and SLMFG for the utility network in an EIP context are presented in Tables 5 and 6 respec tively.
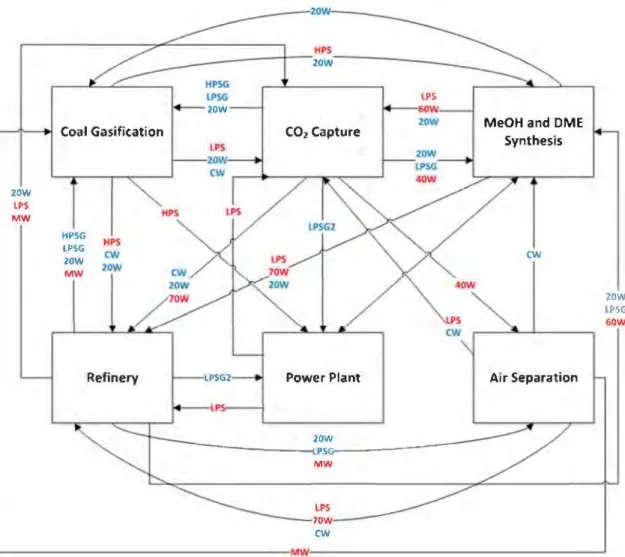
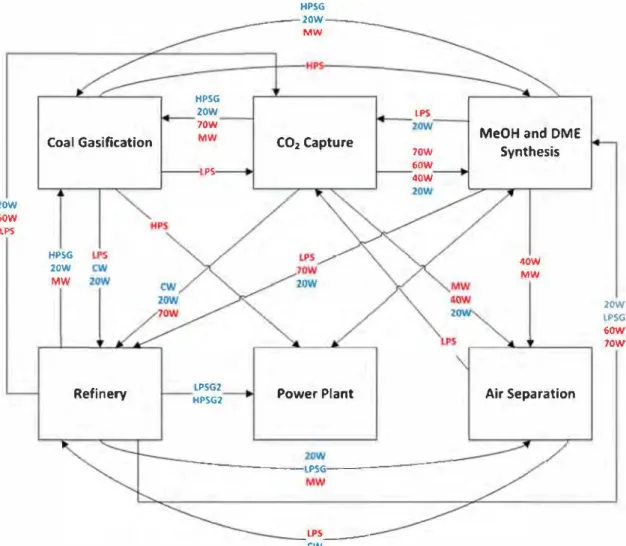
From these results, it can be seen that as expected, fresh util ity consumption as well as C02 emissions decrease compared from the case where each enterprise operates by itself, i.e. 3% in util ity consumption for the MLSFG and the SLMFG formulations plus 41.5% and 44% in C02 emissions respectively. This decrease on util ity consumption may seem insignificant, but as it can be seen most enterprises benefit from this decrease which incentives the fact of sharing utilities and most importantly on C02 emissions, where they are reduced nearly by half. For instance, the coal gasification enterprise has an overall relative gain of 76.87% regarding its base case, which is more than satisfactory and a consistent reduction of 84.85% in C02 emissions. In order to compare the two strate gies of resolution, it is important to remember that the environ mental and economic objectives depend on both the quantity used but also the type. For example, the refinery consumes less utility than the separation of the air by cons in terms of environmen tal impact the results are significantly different. The resolution of such a problem is complex that is why the strategies of resolu tion are used. The SLMF is expected to favor business gains while the MLSF is expected to promote environmental impact. Contrary to the results obtained in the previous study on water networks, the optimum points are very close there is a slight difference
be-tween the two strategies in terms of objective functions on the other hand the network obtained is totally different. By reviewing the reduction on C02 emissions and the sharing scheme in Figs. 14 and 15, utility sharing between Coal Gasification and C02 capture (as well as with other enterprises) allows the EIP to emit consid erably Jess C02 into the atmosphere. In addition, it is important to note that Coal Gasification shares LPS and HPS with other en terprises, and since the latter utilities are among the most C02 producing ones, the emissions reduction is justified. Another im portant point to notice from these results is that a few differences are observed when both SLMF and MLSF are compared regarding C02 emissions. Indeed, in the mode! presented, through the sim ulation process stage, the needs of utilities have been clearly de fined and they need to be satisfied. The satisfaction of the needs is done through closed loops and there is not a lot of available so lutions able to satisfy these demands. This lack of freedom degree explains that there is not a lot of differences between the solutions of SLMF and MLSF. In Ramos et al. 2016, the mode! of water man agement was providing an higher degree of freedom on the satis faction of the demand and the gap between the final outcomes of the MLSF and SLMF formulations were really important (the lat ter being clearly better). In the application of the same method ologies considered in this work the degree of freedom is intrin sically reduced, as mentioned above, and no huge difference be tween the results of bath formulations can be observed.
Neverthe-LP5 20W
Coal Ga5ification COz Capture MeOH and DME Synthesis
20W LPS MW HPSG LPSG cw 20W MW 20W lPSG 60W
Refinery �PSG2 Power Plant Air Separation
2OW ----PS,r.------- -MW LPS 7OW CN
Fig. 14. Map of inter-enterprises exchanges of the SLMF solution. Table 7
Results for the MLSFG utility network optimization w/o the air separation enterprise.
Enterprise Utility costs Relative Cold/hot fresh utility CO2 emissions Utility flowrate Utility flowrate (MMUSD/yr) gain(%) consumption (tonne/hr) (tonne/hr) sent (tonne/hr) received
Coal 2.75 76.97 3125.45 gasification CO2 capture 1.56 74.8 5201.99/4.05 MeOH and 4.89 5.44 12261.25/0 DME synthesis Refinery 7.56 38.93 8393.33/184.87 Power plant 0.056 0 0/0 Total 28982/188.9
Jess this freedom is sufficient to allow a real improvement of the results compared with the stand-alone situation. These two appli cations give an idea of the applicability of the methodology and its limitations. On the other hand, it should be noted that when en vironmental issues are prioritized, i.e. SLMFG formulation, the de crease in fresh utility consumption is negligible, leading to a 4% difference in C02 emissions, which is not negligible. In fact, the sent and received utility flowrate columns in Tables 5 and 6 show how these resources are shared between enterprises. It is interest ing to note that almost ail hot utilities can be supplied by sharing between enterprises (not the case of cold utilities, since its regen eration is not considered) which in most cases represent most of the relative gain. Nevertheless, there are cases in which the
equi-(tonne/hr) 4.31 815.1 2420.77 18.82 3442.32 1514.49 14.01 3802.29 2405.51 55.24 1258.59 2918.12 0 11.487 70.87 9237 9329.76 9329.76
librium solution does not provide enterprises with a positive rela tive gain. It is always the case of the power plant and the air sepa ration enterprise, by considering negligible its relative gain. In this case, the immediate consequence that may corne to thought is that if either formulations solution is chosen, these enterprises will not participate in the EIP utility network. The power plant case is un derstandable, since its benefits from participating in the EIP are surely not coming by sharing the utilities taken into account in this study, but from other sources (Zhang et al., 2008). Although, the air separation enterprise case is different, since it is the most cooling-utility-intensive enterprise in the EIP, more specifically in refrigerants. As can be seen from Table 2, Iow temperature utilities in the present study are not possible to share unless they are
re-HPSG �---HJW--...._,_ MW HPSG 20W LPS 70W
MeOH and OME Coal Gasification MW CO2 Capture
70W Synthesis PS 60W 40W 20W 60W LPS HPSG IIOW 20W MW MW 20W l.PSG 60W 70W
Refinery HLPPSGSG2 2 Power Plant Air Separation
-----tPSG--
---LPS __ _
cw
Fig. 15. Map of inter-enterprises exchanges of the MLSF solution.
Table 8
Results for the SLMFG utility network optimization w/o the air separation enterprise.
Enterprise Utility costs Relative Cold/hot fresh utility CO2 emissions Utility flowrate Utility flowrate (MMUSD/yr) gain(%) consumption (tonne/br) (tonne/br) sent (tonne/br) received
Coal 2.72 77.23 3125.45/0 gasification CO2 capture 2.58 58.37 5742.47 /54.38 MeOH and 3.65 29.48 11720.77/0 DME synthesis Refinery 7.2 41.8 8393.33/111.24 Power 0.056 0 0/0 plant Total 28982/165.6
generated. In fact, of the roughly 49,110 ton/hr of utility consump tion of this enterprise, ail correspond to cold utilities. Thus, the lat ter explains why there is not considerable potential utility-related gain regarding the air separation enterprise. From the latter con clusion, in order to evaluate the potential case where the air sep aration enterprise does not participate on the utility network part of the EIP, the optimal utility network both in MLSFG and SLMFG formulations were solved. Results are shown on Tables 7 and 8 re spectively.
From Figs. 14 and 15, we can see that both solutions are sim ilar although a few differences in inter-enterprises exchanges. The
(tonne/br) 4.31 778.39 2420.77 27.74 84.14 923.67 12.12 89.75 3075.86 44.96 5709.82 232.15 0 28.09 37.73 89.12 6690.2 6690.2
main difference between the two cases is evidently the fresh cold utility consumption, since most of the contribution came from the air separation enterprise. On the other hand, as can be seen, the air separation enterprise contribution to hot utility fresh consumption is negligible compared to cold utility consumption. Relative gains among enterprises are somewhat similar when compared to the 6-enterprise potential EIP, specially the SLMFG formulation. Nev ertheless, it should be noted that both MLSFG and SLMFG formu lations for the 5-enterprise potential EIP shares the same overall fresh utility consumption, but it does not correspond to the same solution regarding the equilibrium of the enterprises. This
phe-nomenon is completely understandable, since the nature and for mulation of the problem is not the same. In fact, it is expectable to obtain different equilibrium solutions from either problem. More over, it can be seen that CO2 consumption between the two cases is maintained, due to the small contribution of the air separation enterprise. Given the relative gains obtained, the most interesting planning of the utility network within the 5 enterprise EIP will be that corresponding to the SLMFG formulation.
6. Conclusions and perspectives
In this study, the importance of process engineering in EIP planning is successfully addressed by creating utility sharing net works through process simulation and subsequently by modeling the problem as a MLFG optimization problem. Process engineering and modeling provide the necessary unit operation information in order to obtain successful results. The obtained results highlight the pertinence of Stackelberg-Nash equilibrium models in order to achieve both environmental and economic benefits. In addition, utility networks are planned with the proposed methodology gen erating savings in consumption, by reusing and exploiting them before discharging. On the other hand, the Stackelberg game struc ture is demonstrated to influence the results of the optimal config uration, which is completely coherent and expected.
As perspectives, a multi-leader-multi-follower game approach for modeling utility networks could be promising by defining dif ferent environmental authorities ( energy consumption, water and different environmental impacts). Indeed, it is evident that en vironmental impacts measured through life-cycle analysis rather than CO2 equivalents could bring important improvements to the designs obtained. On the other hand, it could be interesting to pro pose a mode! with power suppliers in the upper level e.g. local en ergy companies with the consideration of renewable energies that define process of utilities.
References
Alexander, B., Barton, G., Petrie, ]., Romagnoli, J., 2000. Process synthesis and opti mization tools for environmental design: methodology and structure. Comput. Chem. Eng. 24, 1195-1200.
Andiappan, V., Tan, R.R., Ng, D.K.S., 2016. An optimization-based negotiation frame work for energy systems in an eco-industrial park. J. Cleaner Prod. 129, 496-507. doi: 10.1016/j.jclepro.2016.04.023.
Ang, J., Fukushima, M., Meng, F., Noda, T., Sun, j., 2013. Establishing Nash equilib rium of the manufacturer-supplier game in supply chain management. J. Global Optim. 56, 1297-1312.
Aussel, D., Cervinka, M., Marechal, M., 2016. Deregulated electricity markets with thermal lasses and production bounds: models and optimality conditions. RAIRO - Oper. Res. 50, 19-38.
Aviso, K.B., Tan, R.R., Culaba, A.B., Cruz Jr., j.B., 2010. Bi-level fuzzy optimization ap proach for water exchange in eco-industrial parks. Process Safety Environ. Pro tect. 88, 31-40. doi:10.1016/j.psep.2009.11.003.
Boix, M., Montastruc, L., Pibouleau, L., Azzaro-Pantel, C., Domenech, S., 2011. A mul tiobjective optimization framework for multicontaminant industrial water net work design. J. Environ. Manage. 92, 1802-1808. doi:10.1016/j.jenvman.2011.02. 016.
Boix, M., Montastruc, L., Pibouleau, L., Azzaro-Pantel, C., Domenech, S., 2012. In dustrial water management by multiobjective optimization: from individual to collective solution through eco-industrial parks. J. Cleaner Prod. 22, 85-97. doi: 10.1016/j.jclepro.2011.09.011.
Boix, M., Montastruc, L., Azzaro-Pantel, C., Domenech, S., 2015. Optimization meth ods applied to the design of eco-industrial parks: a literature review. J. Cleaner Prod. 87, 303-317.
Boix, M., Montastruc, L., Ramas, M., Gentilhomme, O., Domenech, S., 2017. Benefits analysis of optimal design of eco-industrial parks through life cycle indicators. Computer Aided Chemical Engineering 40, 1951-1956.
Brooke, A., Kendrick, D., Meeraus, A., Raman, R., 1998. GAMS User's Guide. Chae, S.H., Kim, S.H., Yoon, S.-G., Park, S., 2010. Optimization of a waste heat uti
lization network in an eco-industrial park. Appl. Energy 87, 1978-1988. doi:10. 1016/j.apenergy.2009.12.003.
Chang, T., Rousseau, R.W., Kilpatrick, P.I<., 1986. Methanol synthesis reactions: cal culations of equilibrium conversions using equations of state. Ind. Eng. Chem. Proc. Des. Dev. 25, 477-481. doi:10.1021/i200033a021.
Chen, X., Zhang, H., Zhang, M., Chen, J., 2017. Optimal decisions in a retailer Stack elberg supply chain. !nt. J. Prod. Econ. 187, 260-270.
Chertow, M.R., 2000. Industrial symbiosis: literature and taxonomy. Ann. Rev. En ergy Environ. 25, 313-337. doi:10.1146/annurev.energy.25.1.313.
Chew, I.M.L., Tan, R.R., Foo, D.C.Y., Chiu, A.S.F., 2009. Game theory approach to the analysis of inter-plant water integration in an eco-industrial park. J. Cleaner Prod. 17, 1611-1619. doi:10.1016/j.jclepro.2009.08.005.
Chew, l.M.L., Thillaivarrna, S.L., Tan, R.R., Foo, D.C.Y., 2011. Analysis of inter-plant water integration with indirect integration schemes through game theory ap proach: pareto optimal solution with interventions. Clean Tech. Environ. Policy 13, 49-62. doi:10.1007/s10098-010-0280-x.
Cornelissen, R.L., Hirs, G.G., 1998. Exergy analysis of cryogenic air separation. Energy Conver. Manag. 39, 1821-1826. doi:10.1016/S0196-8904(98)00062-4. El-Halwagi, M.M., 1997. Pollution Prevention Through Process Integration: System
atic Design Tools. Academic press.
Ertesvag, !.S., Kvamsdal, H.M., Bolland, O., 2005. Exergy analysis of a gas-turbine combined-cycle power plant with precombustion CO2 capture. Energy 30, 5-39. Feng, L., Govindan, K., Li, C., 2017. Strategic planning: design and coordination for dual-recycling channel reverse supply chain considering consumer behavior. Eur. J. Oper. Res. 260, 601-612.
Fichtner, W., Frank, M., Rentz, O., 2004. Inter-firm energy supply concepts: an op tion for cleaner energy production. J. Cleaner Prod. Appl. Ind. Eco!. 12, 891-899. doi:10.1016/j.jclepro.2004.02.036.
Frosch, R.A., Gallopoulos, N.E., 1989. Strategies for manufacturing. Scientif. Am. 261, 106-115.
Gao, J., You, F., 2017a. Game theory approach to optimal design of shale gas supply chains with consideration of economics and life cycle greenhouse gas emissions. AIChE J., 63 7, 2671-2693.
Gao, J., You, F., 2017b. Economie and environmental life cycle optimization of non-cooperative supply chains and products systems: modeling framework, mixed-integer bilevel fractional programming algorithm and shale gas applica tion. Sustainable Chem. Eng. 5, 3362-3381.
Hjaila, K., Puigjaner, L., Lainez, J.M., Espufia, A., 2017. Integrated game-theory mod eling for multi-enterprise-wide coordination and collaboration under uncertain competitive environment. Comput. Chem. Eng. 98, 209-235.
Kantor, 1., Betancourt, A., Elkamel, A., Fowler, M., Almansoori, A., 2015. Generalized mixed-integer nonlinear programming modeling of eco-industrial networks to reduce cost and emissions. J. Cleaner Prod. 99, 160-176. doi:10.1016/j.jclepro. 2015.03.017.
Lou, H.H., Kulkarni, M.A., Singh, A., Huang, Y.L., 2004. A game theory based approach for emergy analysis of industrial ecosystem under uncertainty. Clean Technol. Environ. Policy 6, 156-161.
Lovelady, E.M., El-Halwagi, M.M., 2009. Design and integration of eco-industrial parks for managing water resources. Environ. Progress Sustainable Energy 28, 265-272. doi:10.1002/ep.10326.
Maali, Y., 2009. A multiobjective approach for solving cooperative n-person games. Electr. Power Energy Syst. 31, 608-610.
Montastruc, L., Boix, M., Pibouleau, L., Azzaro-Pantel, C., Domenech, S., 2013. On the flexibility of an eco-industrial park (EIP) for managing industrial water. j. Cleaner Prod. 43, 1-11. doi:10.1016/j.jclepro.2012.12.D39.
Nair, S.K., Guo, Y., Mukherjee, U., Karimi, I.A., Elkamel, A., 2016. Shared and practical approach to conserve utilities in eco-industrial parks. Comput. Chem. Eng. 93, 221-233. https://doi.org/10.1016/j.compchemeng.2016.05.003.
Peldschus, F., Zavadskas, E.I<., 2005. Fuzzy matrix games multi-criteria mode! for decision making in engineering. Informatica 16, 107-120.
Preciado, j.E., Ortiz-Martinez, J.J., Gonzalez-Rivera, J.C., Sierra-Ramirez, R., Gordillo, G., 2012. Simulation of synthesis gas production from steam oxy gen gasification of Colombian coal using Aspen Plus®. Energies 5, 4924-4940. doi:10.3390/en5124924.
Ramas, M.A., Boix, M., Aussel, D., Montastruc, L., Domenech, S., 2016. Water inte gration in eco-industrial parks using a multi-leader-follower approach. Comput. Chem. Eng. 87, 190-207.
Ramas, M.A., Boix, M., Aussel, D., Montastruc, L., Vilamajo, P., Domenech, S., 2015. Water exchanges in eco-industrial parks through multiobjective optimization and game theory. Comput. Aided Chem. Eng ..
Ramas, M.A., Boix, M., Montastruc, L., Domenech, S., 2014. Multiobjective optimiza tion using goal programming for industrial water network design. Ind. Eng. Chem. Res. 53, 17722-17735.
Rubia-Castro, E., Ponce-Ortega, J.M., Serna-Gonzalez, M., El-Halwagi, M.M., 2012. Op timal reconfiguration of multi-plant water networks into an eco-industrial park. Comput. Chem. Eng. 44, 58-83. doi:10.1016/j.compchemeng.2012.05.004. Tan, R.R., Aviso, K.B., 2012. An inverse optimization approach to inducing resource
conservation in eco-industrial parks. In: 11th International Symposium on Pro cess Systems Engineering, pp. 775-779.
Tawarmalani, M., Sahinidis, N.V., 2005. A polyhedral branch-and-cut approach to global optimization. Math. Program. 103, 225-249.
Theo, W.L., Lim, J.S., Wan Alwi, S.R., Rozali, N.E.M., Ho, W.S., Abdul-Manan, Z., 2016. An MILP mode! for cost-optimal planning of an on-grid hybrid power system for an eco-industrial park. Energy 116, 1423-1441. doi:10.1016/j.energy.2016.05.043. Turaga, U.T., Ramanathan, R., Rajesh, K.S., Khanrah, A., Sa, B., 2003. Catalytic naphtha reforming: revisiting its importance in the modern refinery. J. Scientif. Ind. Res. 62, 963-978.
Von Stackelberg, H., 2010. Market structure and equilibrium. Springer Science and Business media, New York.
Wang, G., Feng, X., Chu, K.H., 2013. A nove! approach for stability analysis of indus trial symbiosis systems. J. Cleaner Prod. 39, 9-16.
Xu, M., Lunsford, J.H., Goodman, D.W., Bhattacharyya, A., 1997. Synthesis of dimethyl ether (DME) from methanol over solid-acid Catalysts. Appl. Catalysis A 149, 289-301. doi:10.1016/S0926-860X(96)00275-X.
Yeomans, H., Grassmann, I.E., 1999. A systematic modeling framework of super structure optimization in process synthesis. Comput. Chem. Eng. 23, 709-731. doi:10.1016/S0098-1354(99)00003-4.
Yue, D., You, F., 2014. Game-theoretic modeling and optimization of multi-echelon supply chain design and operation under Stackelberg game and market equilib rium. Comput. Chem. Eng. 71, 347-361.
Yue, D., You, F., 2017. Stackelberg-game-based modeling and optimization for supply chain design and operations: a mixed integer bilevel programming framework. Comput. Chem. Eng. 102, 81-95.
Zhang, X., Strnmman, A.H., Solli, C., Hertwich, E.G., 2008. Model-centered approach to early planning and design of an eco-industrial park around an oil refinery. Environ. Sei. Technol. 42, 4958-4963.