Video Article
Preparation, Imaging, and Quantification of Bacterial Surface Motility Assays
Nydia Morales-Soto1,2, Morgen E. Anyan1, Anne E. Mattingly1, Chinedu S. Madukoma1, Cameron W. Harvey3, Mark Alber3, Eric Déziel4, Daniel B. Kearns5, Joshua D. Shrout1,2,61Department of Civil and Environmental Engineering and Earth Sciences, University of Notre Dame 2Eck Institute for Global Health, University of Notre Dame
3Department of Applied and Computational Mathematics and Statistics, University of Notre Dame 4INRS-Institut Armand-Frappier
5Department of Biology, Indiana University
6Department of Biological Sciences, University of Notre Dame
Correspondence to: Joshua D. Shrout at [email protected]
URL: http://www.jove.com/video/52338
DOI: doi:10.3791/52338
Keywords: Microbiology, Issue 98, Surface motility, Swarming, Imaging, Pseudomonas aeruginosa, Salmonella Typhimurium, Bacillus subtilis,
Myxococcus xanthus, Flagella
Date Published: 4/7/2015
Citation: Morales-Soto, N., Anyan, M.E., Mattingly, A.E., Madukoma, C.S., Harvey, C.W., Alber, M., Déziel, E., Kearns, D.B.,
Shrout, J.D. Preparation, Imaging, and Quantification of Bacterial Surface Motility Assays. J. Vis. Exp. (98), e52338, doi:10.3791/52338 (2015).
Abstract
Bacterial surface motility, such as swarming, is commonly examined in the laboratory using plate assays that necessitate specific concentrations of agar and sometimes inclusion of specific nutrients in the growth medium. The preparation of such explicit media and surface growth conditions serves to provide the favorable conditions that allow not just bacterial growth but coordinated motility of bacteria over these surfaces within thin liquid films. Reproducibility of swarm plate and other surface motility plate assays can be a major challenge. Especially for more “temperate swarmers” that exhibit motility only within agar ranges of 0.4%-0.8% (wt/vol), minor changes in protocol or laboratory environment can greatly influence swarm assay results. “Wettability”, or water content at the liquid-solid-air interface of these plate assays, is often a key variable to be controlled. An additional challenge in assessing swarming is how to quantify observed differences between any two (or more) experiments. Here we detail a versatile two-phase protocol to prepare and image swarm assays. We include guidelines to circumvent the challenges commonly associated with swarm assay media preparation and quantification of data from these assays. We specifically demonstrate our method using bacteria that express fluorescent or bioluminescent genetic reporters like green fluorescent protein (GFP), luciferase (lux operon), or cellular stains to enable time-lapse optical imaging. We further demonstrate the ability of our method to track competing swarming species in the same experiment.
Video Link
The video component of this article can be found at http://www.jove.com/video/52338/
Introduction
Many bacteria move on surfaces using various means of self-propulsion. Some motility phenotypes can be researched in the laboratory using plate assays that are affected by the liquid environment associated with the semi-solid plate assay composition. A subset of useful surface motility plate assays further involve a gas phase—typically room air. Accordingly, the outcome of any particular surface motility assay, demands careful control of the interface of three phases: the local environmental solid surface, liquid environment, and gas environment properties. The most commonly studied motility mode in such a three-phase assay is known as swarming. Swarming motility is the coordinated group movement of bacterial cells that are propelled by their flagella through thin liquid films on surfaces1. It is typically studied in laboratories using semi-solid plate assays containing 0.4%-0.8% (wt/vol) agar1. An array of human pathogens exploit this motility behavior to explore and colonize the human host. For instance, Proteus mirabilis uses swarming motility to move up the urethra, reaching and colonizing the bladder and kidneys2. Swarming motility is generally considered a precursor step to biofilm formation, the primary cause of pathogenesis in many human pathogens3.
The swarming phenotype is highly varied among bacterial species; experimental success and reproducibility strongly rely on factors such as nutrient composition, agar type and composition, sterilization protocol (e.g., autoclaving), semi-solid media curing, and ambient moisture (e.g., seasonal changes), among others3-5. The variability of surface motility responses emphasizes the challenges encountered in these studies and the significant influence media and environment can exert. For some swarming species, such as Pseudomonas, swarming motility can occur on a variety of media compositions, although the observed phenotype and accompanying swarm expansion rate will vary greatly3. Combined, these factors can make surface motility studies extremely challenging. Seasonal variability within a lab can influence these three-phase assays: assays may function better in the humid-air of summer and worse in the dry air of winter. Here we present general guidelines to circumvent some of the most notable challenges when performing surface motility plate studies.
For some surface motility studies, the development of specific phenotypes is of great interest. Most, but not all, published studies to examine swarming of P. aeruginosa show the formation of tendrils or fractals radiating from an inoculation center3-9. Differences between P. aeruginosa strains have been documented5,8, but much of the presence or absence of tendrils can be attributed to the specific medium and protocol used for these swarm motility plate assays. Here we include details on how to promote tendril-forming swarms for P. aeruginosa. Because P. aeruginosa is just one of many swarming bacteria, we also include details for our method to examine swarming of Bacillus subtilis and gliding of Myxococcus
xanthus. Like P. aeruginosa, current research on B. subtilis and M. xanthus spans an array of topics as researchers are working to discern
aspects of sporulation, motility, stress response, and transitional behavior1,10. There is a need to quantify the patterns and dynamics of the specific behavior(s) for these cells in swarming groups.
Surface motility data acquisition, analysis, and interpretation can be cumbersome and qualitative. We have developed a protocol for the detailed macroscopic analysis of bacterial swarms that provides in addition to swarm zone morphology and size (e.g., diameter), quantitative dynamic information regarding swarm expansion rate and bacterial or bioproduct density distribution7. Furthermore, this method can take advantage of available fluorescent proteins, luminescence, and dyes to obtain a comprehensive view of bacterial interactions8, as well as to track the synthesis of bioproducts (e.g., P. aeruginosa rhamnolipid7,8) within a swarm.
Protocol
1. Swarm Assay Media Preparation and Inoculation
4,5,7,8,111. Media Preparation
NOTE: The medium composition described below is applicable to P. aeruginosa tendril formation studies. Please see media specifications on Table 1 for P. aeruginosa, B. subtilis, and M. xanthus surface motility assays.
1. Mix 200 ml of FAB-minus (NH4)2SO4 swarm medium (Materials Table), 0.9 g of Noble agar, and 0.2 g of Casamino acids (Table 1) by stirring with a magnetic stir bar. Use small volumes (100-300 ml) to improve consistency between experiments.
2. Autoclave the 200 ml agar/media mixture using an exposure time of 22 min, exposure temperature of 121.1 °C, and a fast vent option. The autoclave settings will allow proper sterilization and agar melting, but prevent agar caramelization.
NOTE: Noble agar is prone to caramelization; bacterial motility is altered on caramelized agar.
3. Immediately after the sterilization cycle has finalized, close the cap of the media bottle to prevent water loss by evaporation. However, note that tight capping can cause a “vacuum sealing”-like effect on the bottle.
4. Cool the media to 50 °C while stirring at room temperature (RT) and add 2 ml of sterile 1.2 M glucose. Alternatively, place the media in a 60 °C incubator or water bath until ready to use (up to 15 hr later), and proceed as indicated. To prevent the formation of bubbles in the media, mix thoroughly using the magnetic stir bar; bubbles on the surface of the agar will prevent even swarming.
NOTE: For other assays, add at this step heat-sensitive components that cannot be autoclaved such as additional nutrients or dyes, as needed (e.g., addition of 8 µl Invitrogen Syto 63 dye per 100 ml melted agar to image M. xanthus as shown in Representative Results, below). Addition of some dyes may affect baseline swarming behavior, which should be checked against a non-dye control.
5. In a laboratory hood, aliquot 7.5 ml of sterile media per 60 mm diameter polystyrene Petri dish and maintain the plates in a single layer (not stacked). For larger swarming surface, aliquot 25 ml of media per 100 mm diameter Petri dish. It is important to fill the dishes on an even horizontal surface. Use a bull’s eye level to check if the surface is leveled.
NOTE: For P. aeruginosa assays, using a specific media volume per plate will improve consistency and reproducibility. For B. subtilis and M. xanthus assays, hand pouring yields results comparable to specific volume aliquots.
2. Plate curing
1. For small plates (60 mm), allow the melted agar medium to cure (both set to semi-solid and dry excess liquid) in the hood uncovered (i.e., without lids) for 30 min. Larger plates (100 mm) require a longer curing time (see Discussion).
NOTE: Alternatively, some assays may require plates to cure on the bench top overnight (20-24 hr) covered (i.e., lids on) in a single layer (Table 1). Swarming is sensitive to both excess and inadequate moisture. The humidity, airflow, and temperature of any given lab may necessitate variation to plate curing to promote optimal swarming of you bacterium.
2. Inoculate plates immediately after the drying period is over. Do not store the plates for further use.
1. Perform the “ink spread test” by spotting a test plate with 10 µl mixture of 0.50% (vol/vol) Higgins Waterproof Black India Ink and bacterial inoculum11. If the ink/inoculum mixture spreads readily (i.e. does not retain droplet form) on the surface of the media, the media will need additional time to dry.
NOTE: For species that are particularly sensitive to humidity (e.g., P. aeruginosa), perform a quick “ink spread test”11 to determine if the plates are dry enough.
3. Swarm Assay Inoculation
1. Inoculate 6 ml of broth culture media (see Table 1 for details) with an isolated colony from a fresh (< 5 days old if left at room temperature) Lysogeny Broth (LB) plate culture. Incubate broth cultures overnight (≤18 hr) at 30 °C or 37 °C with horizontal shaking (240 rpm).
2. Inoculate swarm plates by spotting with 1-5 µl of overnight broth culture, or by “poking” the agar with a sterile tooth pick or wire inoculation needle.
NOTE: We prefer the latter method because it decreases the likelihood of spattering the inoculum and prevents adding additional moisture to the swarm surface area.
4. Swarm Assay Incubation
1. For general assay, incubate swarm assay plates at 30 °C or 37 °C (or even 42 °C for B. subtilis; Table 1)—this is bacterium specific. Invert the plates during incubation so that excess moisture condenses on the lid, not the agar.
NOTE: Temperature can affect phenotype as well as kinetics. For P. aeruginosa swarms, incubation at 37 °C leads to faster growth and swarm expansion than incubation at 30 °C; however, the morphology of these swarms often differs with this change in temperature.
2. For time-lapse imaging, incubate swarm plates at the appropriate temperature prior to transfer into the imaging station (see Table 1 for details).
NOTE: This pre-imaging incubation allows swarms to start their development and become established before being moved to a new environment, which may or may not be optimal for swarming motility.
2. Macroscopic Imaging of Surface Motility Assays
7,81. For time-lapse imaging, after the pre-imaging incubation period place swarm assay plates on a clear imaging plate inside a commercial in
vivo imaging station. Image up to six, 60 mm diameter or four, 100 mm diameter plates at a time. Since the camera captures images from
beneath the imaging plane, invert the plates so that the optical path is not obstructed8. Alternatively, incubate at 30 °C or 37 °C (Table 1) for the duration of the experiment, and remove the plates to be imaged from the incubator at set time intervals.
2. Place the lids of the Petri dishes upright on top of the plate counterpart that holds the inoculated media. Fill the lids of the Petri dishes with water to prevent excessive drying during imaging, and enclose the entire set up using another clear tray to maintain humidity throughout the experiment.
3. Using Molecular Imaging (MI) software12, run assay(s) at room temperature using the imaging settings described in Table 2. For time-lapse imaging, set up a protocol with the necessary steps and specifications.
3. Data Processing and Interpretation
7,81. Image Processing
1. Use MI software to batch export images as 16-bit TIFF files: File > Export or Export Multiple > Select file(s) to export and export location.
2. Use ImageJ to open a single image or import a time-lapse series: 1. Open a single image: File > Open
2. Import time-lapse image sequence: File > Import Sequence, and select “Sort names numerically”.
1. For larger time-lapse files, select “Use virtual stack” in the “Import Sequence” window to stack the exported images into appropriate categories (i.e., GFP, RFP, etc.).
3. If required, change images from 16-bit files to 8-bit files: Image > Type > 8-bit NOTE: Some ImageJ tools require 8-bit images.
4. Determine if the intensity signal for an image or time-lapse sequence needs to be inverted. Place the cursor on a bright spot in the image (e.g., fluorescently labeled growth) and note the signal intensity “Value” from the ImageJ toolbar. Then, place the cursor in a dark spot outside the plate area and note the signal intensity. If the signal intensity for the dark spot is larger than the intensity for the bright spot, the image signal intensity needs to be inverted (follow substeps 1-2 below).
1. Invert the intensity signals: Edit > Invert
2. Invert the lookup table: Image > Lookup Tables > Invert LUT
5. Subtract the background: Process > Subtract Background, and use a “Rolling ball radius” with a pixel radius that is one half of one image dimension (e.g., 1,000 pixels for a 2,000 x 2,000 pixel image).
6. Artificially color an image or time-lapse sequence: Image > Lookup Tables, and select the appropriate color from the list options. 7. For movies with two or more channels, merge and balance the colors prior to saving as a movie (Image Processing, Step 8). To merge
images together, open all image stacks in ImageJ, then select Image > Color > Merge Channels, and assign each stack to a color channel.
8. Save time-lapse sequence as AVI or QuickTime Movie: File > Save as, and choose desired format and specifications. 2. Data Analysis
1. Acquiring Bacterial Surface Growth Area to Quantify Expansion Rate 1. Open image(s) in ImageJ
2. To calculate the diameter of the plate in pixels, draw a line across the center of an assay plate with the “Straight” tool from the and measure its length: Analyze > Measure
3. The default measurement unit in ImageJ is the pixel. Obtain a conversion factor by dividing the diameter of the assay plate (e.g., 60 for a 60 mm plate) by the pixel length obtained in the previous step.
4. Change the unit of measurement from pixel to mm: Image > Properties
1. Change the “Unit of Length” to “mm”, and the “Pixel Width”, “Pixel Height”, and “Voxel Depth” to the conversion factor calculated in the previous step. Select the “Global” box to maintain this conversion factor across multiple images. NOTE: If ImageJ is closed and reopened, or the field of view of an image is changed (i.e., one image is zoomed in more than another), the conversion factor must be recalculated. Alternatively, perform all analyses in pixels and then converted to mm.
5. For every frame, trace and measure the swarm area using the “Freehand Selections” tool in the toolbar to trace the outline of the swarm and measure the area using: Analyze > Measure. This will generate a measurements log that can be saved for further analysis in Microsoft Excel or similar programs: File > Save As
2. Acquiring Bacterial Surface Growth Intensity to Quantify Surface Growth Rate
1. Once the background is subtracted (Image Processing, Step 5), use the last frame of the sequence to determine the maximum area of swarm (Data Analysis, Step 1).
2. Use the “Oval” selection tool from the toolbar to draw a box around the bacterial surface growth.
4. To obtain intensity signal measurements for each frame in the time-lapse sequence, while on the first frame of the sequence go to: Analyze > Measure. This will generate a measurements log that can be saved for further analysis in Microsoft Excel or similar programs: File > Save As
3. Alternative to the previous section (Data Analysis, Step 2). Use the ImageJ Macros plugin to setup and run a Macros surface growth intensity measurement script.
1. Setup an automated measurement script to analyze multiple frames simultaneously: Plugin > New > Macro, and paste the provided script (below) into the box and save as an ImageJ Macros text file: File > Save, and save to the ImageJ application folder under “macros”.
numberOfFrames = N
for(i=0; i< numberOfFrames; i++){ run('Measure');
run('Next Slice [>]'); }
NOTE: Here the variable “N” is for an undefined number of frames.
2. Edit the “numberOfFrames” in the Macros plugin for each experiment to reflect the number of frames in the image sequence prior to running the script. Use: Plugin > Macros > Edit, and type in the correct number of frames in the sequence and save (File > Save).
3. Follow substeps 1-3 in Data Analysis-Step 2, and while on the first frame of the sequence run the Macros plugin: Plugin > Macros > Run. This will generate a measurements log that can be saved for further analysis in Microsoft Excel or similar programs: File > Save As
Representative Results
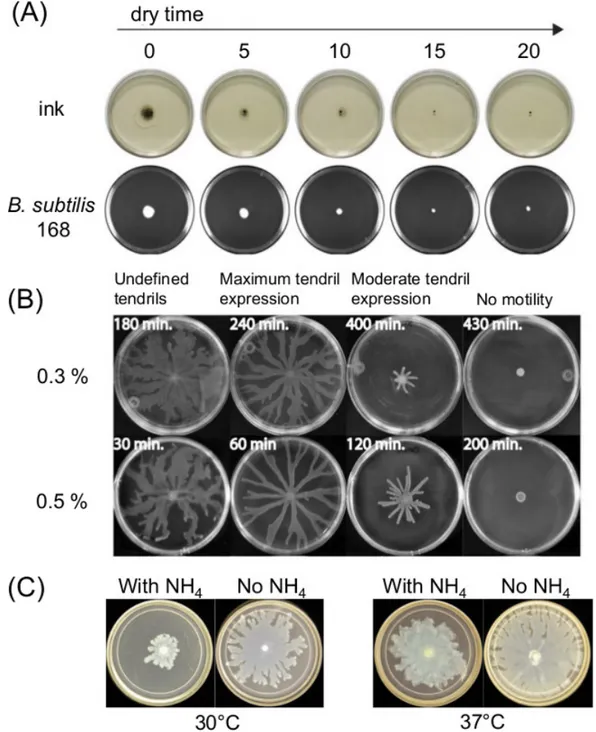
Variation in plate preparation can greatly influence swarming motility. The curing or drying time after pouring of melted agar medium affects the thin liquid film present on surface motility assays and the bacterial motility over time. Changes in nutrient composition also affect swarming for several bacteria. Figure 1A shows a short-term effect of drying time upon spreading of India Ink and spreading of an initial inoculum of Bacillus
subtilis11. Figure 1B shows the effect of drying time and Figure1C shows the effects of ammonium sulfate [(NH4)2SO4] upon subsequent tendril development by swarming P. aeruginosa5.
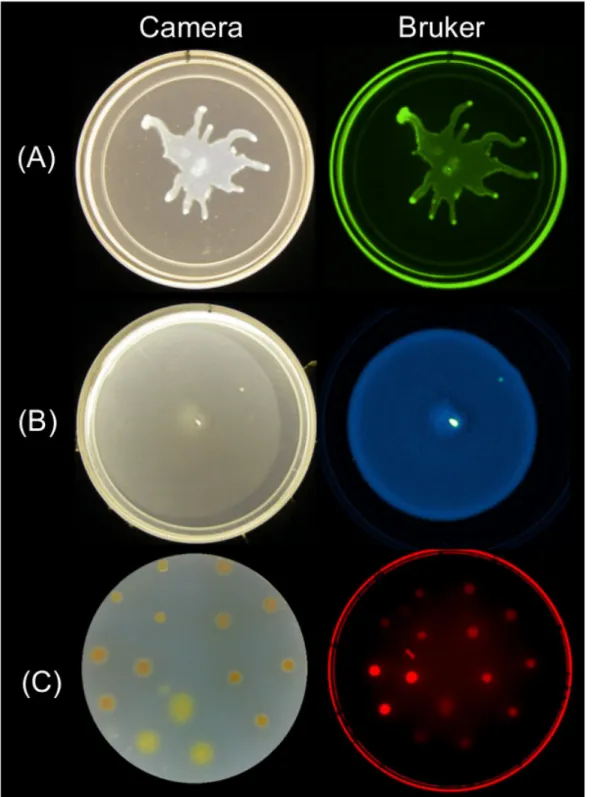
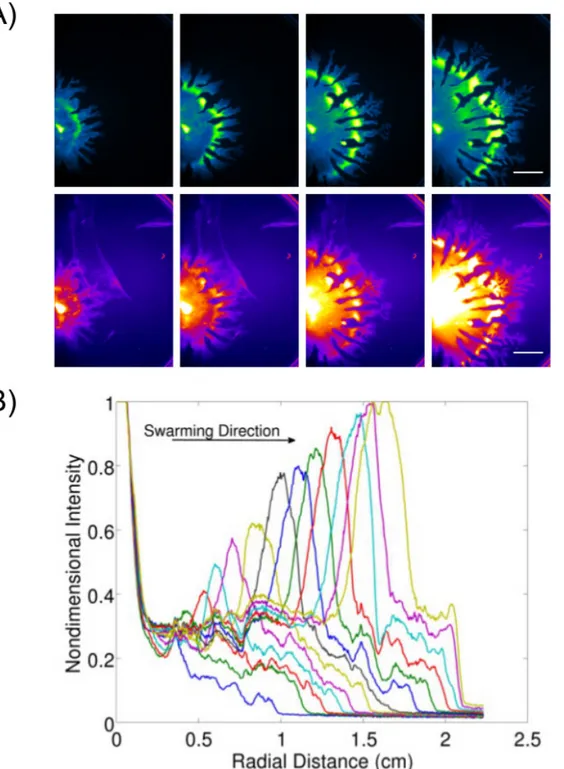
Quantifiable data can be obtained from endpoint images of surface motility using multiple imaging strategies. Figure 2 shows representative surface growth results for P. aeruginosa swarming and its associated GFP fluorescence image; B. subtilis swarming and its associated bioluminescence image; and Myxococcus xanthus surface growth and the associated red fluorescence image of SYTO 64-stained cells. Expansion of data acquisition beyond just inspection and imaging of end-point results allows for the study of dynamic behavior(s) for surface growing bacteria. Figure 37 shows an example of P. aeruginosa swarming (imaged for GFP expressing cells) and its associated rhamnolipid production (imaged using Nile Red lipid stain)—the quantification of data from these images is also displayed to show the expansion rate of
P. aeruginosa swarming. Video 1 shows a time-lapse of B. subtilis swarming imaged using luminescence of a lux-expressing strain. Video 28 shows a time-lapse of P. aeruginosa (green—expressing GFP) and Salmonella enterica serovar Typhimurium (red—expressing lux) in a competitive swarm assay.
Figure 1: Examples of factors in surface motility assay preparation that affect assay outcome. Effect of (A) agar drying time on agar surface moisture and spreading of inoculum for B. subtilis (Ref8), (B) agar drying time on P. aeruginosa swarming (Reprinted from Ref5 with permission), and (C) presence or absence of ammonium sulfate on P. aeruginosa swarming and tendril formation.
Figure 2: Alternative approaches for imaging surface growth and motility of bacteria using a Bruker imaging station. Side by side image of a camera (left) and Bruker image (right) showing (A) P. aeruginosa expressing GFP—imaged using Green Fluorescence settings, (B) B.
subtilis expressing lux bioluminescence reporter—imaged using Luminescence settings, and (C) M. xanthus stained with SYTO 64—imaged using Red Fluorescence II settings. See Table 2 for setting details.
Figure 3: Qualitative and quantitative analysis of a surface motility assay. (A) Time-lapse analysis of cell density distribution, rhamnolipid production (Nile Red lipid stain imaged using the Red Fluorescence I settings; scale bar = 15 mm), and (B) quantification of the of expansion rate from cell density distribution images of a P. aeruginosa swarm. (Reprinted from Ref6 with permission.)
Video 1. Time-lapse imaging of a B. subtilis swarm. B. subtilis expressing lux and recorded using the Luminescence settings. See Table 2 for
setting details.
Video 2. Interspecies competition visualized by time-lapse imaging. Swarms of P. aeruginosa (green; expressing GFP and recorded using
the Green Fluorescence settings) and S. enterica serovar Typhimurium (red; expressing lux and recorded using the Luminescence settings). See Table 2 for setting details. (Reprint with permission from Ref7.)
P. aeruginosa P. aeruginosa tendril
formation studies B. subtilis M. xanthus
Overnight broth culture
Overnight broth culture
incubation temperature 37 °C 37 °C 37 °C 30 hr at 30 °C
Swarm media FAB FAB minus (NH4)2SO4 2% (wt/vol) LB CTT
Swarm media: additional
components 12 mM Glucose
a 10% (wt/vol) CAA, 12 mM
Glucosea
n/a SYTO® 64a
Agar type Agar, Noble Agar, Noble Granulated agar Agar, Noble Affymetrix
Agar concentration (wt/vol) 0.45% 0.45% 0.60% 1.50%
Swarm plate size 60 mm 60 mm 100 mm 150 mm
Media volume per plate 7.5 ml 7.5 ml Hand Poured Hand Poured
Swarm media setting/drying
method Hood; plates uncovered Hood; plates uncovered Benchtop; plates covered Benchtop; plates covered Swarm media setting/drying
time 30 min 30 min Overnight (20 -24 hr) Overnight (20 -24 hr)
Swarm assay incubation
temperature 30 or 37 °C 30 °C 37 °C 30 °C
Incubation for time lapse
imaging 30 °C for at least 4 hr 30 °C for at least 4 hr 37 °C for 2 hr RT for 12 hr
Time-lapse capture length 24 hr 24 hr 10 hr 66 hr
Time-lapse setting 1 frame/10 min 1 frame/10 min 1 frame/6 min 1 frame/10 min
aAdded after autoclaving.
Table 1: Specifications for Surface Motility Assay Preparation. Includes surface motility assay preparation specifications for P. aeruginosa,
B. subtilis, and M. xanthus.
Signal Green Fluorescence Red Fluorescence I Red Fluorescence II Luminescence
Protein or dye Green Fluorescence
Protein (GFP) mCherry protein or Nile Redrhamnolipid stain SYTO® 64 Luciferase from lux operon
Excitation wavelength (nm) 480 ± 10 540 ± 10 590 ± 10 Off
Emission wavelength (nm) 535 ± 17.5 600 ± 17.5 670 ± 17.5 No filter
Exposure time (sec) 30 60 60 240
f-stop 4.0 4.0 2.5 1.1
FOV (mm) 190 190 140 120
Focal plane (mm) 27.5 27.5 12.2 4
Binning (pixels) None 2 x 2 None 8 x 8
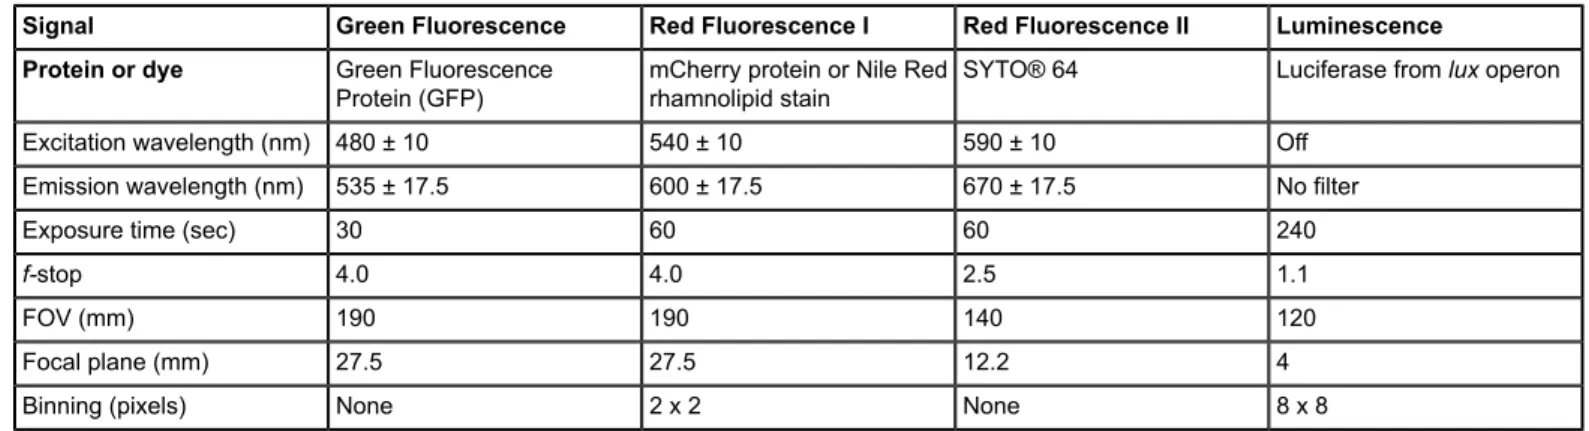
Table 2: Imaging Specification. Bruker imaging station specifications for red and green fluorescence, and luminescence imaging of bacterial surface growth.
Discussion
Achieving reproducible swarming in a laboratory can be challenging, as swarm assays are highly sensitive to environmental factors, such as humidity and available nutrients. The most critical aspect of a surface motility plate assay is moisture on the agar surface. Prior to inoculation, swarm media must be dry enough to prevent bacterial cells from swimming across the surface liquid, but not so dry as to inhibit swarming motility5. Incubation should take place in a sufficiently humid environment: too little moisture can result in the assay drying out during incubation, while too much moisture can lead to artificial or artifactual surface spreading. Unless a humidity-controlled incubator is at hand, incubator and laboratory humidity can vary dramatically. Consequently, an additional water reservoir, a humidifier, or a dehumidifier within the incubator might be required to prevent over drying or the accumulation of excess moisture while keeping the relative humidity near 80%. Maintaining this ideal humidity may prove challenging if seasonal humidity changes are significant. If this is the case, the swarm assay protocol will require some adjustments to account for seasonal changes in humidity. We have found that modifying the swarm media drying time is the simplest way to adjust for seasonal humidity changes. Constant humidity monitoring, both inside and outside of the incubator, is recommended. Further, it is recommended that researchers calibrate and validate their instruments, incubators, scales, etc. as minor errors in temperature, volume or amounts of media components can impact reproducibility of these assays.
It should also be noted that the type and size of the plate used in the assay can affect plate moisture, and thus swarming. Airtight plates do not vent off excess moisture, thus encouraging swimming motility. In contrast, open-faced plates allow too much moisture to escape. A Petri dish provides an ideal environment because it vents off enough excess moisture to prevent liquid build up, but retains enough moisture to prevent the media from drying out. This method details a surface motility assay protocol that allows for high quality imaging. To keep the agar clear for
imaging 60 mm diameter dishes are filled with 7.5 ml of agar media. If detailed imaging is not required, volumes up to 20 ml can also provide reproducible results.
While swarming motility can be achieved on a wide array of agar concentrations, the optimal range of agar required for swarming depends on the species. Overall, higher agar concentrations inhibit swarming motility, and consequently the time needed to produce an image-ready swarm increases. P. aeruginosa generally swarms on agar concentrations between 0.4-0.7%1, however we find that optimal swarming occurs in a much narrower range (0.4-0.5%). Others, such as B. subtilis and S. enterica swarm at 0.6% agar, and Vibrio parahaemolyticus at 1.5% agar10. The required agar concentration is also determined by the type and brand of agar. Higher purity agars, like Noble agar, strongly enhance swarming in
P. aeruginosa and are preferred over granulated agar13,14. However, these purified versions of agar are also more prone to caramelization during the autoclave sterilization cycle; depending on the instrument, a shortened/modified sterilization sequence (to possibly alter the exhaust cycle to prevent prolonged heat exposure) may be required to prepare swarm media using Noble agar.
Media composition also plays a role in the observed swarm phenotype3. P. aeruginosa swarming motility studies are usually performed using minimal nutrient media. We prefer FAB medium4,8 (Materials Table), but other media, such as M9, LB, or slight variations to these common media, have been used successfully9,15,16. Tendril formation is best achieved on FAB minimal medium supplemented with glucose as the carbon source and casamino acids (CAA), but without an additional nitrogen source (i.e., (NH4)2SO4)6,13. If tendril formation or morphology is not the main focus of the study, then FAB minimal medium (Materials Table; Table 1) devoid of CAA is recommended so that the effects of specific carbon sources and/or additional nutrients can be studied in detail. Other species, such as B. subtilis (presented here), are versatile swarmers, capable of swarming on LB and granulated agar. These species swarm readily, requiring only ~10 hr to develop a full swarm. This fast swarming rate makes following the progression of the swarm potentially difficult but our protocol makes such tracking very feasible. The ability to perform swarm time-lapse imaging provides a substantial ease in swarm data acquisition, particularly from such avid swarmers.
We introduce a robust, comprehensive, two-phase protocol and guidelines aimed at enhancing the execution and reproducibility of bacterial surface motility research and have primarily emphasized aspects important to examine flagellar-mediated swarming. This swarm assay protocol details important aspects of media composition and handling of surface motility plates to provide for greater consistency and reproducibility within and among research groups. This will improve the basis of comparison among different research studies. In addition, the presented approach and protocol provides means to make research on swarming and surface motility less susceptible to environmental variations by making researchers aware that such factors affect their work and providing possible solutions (e.g., how small changes in agar affect swarming4,5). Furthermore, the protocol provided to quantify macroscopic aspects of swarming, provides an opportunity to measure many attributes of bacterial surface growth that were previously unquantifiable.
We have not examined all surface motile bacteria in the development of this protocol. As such, it is expected that protocol modifications will be required for species not presented here. The efficiency of this protocol is restricted by the inherent limits of the equipment and materials employed. For instance, temperature related studies are not possible as yet with the Bruker imaging station, since temperature control is not a feature of the equipment. In addition, the use of dyes (such as Nile Red to stain rhamnolipids) can have kinetic and concentration limitations8. This technique strongly relies on the processing and analysis of digital images; improved automation of data analysis (e.g., using additional Macros script function in ImageJ) would reduce the time needed for analysis and expand the usefulness of the data. Finally, due to the robustness of the imaging protocol, future applications should aim at expanding this technique to examine less uniform growth surfaces that are more relevant to surfaces colonized by environmental and pathogenic bacteria.
Disclosures
Publication fees for this article were partially sponsored by Bruker Corporation.
Acknowledgements
Partial support for this work was provided by the National Institute of Health (R01GM100470 and 1R01GM095959-01A1; to MA and JDS) and a Core Facility grant from the Indiana Clinical and Translational Sciences Institute (funded in part by NIH grant #UL1 TR000006; to JDS).
References
1. Kearns, D. B. A field guide to bacterial swarming motility. Nature Reviews: Microbiology. 8, (9), 634-644 (2010).
2. Burall, L. S., et al. et al.Proteus mirabilis. genes that contribute to pathogenesis of urinary tract infection: Identification of 25 signature-tagged mutants attenuated at least 100-fold. Infection and Immunity. 72, (5), 2922-2938 (2004).
3. Shrout, J. D., et al. The impact of quorum sensing and swarming motility on Pseudomonas aeruginosa. biofilm formation is nutritionally conditional. Mol Microbiol. 62, (5), 1264-1277 (2006).
4. Kamatkar, N. G., Shrout, J. D. Surface hardness impairment of quorum sensing and swarming for Pseudomonas aeruginosa. PLoS One. 6, (6), e20888 (2011).
5. Tremblay, J., Déziel, E. Improving the reproducibility of Pseudomonas aeruginosa. swarming motility assays. Journal of Basic Microbiology. 48, (6), 509-515 (2008).
6. Caiazza, N. C., Shanks, R. M., O'Toole, G. A. Rhamnolipids modulate swarming motility patterns of Pseudomonas aeruginosa. Journal of
Bacteriology. 187, (21), 7351-7361 (2005).
7. Du, H., et al. High density waves of the bacterium Pseudomonas aeruginosa. in propagating swarms result in efficient colonization of surfaces. Biophysical Journal. 103, (3), 601-609 (2012).
8. Morris, J. D., et al. Imaging and analysis of Pseudomonas aeruginosa. swarming and rhamnolipid production. Appl Environ Microbiol. 77, (23), 8310-8317 (2011).
9. Tremblay, J., Richardson, A. P., Lépine, F., Déziel, E. Self-produced extracellular stimuli modulate the Pseudomonas aeruginosa. swarming motility behaviour. Environmental Microbiology. 9, (10), 2622-2630 (2007).
10. Partridge, J. D., Harshey, R. M. Swarming: flexible roaming plans. J Bacteriol. 195, (5), 909-918 (2013).
11. Patrick, J. E., Kearns, D. B. Laboratory strains of Bacillus subtilis .do not exhibit swarming motility. Journal of Bacteriology. 191, (22), 7129-7133 (2009).
12. Molecular Imaging. Bruker Corporation Available from: http://www.bruker.com/service/support-upgrades/software-downloads/molecular-imaging.html (2014).
13. Harshey, R. M., Matsuyama, T. Dimorphic transition in Escherichia coli. and Salmonella typhimurium.: surface-induced differentiation into hyperflagellate swarmer cells. Proceedings of the National Academy of Sciences, USA. 91, (18), 8631-8635 (1994).
14. Rashid, M. H., Kornberg, A. Inorganic polyphosphate is needed for swimming, swarming, and twitching motilities of Pseudomonas aeruginosa. Proc Nat Acad Sci U.S.A.. 97, (9), 4885-4890 (2000).
15. Caiazza, N. C., Merritt, J. H., Brothers, K. M., O'Toole, G. A. Inverse regulation of biofilm formation and swarming motility by Pseudomonas aeruginosa. PA14. Journal of Bacteriology. 189, (9), 3603-3612 (2007).
16. Kuchma, S. L., et al. Cyclic-di-GMP-mediated repression of swarming motility by Pseudomonas aeruginosa.: the pilY1. gene and its impact on surface-associated behaviors. J Bacteriol. 192, (12), 2950-2964 (2010).