Science Arts & Métiers (SAM)
is an open access repository that collects the work of Arts et Métiers Institute of Technology researchers and makes it freely available over the web where possible.
This is an author-deposited version published in: https://sam.ensam.eu Handle ID: .http://hdl.handle.net/10985/8941
To cite this version :
Daniel BELLETT, Etienne PESSARD, Franck MOREL - A flexible HCF modeling framework leading to a probabilistic multiaxial Kitagawa-Takahashi diagram - In: International Fatigue Conference (11; Melbourne; 2014), Australia, 2014-03-03 - Fatigue 2014 : 11th International Fatigue Conference - 2014
Any correspondence concerning this service should be sent to the repository Administrator : [email protected]
A flexible HCF modeling framework leading to a probabilistic multiaxial
Kitagawa-Takahashi diagram
Daniel Bellett
1,a *, Etienne Pessard
1,band Franck Morel
1,c1 Laboratoire LAMPA, Arts et Métiers ParisTech, 2 Bd du Ronceray, 49035 Angers Cedex 01, FRANCE
a[email protected], b[email protected], c[email protected] * Corresponding author
Keywords: high cycle fatigue, Kitagawa-Takahashi diagram, cast aluminum alloys, probability,
defects.
Abstract. This article describes a flexible modeling framework which leads to the construction of a
probabilistic, multiaxial Kitagawa-Takahashi diagram. This framework has been developed following experimental observations that clearly indicate that two independent fatigue damage mechanisms can be activated, at the same time, in metallic materials. Specifically, one damage mechanism is associated with crack initiation and the other with crack arrest. It is postulated that these damage mechanisms are more appropriately modeled using two different fatigue criteria or, more specifically, two completely different approaches to fatigue (i.e. a classical multiaxial fatigue criterion and a LEFM type criterion). Hence, the proposed modeling framework provides the possibility of combining any two suitable criteria, in a probabilistic framework based on the weakest link hypothesis and results in the continuous description of the Kitagawa diagram for any multiaxial stress state. It is shown that under certain conditions this approach is equivalent to the classical El Haddad approach to the short crack problem encountered in LEFM. However, the proposed framework is easily extended to multiaxial loading conditions. This modeling framework is demonstrated in detail via its application to multiaxial fatigue data for data taken from the literature.
Introduction
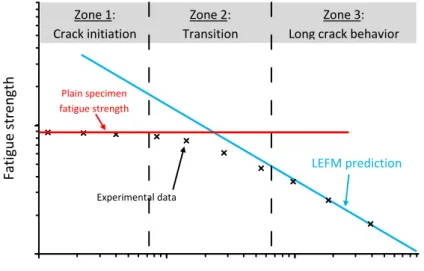
The Kitagawa-Takahashi diagram [1], shown schematically in Figure 1, is an extremely important contribution to the study of the high cycle fatigue behavior of metallic materials, as it represents many important concepts. In particular, the Kitagawa-Takahashi diagram:
a) highlights the difference in terms of the fatigue strength of cracked and non-cracked bodies. b) defines the zone of validity for which Linear Elastic Fracture Mechanics (LEFM) predictions
are applicable and allows the classification of cracks as being either long cracks or short cracks. c) can be used to describe the dependence of the plain fatigue strength on the presence of defects
(i.e. cast shrinkage pores, non-metallic inclusions, surface defects, etc.)
d) is generally accepted to represent two distinct fatigue damage mechanisms. That is, one mechanism associated with crack initiation and the other with crack propagation. It also defines the transition between these mechanisms.
The aim of this article is to present a flexible modeling framework in which two co-existing fatigue damage mechanisms can be simultaneously modeled using two different fatigue criteria. A weakest link probabilistic concept is subsequently used to combine the two models. This results in a probabilistic Kitagawa type diagram. This framework was first proposed by Pessard and Morel [2] for the prediction of anisotropic fatigue behavior of forged steels. The basic ingredients of this framework are:
1. The choice of two appropriate fatigue criteria to model the two damage mechanisms.
2. The threshold quantities of both criteria are defined in terms of Weibull distributions. This allows the experimentally observed scatter to be taken into account and associates a probability of failure with each criterion (and damage mechanism).
3. The weakest link hypothesis is then used to determine the total probability of failure due to both damage mechanisms. This leads to a continuous transition between the predictions from the two criteria.
Figure 1 : A schematic representation of the Kitagawa-Takahashi diagram
Description of the probabilistic modeling framework
It is important to realize that any two appropriate fatigue criteria can be used within this framework. It is sufficient to define one criterion to describe the crack initiation damage mechanism (mechanism 1) and another for the crack propagation mechanism (mechanism 2).
Modeling of mechanism 1. This section is devoted to the modeling of the crack initiation
damage mechanism (mechanism 1). Many modeling approaches have been proposed to determine the possibility of crack initiation. Table 1 summarizes several high cycle fatigue criteria that can be used in the proposed framework.
As a general rule most fatigue criteria can be defined by an equivalent mechanical quantity (i.e. stress, strain, energy, etc.), which is compared to a threshold quantity, for a given number of cycles. Crack initiation is subsequently predicted if the equivalent quantity is greater than or equal to the threshold quantity (see Eq. (1)). In the following, for convenience, these will be referred to stress quantities. Hence, the condition for crack initiation is defined by: 𝜎𝜎𝑒𝑒𝑞𝑞 ≥ 𝜎𝜎𝑡𝑡ℎ
In order to take into account the inherent stochastic nature of the fatigue phenomenon it is proposed, as part of the modeling framework, to use a two parameter Weibull distribution [3][4] to describe the threshold stress. In this work the Weibull distribution is used because it is easily applicable to the weakest link theory. This choice then makes it possible to define the probability of crack initiation within a grain. Eq. (2) shows the probability density function used to define the threshold stress. 𝑓𝑓01(𝜎𝜎𝑡𝑡ℎ) =𝜎𝜎𝑚𝑚𝑡𝑡ℎ011 �𝜎𝜎𝜎𝜎𝑡𝑡ℎ01𝑡𝑡ℎ � 𝑚𝑚1−1 exp � 𝜎𝜎𝑡𝑡ℎ 𝜎𝜎𝑡𝑡ℎ01� 𝑚𝑚1 (2) where 𝜎𝜎𝑡𝑡ℎ01 is the scale parameter and m1 is the shape parameter (or the Weibull exponent) used
to reflect the scatter associated with the threshold stress and by consequence the scatter associated with the fatigue damage mechanism. The probability of microcrack initiation in a grain corresponds to the probability of finding a grain with a threshold stress 𝜎𝜎𝑡𝑡ℎ that is less than the applied equivalent stress 𝜎𝜎𝑒𝑒𝑞𝑞. This can be expressed as:
𝑃𝑃𝐹𝐹01�𝜎𝜎𝑡𝑡ℎ < 𝜎𝜎𝑒𝑒𝑞𝑞� = ∫ 𝑓𝑓0𝜎𝜎𝑒𝑒𝑒𝑒 01(𝜎𝜎𝑡𝑡ℎ) 𝑑𝑑𝜎𝜎𝑡𝑡ℎ (3) 𝑃𝑃𝐹𝐹01 = 1 − exp �− �𝜎𝜎𝜎𝜎𝑡𝑡ℎ01𝑒𝑒𝑒𝑒 � m1 � (4) LEFM prediction Plain specimen fatigue strength Crack size, a Fa tig ue str en gth Zone 1: Crack initiation Zone 3: Long crack behavior Zone 2:
Transition
Table 1 : Stress amplitude criterion and three well known fatigue criteria divided into equivalent and threshold parts
Criterion Equivalent quantity, 𝜎𝜎𝑒𝑒𝑞𝑞 Threshold quantity, 𝜎𝜎𝑡𝑡ℎ
Stress amplitude 𝜎𝜎𝐼𝐼,𝑎𝑎 𝑠𝑠−1
Fatemi-socie [5] ∆𝛾𝛾 �1 + 𝑘𝑘𝐹𝐹𝐹𝐹𝜎𝜎𝑛𝑛,𝑚𝑚𝑎𝑎𝑚𝑚
𝜎𝜎𝑦𝑦 � 𝛽𝛽𝐹𝐹𝐹𝐹
Crossland [6] �𝐽𝐽2,𝑎𝑎+ 𝑘𝑘𝜎𝜎𝐻𝐻,𝑚𝑚𝑎𝑎𝑚𝑚 𝜆𝜆
Dang Van [7][8] max
𝑛𝑛�⃗ �maxt [𝜏𝜏𝑚𝑚𝑒𝑒𝑚𝑚𝑚𝑚+ 𝛼𝛼𝐷𝐷𝑉𝑉𝜎𝜎𝐻𝐻]� 𝛽𝛽𝐷𝐷𝑉𝑉
In order to obtain the probability of crack initiation for the complete structure 𝑃𝑃𝐹𝐹1, the weakest link theory is used [9]. The probability of survival of the structure (1 − 𝑃𝑃𝐹𝐹1) is defined as the product of the survival probabilities of each elementary volume or surface. In this work it will be assumed that crack initiation is essentially a surface phenomenon, where the quantity 𝑆𝑆01 corresponds to the surface area of an individual surface grain and 𝑆𝑆Ω1 is the total surface area of a specimen. Hence the probability of survival of the complete structure is given by:
1 − 𝑃𝑃𝐹𝐹1 = ∏ �1 − 𝑃𝑃𝐹𝐹Ω1 𝐹𝐹01(𝑀𝑀)� (5)
This then implies that:
𝑃𝑃𝐹𝐹1 = 1 − exp �−𝐹𝐹101∫ �𝜎𝜎𝜎𝜎𝑡𝑡ℎ01𝑒𝑒𝑒𝑒 � 𝑚𝑚1
𝑑𝑑𝑆𝑆
𝐹𝐹Ω1 � (6)
For a uniform surface stress, this expression can be simplified to: 𝑃𝑃𝐹𝐹1 = 1 − exp �−𝐹𝐹𝐹𝐹Ω1 01� 𝜎𝜎𝑒𝑒𝑒𝑒 𝜎𝜎𝑡𝑡ℎ01� 𝑚𝑚1 � (7)
Modeling of mechanism 2. The second fatigue damage mechanism is associated with the
non-propagation (or the arrest) of long cracks. The classical LEFM approach will be used to demonstrate the modeling framework. Although, it should be kept in mind that the framework is not limited to LEFM. Any criterion that predicts the fatigue behavior of long cracks or defects could be used (e.g. Elastic–Plastic Fracture Mechanics or the Murakami criterion [10]). When using the classical LEFM approach it is assumed that crack propagation does not occur if the condition ΔΚ < Δ𝐾𝐾𝑡𝑡ℎ is satisfied. By using a second Weibull distribution to define the scatter associated with the crack propagation threshold Δ𝐾𝐾𝑡𝑡ℎ and by following the same procedure as outlined above, the probability of failure probability, for an entire uniformly loaded specimen, associated with damage mechanism 2 is given by:
𝑃𝑃𝐹𝐹2 = 1 − exp �−𝐹𝐹𝐹𝐹Ω202�Δ𝐾𝐾Δ𝐾𝐾𝑡𝑡ℎ02� 𝑚𝑚2
� (8)
Combining the two damage mechanisms. Finally, the survival probability of an entire
component, due to both damage mechanisms, is equal to the product of the two survival probabilities. Essentially, the weakest link hypothesis is employed once again. This assumes that the two damage mechanisms are independent.
1 − 𝑃𝑃𝐹𝐹 = (1 − 𝑃𝑃𝐹𝐹1)(1 − 𝑃𝑃𝐹𝐹2) (9)
For a uniform surface stress, the total probability of failure can be written as: 𝑃𝑃𝐹𝐹 = 1 − exp �− �𝐹𝐹𝐹𝐹Ω101�𝜎𝜎𝜎𝜎𝑒𝑒𝑒𝑒 𝑡𝑡ℎ01� 𝑚𝑚1 +𝐹𝐹Ω2 𝐹𝐹02� Δ𝐾𝐾 Δ𝐾𝐾𝑡𝑡ℎ02� 𝑚𝑚2 �� (10) This is simply a bimodal Weibull distrubution. As can be seen in Eq. 10 the scale effect is explicitly taken into account via the terms 𝐹𝐹Ω1
𝐹𝐹01 and 𝐹𝐹Ω2
𝐹𝐹02. However, in the following, for reasons of
presented below are for specimens with approximately the same surface area. Eq. 10 can therefore be simplified to: 𝑃𝑃𝐹𝐹 = 1 − exp �− ��𝜎𝜎𝜎𝜎𝑒𝑒𝑒𝑒 𝑡𝑡ℎ01′ � 𝑚𝑚1 + �Δ𝐾𝐾Δ𝐾𝐾 𝑡𝑡ℎ02′ � 𝑚𝑚2 �� (11) where 𝜎𝜎𝑡𝑡ℎ01′ = 𝜎𝜎𝑡𝑡ℎ01�𝐹𝐹01 𝐹𝐹Ω1� 1 𝑚𝑚� 1 and Δ𝐾𝐾𝑡𝑡ℎ02′ = Δ𝐾𝐾𝑡𝑡ℎ02�𝐹𝐹02 𝐹𝐹Ω2� 1 𝑚𝑚� 2
Uniaxial loads and the original Kitagawa–Takahashi diagram. When considering uniaxial
tensile loads, the original Kitagawa–Takahashi diagram can be reproduced by the proposed framework, if the (a) simple stress amplitude criterion and (b) the LEFM criterion are used. This criteria combination is described by the following equations:
𝜎𝜎𝑒𝑒𝑞𝑞= 𝜎𝜎1,𝑎𝑎 ≥ 𝑠𝑠−1 and Δ𝐾𝐾 = 𝑌𝑌2𝜎𝜎1,𝑎𝑎 √𝜋𝜋𝜋𝜋 ≥ Δ𝐾𝐾th (12)
where Y is the crack shape correction factor. If for the sake of simplicity it is assumed that m1 = m1 = m. By substituting Eq. 12 into Eq.
11 the following expression for the fatigue strength as a function of the probability of failure, and the crack length, can be established:
𝜎𝜎1,𝑎𝑎(𝑃𝑃𝐹𝐹, 𝜋𝜋) = � 𝑙𝑙𝑛𝑛�1−𝑃𝑃𝐹𝐹1 � � 1 𝜎𝜎𝑡𝑡ℎ01′ � 𝑚𝑚 +�𝑌𝑌2√𝜋𝜋𝜋𝜋 Δ𝐾𝐾𝑡𝑡ℎ02′ � 𝑚𝑚� 1 𝑚𝑚 (13)
One of the original solutions to the LEFM short crack problem was proposed by El Haddad [11], who introduced the material constant, ao, to describe the Kitagawa–Takahashi diagram. It can be
demonstrated mathematically that the El Haddad approach is a specific case of the proposed probabilistic modeling framework, defined by Eq. 13. The El Haddad equation corresponds to a Weibull exponent of m = 2 and a failure probability of 𝑃𝑃𝐹𝐹 = 0.544.
2𝜎𝜎1,𝑎𝑎(0.544, 𝜋𝜋) = 𝑙𝑙𝑛𝑛� 1 1−0.544� 𝑌𝑌�𝜋𝜋Δ𝐾𝐾𝑡𝑡ℎ02𝜋𝜋+𝜋𝜋𝑜𝑜′ = ∆𝐾𝐾𝑡𝑡ℎ 𝑌𝑌�𝜋𝜋(𝑎𝑎+𝑎𝑎𝑜𝑜) where 𝜋𝜋𝑚𝑚 = 1 𝜋𝜋� ∆𝐾𝐾𝑡𝑡ℎ 2𝑚𝑚−1� 2 (14)
Extension to multiaxial loads. In order to apply the proposed modeling framework to multiaxial
loading conditions, two criteria combinations are investigated: “Crossland & LEFM” and “Crossland and Murakami”. Table 2 summarizes the application of the proposed modeling framework for three different loading conditions: (a) fully reversed uniaxial push–pull loads, (b) fully reversed torsion, and (c) combined in-phase synchronous tension–torsion with 𝜏𝜏 𝜎𝜎⁄ = 1.
Application to multiaxial experimental data for the C35. In the following, two criteria
combinations, summarized in Table 2, are applied to experimental data taken from the literature for the C35 steel. This material is a ferrito-pearlitic, low alloy steel containing 0.35% carbon and has been the subject of many fatigue investigations in the literature [12], [13], [14], [15], [16].
Table 3 summarizes the fatigue data used for this material [12]. Data for both plain specimens (defect size = 0𝜇𝜇𝜇𝜇) and specimens containing artificial hemispherical surface defects of various sizes are considered for three different loading conditions. The data in bold is used to identify the parameters of the proposed modeling framework.
Table 2: Fatigue strength at 1x10⁷ cyc for C35 steel [12]
Defect size (𝜇𝜇𝜇𝜇) Tensile 𝑠𝑠−1 (𝑀𝑀𝑃𝑃𝜋𝜋) Torsion 𝑡𝑡−1 (𝑀𝑀𝑃𝑃𝜋𝜋) Tension-torsion 𝑠𝑠𝑡𝑡−1 (𝑀𝑀𝑃𝑃𝜋𝜋) 0 230 140 185 90 200 140 175 500 150 120 -
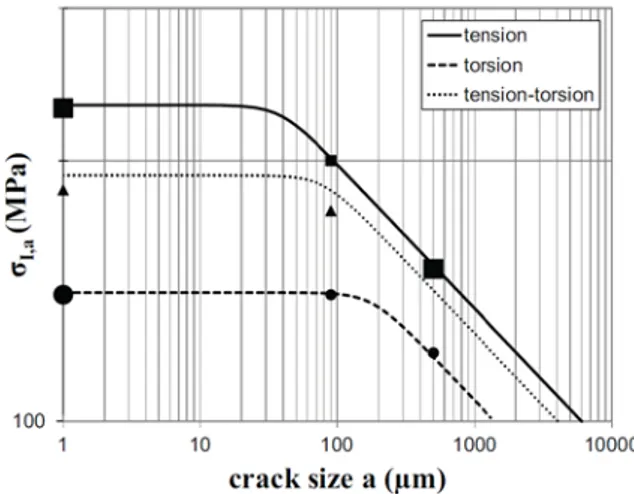
Greater information concerning the identification procedure can be found in reference [17]. Figure 2 shows the predictions of the proposed modeling framework using the equations for the “Crossland & LEFM” criteria combination. The experimental data listed in Table 2 is also shown. It can be seen that in the short crack zone of the diagram the Crossland criterion faithfully predicts the
results for the combined tension–torsion loading condition. However, in the long crack domain, it appears that the LEFM criterion overestimates the fatigue strength. This difference may be due to the fact that the experimental results are for artificial surface defects with a hemispherical shape, and the LEFM criterion makes the assumption that these defects are equivalent to cracks.
Table 3 : Application for the proposed modeling framework, using the “Crossland & LEFM” criteria combination and the “Crossland & Murakami” criteria combination, for three different loading conditions
Figure 3 shows the predictions obtained with the proposed modeling framework, using the “Crossland & Murakami” criteria combination. It can be seen that the predictions, for all three loading conditions, are in very good agreement with the experimental data. The Murakami criterion uses the √𝜋𝜋𝑎𝑎𝑎𝑎𝜋𝜋 parameter (where 𝜋𝜋𝑎𝑎𝑎𝑎𝜋𝜋 is the projected area of a defect on a plane perpendicular to the direction of the maximum principal stress) and the hardness to define the fatigue strength. For multiaxial loads, the extension to the Murakami criterion proposed by Endo and Ishimoto [18] is used.
Figure 2 : Multiaxial Kitagawa-Takahashi type diagram established using the Crossland & LEFM criteria combination, for the C35 steel (PF = 0.5). The large data
points are used for the identification of the model
Figure 3 : Multiaxial Kitagawa-Takahashi type diagram established using the Crossland & Murakami criteria combination, for the C35 steel (PF =0.5). The large data
points are used for the identification of the model
Conclusion
The principal conclusions of this work can be summarized as follows:
• The proposed modeling framework is a flexible way of taking into account two coexisting fatigue damage mechanisms via the combination of two appropriate high cycle fatigue criteria.
One criterion to model crack initiation damage and a second for crack propagation (or crack arrest).
• The proposed modeling framework can be used to establish probabilistic Kitagawa–Takahashi type diagrams that have a mechanistic basis and are able to realistically reflect the experimentally observed scatter associated with the damage mechanisms.
• The proposed modeling framework makes it possible to generate probabilistic Kitagawa– Takahashi type diagrams for multiaxial loading conditions, if appropriate multiaxial criteria are used.
• When the classical LEFM criterion is used in this framework the short crack problem is circumvented or avoided. It is assumed that short cracks fall into the transition region of the Kitagawa–Takahashi diagram.
References
[1] H. Kitagawa, S. Takahashi, Applicability of fracture mechanics to very small cracks. In: ASM Proceedings of 2nd international conference on mechanical behaviour of materials, Metalspark, Ohio, (1976), pp. 62731
[2] E. Pessard, F. Morel, A. Morel, The anisotropic fatigue behavior of forged steel, Adv Engng Mater (2009), 11, pp.732–5
[3] W. Weibull, A statistical theory of the strength of materials, Roy Swed Inst Engng Res Report (1939), 151
[4] W. Weibull, A statistical distribution function of wide applicability, ASME J Appl Mech (1951), 18, pp.293–7
[5] A. Fatemi, D.F. Socie, Critical plane approach to multiaxial fatigue damage including out-of-phase loading. Fatigue Fract Engng Mater Struct (1988), 11–3, pp. 149–65
[6] B. Crossland, Effect of large hydrostatic pressures on the torsional fatigue strength of an alloy steel. In: Int conf on fatigue of metals, London (1956)
[7] K. Dang Van, Sur la résistance á la fatigue des métau,. Sci Tech Armement, (1973) 47
[8] E. Charkaluk, A. Constantinescu, H. Matournam, K. Dang Van, Revisiting the Dang Van criterion. Proc Engng, (2009), 1–1, pp. 143–6
[9] A.M. Freudenthal, In: H. Liebowitz, editor. Fracture, vol. 2, New York: Academic Press, (1968), pp. 591–619
[10] Y. Murakami, Metal fatigue: effects of small defects and non-metallic inclusion, London, Elsevier, (2002)
[11] M.H. El Haddad, T.H. Topper, K.N. Smith, Prediction of non propagating cracks, Engng Fract Mech, (1979), 11, pp.573–84
[12] A.J. McEvily, M. Endo, S. Ishihara, The influence of biaxial stress on the fatigue behaviour of defect-containing steels. ICF1, (2005)
[13] T. Billaudeau, Y. Nadot, G. Bezine, Multiaxial fatigue limit for defective materials: mechanisms and experiments, Acta Materialia, (2004), vol 52, pp. 3911-3920
[14] Y. Nadot, T. Billaudeau, Multiaxial fatigue limit criterion for defective materials, Engineering Fracture Mechanics, (2006), vol. 73-1, pp. 112-133
[15] L. Flaceliere, F. Morel, A. Dragon, Competition between mesoplasticity and damage under HCF Elasticity/damage shakedown concept, Int J Fatigue, (2007), vol. 29, pp. 2281-2297
[16] F. Morel and N. Huyen, Plasticity and damage heterogeneity in fatigue, Theoretical and Applied Fracture Mechanics, (2008), vol. 49-1, pp. 98-127
[17] E. Pessard, D. Bellett, F. Morel, I. Koutiri, A mechanistic approach to the Kitagawa-Takahashi diagram using a multiaxial probabilistic framework, Eng Fract Mech, 109, (2013), pp. 89-104 [18] M. Endo, I. Ishimoto, The fatigue strength of steels containing small holes under out-of-phase