READ THESE TERMS AND CONDITIONS CAREFULLY BEFORE USING THIS WEBSITE. https://nrc-publications.canada.ca/eng/copyright
Vous avez des questions? Nous pouvons vous aider. Pour communiquer directement avec un auteur, consultez la première page de la revue dans laquelle son article a été publié afin de trouver ses coordonnées. Si vous n’arrivez pas à les repérer, communiquez avec nous à [email protected].
Questions? Contact the NRC Publications Archive team at
[email protected]. If you wish to email the authors directly, please see the first page of the publication for their contact information.
NRC Publications Archive
Archives des publications du CNRC
This publication could be one of several versions: author’s original, accepted manuscript or the publisher’s version. / La version de cette publication peut être l’une des suivantes : la version prépublication de l’auteur, la version acceptée du manuscrit ou la version de l’éditeur.
Access and use of this website and the material on it are subject to the Terms and Conditions set forth at
Glass transitions in polymeric roofing membranes : determination by
dynamic mechanical analysis
Dutt, O.; Paroli, R. M.; Mailvaganam, N. P.; Turenne, R. G.
https://publications-cnrc.canada.ca/fra/droits
L’accès à ce site Web et l’utilisation de son contenu sont assujettis aux conditions présentées dans le site LISEZ CES CONDITIONS ATTENTIVEMENT AVANT D’UTILISER CE SITE WEB.
NRC Publications Record / Notice d'Archives des publications de CNRC:
https://nrc-publications.canada.ca/eng/view/object/?id=13b61bd0-0a73-41e5-bd97-7802b1e7ceea https://publications-cnrc.canada.ca/fra/voir/objet/?id=13b61bd0-0a73-41e5-bd97-7802b1e7ceea1991 International Symposium on Roofing 1echno1ogy 495
GLASS TRANSITIONS IN POLYMERIC
ROOFING MEMBRANES-DETERMINATION
BY DYNAMIC
MECHANICAL ANALYSIS
0.
DUTT, R. M. PAROIJ and N. P. MAILVAGANAM
National Research Council of Canada
Institute for Research in Construction
Ottawa, Ontario, Canada
..
.
R.G.TURENNE
Public Works Canada
\
Ottawa, Ontario, Canada
hree EPDM roofing membranes were studied before and after accelerated ageing using dynamic mechanical analy-sis and tensile testing. It was found that the glass transition temperature, Tg, can be used to explain the changes in mechanical properties of roofing membranes. Furthermore, the Tg values can easily be obtained using dynamic mechan-ical analysis. Lastly, it was shown that accelerating ageing at elevated temperatures can reduce the time required to evaluate the effect of. heat on mechanical properties of ーッャケュ・イM「。セ・、 materials.
KEYWORDS
DMA, dynamic mechanical analysis, elastomers, EPDM, glass transition temperature (Tg), roofing membranes, thermal analysis.
INTRODUCTION
Polymeric roofing membranes are evaluated using various test methods developed for the assessment of durability. Mechanical properties of polymeric materials have two facets; o.ne is related to the macroscopic behavior and the other,tothe molecular behavior which includes chemical compositibn and physical structure. For engineering appli-cations the description of mechanical behavior under the design conditions is generally all that is required. Accord-ingly, the information obtained from these tests does not explain why a material has failed and how it can be im· proved, unless the failure is related to structural strength. If the failure is related to molecular activity, additional in· formation is necessary to comprehend the problem fully. Thermal analysis is a technique that can provide some in-sight as to why some roofing materials fail more prematurely than others. Dynamic mechanical analysis (DMA or DMTA) can be used routinely to determine various properties of a roofing membrane, for example, the glass transition tem-perature. DMA instruments usually employ forced vibration conditions to deform a sample and study its viscoelastic response. Since the instruments have the capability of not only varying the applied frequency but also the tempera-ture, DMA falls under the broad terminology of thermal analysis.
THEORKnCALCONSIDERATIONS
In the work reported here, three ethylene·propylene.diene monomer (EPDM) based roofing membranes were studied, before and after accelerated ageing, using dynamic mechan· ical thermal analysis (DMA).
Gla•• Thansition Thmperature (Tg)'"
The glass transition temperature (Tg) is a property of a poly-mer and is defined as the temperature at which the poly' mer goes from a rubbery to a glassy state without any change . in phase (I.e., local molecular motion is hindered). Below this temperature, polymeric materials undergo considera-ble changes in their physical properties, becoming stiff in· stead of flexible. Apart from hardness and brittleness, other properties that are affected by the TKare thermal expan· sion coefficients, heat capacity and dielectric constants.
An amorphous (or non.crystalline) polymer has the fol· lowing molecular motions, in order· of decreasing activation energies, hence, requiring less thermal energy to occur:' (I) Translational motion of all the molecules which allows
a polymer to flow.
(2) Twisting, turning andjumping in unison of i>arts of a molecule up to 50 carbon atoms in length. This allows bending and coiling.
(3) Motion of five or six atoms along the main chain or of the side groups.
(4) Vibrations of atoms around their equilibrium position similar to that found in a crystal lattice. The difference between a crystal lattice and an amorphous polymer is that in the polymer the atomic centers are in an irregu· lar arrangement.
It is believed that only motions (1) and (2) are either res-trained or frozen below the Tg' The remaining energy in a molecule would then be motIOns (3) and (4) that would in turn become restrained atlow temperatures.as in non· polymeric materials.
The glass transition temperature depends on five factors: (1) Free volume-the volume of polymer mass not occupied by the molecules themselves. If the molecules are tight· Iy packed and have little room to move, they need a lot of energy or a higher temperature to mOVe.
496 1991 International Symposium on Roofing Thchnology
(2) Attractive forces 「・エキ・・ョュッャセャ・ウMエゥァィエャケ bound molecules need more thermal energy to produce mo-tion which in .turn increases Tg.
(3) Rotation sbout bonds-steric hindrance prevents mo-tion, so that more energy is needed for rotation to oc-cur, again resulting in a higher Tg.
(4) Stiffness of chain-more or less similar to (3), in that if a chain of molecules needs more energy to bend or twist, a higher Tg is required for the motion to occur. (5) Chain length-the chain length of molecules affects their motion which affects the Tg. Plasticizers soften a polymer by interfering With the cliain motions. Further-more, the plasticizer forms secondary bonds with the polymer thereby reducing the bonding forces between the polymer chains.
A rough approximation of the relationship between the glass transition temperature, Tg, and the melting point, Tm, is as follows:
For polymers with a symmetrical repeating unit, e.g., PVC, -[CH...CCI.]x-, Tg '" 0.5Tm, and with an unsymmetrical repeating unit, e.g., PP, -[CH.-CHCH,lx-, Tg '" 0.67Tm. In all cases, Tg is less than Tm.
All of the above applies to polymers that are not cross· linked or only slightly crosslinked. However; ifthere is a high degree of cr()sslinking, the alignment of the chains in a crys· tal lattice js prevented an.d crystallization does not occur. Crosslinking hinders chain mobility and thus increases the apparent Tg. If the crosslinks occur more frequently than every 40 main chain atoms, the type of motion necessary to reach the rubbery state will, in general, not .be attained and the polymer decomposes priortotァNfッセ ・ク。ューャ・LウーャセエN
ting of PVC membrane could be attributed to thiS phenomenon.
Generally, the strength of polymeric materials above the glass transition temperature is inferior to the strength be-low Tg. Even in the glassy state, however, the strength of an amorphous polymeric material is less than that 9f orient-ed crystalline polymers.
There are various techniques that can be used to deter-mine glass transition temperatures. The static techniques in-clude differential scanning calorimetry (DSC), and differential thermal analysis (DTA), which are beyond the scope of this paper. The dynamic methods include torsion-al braid antorsion-alysis (TBA) and dynamic mechanictorsion-al antorsion-alysis (DMA).
Description of DMA
'-11
The stress-strain relationship which is measured by DMA can be described by the following sinusoidal equations (see Figure I):
a = aD sin (wt +0) (I)
a = aD sin (wt) cos 0
+
aD cos (wt) sin a (la) whereais the stress,wis the angular frequency, t is the time and 0 is the phase angle. The strain«)
can be obtained by:<= <0 sin (wt) (2)
The stress and strain components can be either in'phase or 90° out-of·phase with each other. When stress is in'phase with strain, the component is labelled as "real" With an as-sociated value 'ofaocoso. The "imaginary" component is 90° out·of-phase with strain and corresponds toaDsin
o.
Byresolving the stress and strain components, a real and im-aginary component of modulus can be obtained:
a =<0 E'sin (wt)
+
<0 En cos (wt) (3)where the real part of the modulus,E', is defined as E'
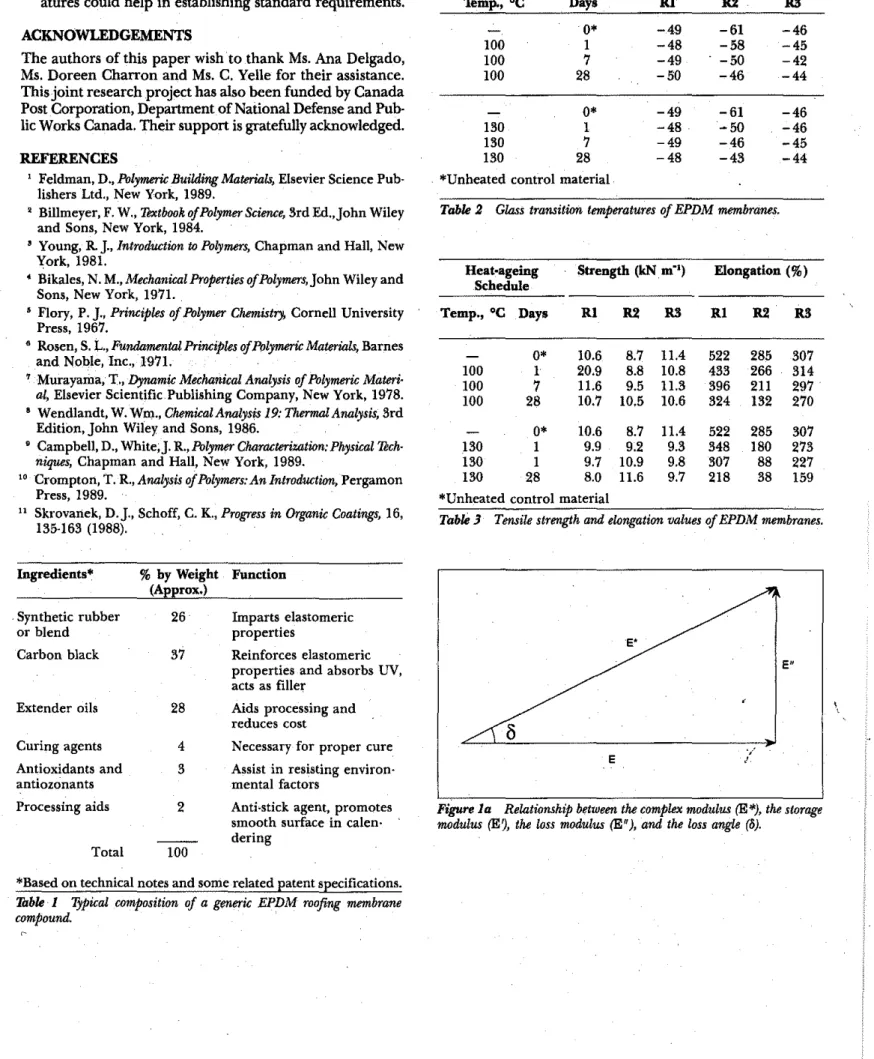
= (ao/<o)cos 0 and is known as the storage modulus which is a measure of recoverable strain energy in a deformed body since it is related to the storage of energy in the form of . potential energy. TheJmaginary component of the modu-lus En is defined as En '= (ao/<o)sin 0, where En is the loss modulus and is associated with the description ofenergy as heat due to the deformation of the material. Finally, the ratio En IE' yieldS the loss tangent or damping factor (tan 0) which is the ratio of energy lost per cycle to the maxi-mum energy stored and therefore recovered, per cycle.
The dynamic mechanical analysis curve shows E' andlor En and/or tan 0 plotted as a function of time or tempera-ture. In general, the most intense peak observed for either En or tan 0 (and Significant inflection for E) corresponds
tothe glass transition and is labelled as the a-transition. The a-transition is therefore associated with motion along the main chain of the polymer that has almost no movement below the glass transition temperature.
As
soon as a poly-mer is supplied with sufficient thermal energy, the various segments of the polymer begin to move, releasing heat. The intensity of the a-peak varies depending on the polymer type; amorphous polymers have a more intense a-peak than semi-crystalline polymers because the former have more freedom of movement than the latter.Itis important to note that the Tg determined by DMA is not only heating·rate de· pendent but also frequency、・ー・セ、・ョエN Th.erefore, Tgカセャオ・ウ obtained by DMA are generally different from that obtamed by static techniques such as differential scanning calorime-try (DSC).Other transitions can be observed below Tg./3-transitions arise from the motion of flexible side chains of polymers with short branches.
r,
O-transitions, etc., are generally duetomain chain motion of segments containing four carbons or less. The magnitude of /3-,'Y-, 0-,etc., transitions is less than that of a-transitions since they involve smaller segments of the polymer than with the a-transition. '
The temperature of a polymer can also be increased by subjecting the material to high frequency and high ampli-tude oscillations. It is therefore of paramount importance that when studying dynamic mechanicalーイッー・イエゥセウL low fre· quencies and low strain amplitudes be used. Low strain am-plitude is associated With the linear region of a stress-strain curVe but if a large stress or strain amplitude is allplied to a viscoelastic material, high internal heat due to molecular vibration is generated. This high internal heat yields anon-linear viscoelastic response that is quite complex to analyze. Furthermore, in nonlinear viscoelastic regions the material is permanently modified, for example; microscopic crack formation or failure due to fatigue can result.
Various sources of errors do exist in DMA depending on the type of clamp used.It is for this reason that absolut.e modulus values are obtained with great difficulty using this technique_ Ifcare is taken, results within a given laboratory can be reproducible, hence comparison amongst various , materials is feasible. Although DMA is weak with respect to the accuracy of absolute modulus, the transition tempera-tures can routinely be determined with great accuracy. It
\
is important to note, however, that the method used to ob-tain the temperature of transition affects the value. Thus it is vital to specify whether the Tg was obtained using
エィセ
loss modulus or the damping factor. As long as the same parameter is used throughout a study, the trend observed will be the same regardless of the parameter used. EXPERIMENTALEPDM is one of the elastomers commonly used in prefabri. cated roofing membranes. A typical composition of the com· pound is given in Table 1. Three non·reinforced EPDM roofing .!rlembrane samples (RI, R2, R3) of commercially available products were obtained for testing as described in the following paragraphs.
.
Accelerated Ageing
Each sample was cut into seven pieces of about 150mm x 250mm of which one piece was used for control and three each were placed in air-eirculatingovens preheated to 100°C and 130°C for heat·ageing. One piece of each sample was removed from the ovens at I,
7
and 28 days. This scheme could provide the total of 105 specimens needed for ten-sile testing and thermal. analyses.Dynamic Mechanical Analysis
Polymer Laboratory dynamic mechanical thermal analyzer (PL-DMTA) Mark I (see Figure 2) was used with software ver-sion 4.0. The samples were run in the single cantilever mode using test frame L and clamp type C. In this system, a sinusoi-dal stress is applied to a vibrator unit using a sinusoisinusoi-dal cur-rent. The stress imposed upon the specimen is therefore directly related to the amount of current delivered to the vibrator. All the specimens were studied between -120 and 80°C using liquid nitrogen as a coolant. The fixed frequen-cy used was 10Hz with a heating rate of 2°C min:'
All roofing specimens were cut in the machine direction from the EPDM control and aged sheets. The rectangular specimens were Imm thick, 5mm long and 12mm deep. The glass transition temperature (a-transition) values were ob· tained from the DMA curves and are reported as the maxi-inurn in the loss modulus (E") vs. temperature curve. 'Thnsile Testing
The heat-aged samples were conditioned for a minimum of 24 hours. The specimens were cut from the control and aged samples using a dumbbell-shaped die in a hydraulic press. The tests were carried out at room temperature (22°C ± 2°C) using an Instron tensile tester (model 1122) with a gauge length of 60mm and cross·head speed of 60mm min:' The load and elongation curveS were recorded on the machine chart recorder as well as stored 'n the colIlPuter. Five specimens were tested for each condition. The mean values ofload at break and elongation are given in Table 3. RESUcrS AND DISCUSSION
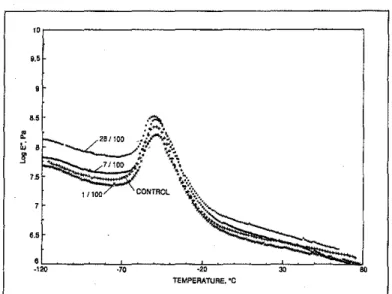
A typical DMA curve showing the loss modulus as a func-tion of temperature is shown in Figure 3.Asillustrated, sam· pie RI undergoes very little change in glass transition temperature even after 28 days of heating at 100°C. This is also the case after heating at 130°C (Figure 4).
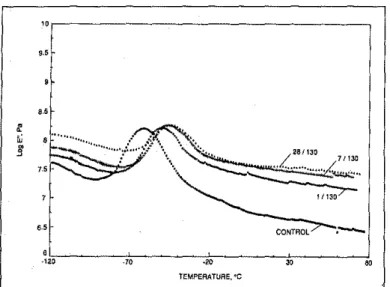
Unlike sample Rl, sample R2 does sustain a significant change in Tg' Figure 5 shows the DMA curves for sample
1991 International Symposium on Roofing 'Thchnology 497
'R2 heated at 100°C for 0, 1,
7
and 28 days. It is apparent that Tg increases with the number of days, particularly7
and 28" days, of heating. The glass transition temperature gradually increases from -61°C for noheating to - 46°C for 28 days at 100°C.Itis interesting to note, as can be seen from Figure 6, that after only 1 day at 130°C, the R2 sam· pie raises its Tg from -61°C to - 50°C. After this sudden jump, the Tg gradually increases to -43°C after 28 days of heat·ageing at 130°C. Sample R3 (Figures
7
and 8) shows little change in glass transition temperature after accelerat· ed ageing. Consequently, the observed change in Tg for specimens Rl and R3 could be due to experimental error. The glass transition temperature data for all three sam-ples are summarized in Table 2. A plot of Tgas a function of days at 100°C and 130°C is shown in Figures 9 and 10, respectively. The figures indicate that R2 is greatly affected by the heat.ageing while Rl and R3 are only slightly affect-e.d. ;Although the Tg of R2 after 28 days of heat·ageing is Slmdar to Rl and R:3, the fact that it is shifting to higher temperatures indicates that it is becoming more crosslinked and its physical/mechanical properties are changing (Table 3).mッイ・セB・セL t?e observed trendセッイ changeセョ Tgfor speci· men R2ISSlmdar to the change m mechamcal properties (Figure 11).It is also interesting to note that although the maximum load at break follows the predicted trend, (i.e., the maximum loads for Rl and R3 are remaining somewhat similar while that for R2 is increasing with heat-ageing), the elongation. at-break is decreasing with heat·ageing for all samples. As
shown in Table 3, this decrease in elongation is much more dramatic for R2 than for either RI or R3. This decrease in elongat\on for all samples is occurring without a change in Tg for samples RI and R3. This might be explained by the fact that processing oils are present in all formulations (see Table 1). It is possible that, even if the processing oils are not completely lost during heat-ageing, the quality of the oil is deteriorating and as such will not be lubricating effi· ciently. If this were the case, the elongation of the samples would decrease without seeing any change in Tg.
Another point ofinterest is with respect to the, heat-ageing process itself. It would appear that
7
days, of heat-ageing the materials at 130°C is equivalent to 28 days of heat-ageing at 100°C. The Tjt value for Rl is - 50°C after 28 days at 100°C and -49"C after7
days at 130°C. In the case ofR2, the glass transition temperature is - 46°C after 28 days at 100°C and7
days at 130°C indicating apparent equivalen-cy. Finally, in the case ofR3, the Tgvalues are -44°C and -45°C after 28 days at 100°C and7 days at 130°C, respec' tively.Since the above phenomena are of importance to the roof· ing industry, further investigation on other types of poly. meric roofing membranes is needed.
CONCLUSIONS
• Glass transition temperature can be used to explain the change in mechanical properties of roofing membranes. • Dynamic mechanical analysis is a valuable tool in charac· terizing polymer·based roofing materials, since one can easily obtain Tg data.
• Accelerated ageing by exposing membranes to elevated temperature may reduce the time required at the maxi· mum service temperature to evaluate the effect of heat
498 1991 International Symposium on Roofmg 'technology
on mechanical properties of polymer·based materials. • Equivalency of responses of materials at different temper·
atures could help in establishing standard requirements.
ACKNOWLEDGEMENTS
The authors of this paper wish to thank Ms. Ana Delgado, Ms. Doreen Charron and Ms. C. Yelle for their assistance. This joint research project has also been funded by Canada Post Corporation, Department of National Defense and Pub· lie Works Canada. Their support is gratefully acknowledged.
REFERENCES
, Feldman, D.,Polymeric Builtling Materials, Elsevier Science Pub·
lishers Ltd., New York, 1989.
, Billmeyer, F. W.,Textbook ofPolymer Science, 3rd Ed.,john Wiley
and Sons, New York, 1984.
11 Young, R
J.,
IntroductiontoPolymers,Chapman and Hall, NewYork, 1981.
• Bikales, N. M.,Mechanital Properties ofPolymers, john Wiley and
Sons, New York, 1971.
, Flory, P.]..Principles of Polymer Chemistry, Cornell University
Press, 1967.
• Rosen, S. L.,Fundamental PrinciPles ofPolymeric Materials, Barnes
and Noble, Inc., 1971.
, Murayama,1'.,Dynamit Mechanical Analysis of Polymerit Materi·
al,ElsevierScientific ,PublishingCompany, New York, 1978.
, Wendlandt, W. Wm., ChemitalAnalysis 19:ThermalAnalysis, 3rd
Edition, john Wiley and Sons, 1986.
, Campbell, D., White,]. R.,Polymer Char<U:tl!rization: Physital Tl:ch· niques, Chapman and Hall, New York, 1989.
" Crompton,T.R.,Analysis ofPolymers: An Introduction, Pergamon
Press, 1989.
11 SkrovaIiek, D.]., Schoff, C.K.,Progress in Organic Coatings, 16,
135-163 (1988).
Heat·ageing Schedule Tg("C) for Samples
'temp., ·C Days Rl R2 WI 0* -49 -61 -46 100 1 -48 -58 -45 100 7 -49 -50 -42 100 28 -50 -46 -44 0* -49 -61 -46 130 1 -48 -50 -46 130 7 -49 -46 -45 130 28 -48 -43 -44
*Unheated control material
Table 2 Glass transieron temperatures of EPDM membranes.
Heat·ageing Strength (kN m") Elongation (%) Schedule Temp.,oC Days Rl R2 WI R1 R2 R3 0* 10.6 8.7 11.4 522 285 307 100 1 20.9 8.8 10.8 433 266 314 100
7
11.6 9.5 11.3 396 211 297 100 28 10.7 10,5 10.6 324 132 270 0* 10.6 8.7 11.4 522 285 307 130 I 9.9 9.2 9.3 348 180 273 130 1 9.7 10.9 9.8 307 88 227 130 28 8.0 11.6 9.7 218 38 159"'Unheated control material
Tabk J Tensile strength and elongation values of EPDM membranes.
E'
E"
\
E J.,.'
*Based on technical notes andsome, related patent specifications.
'1IIble 1 'Pjpital composition of a generic EPDM roofing membrane compounO.
Figure1a Relationship between the compkx modulus(E*),the storage modulus (E?, the loss modulus(E'), and the loss angle (6).
1991 International Symposium on Roofing Thchnology 499
"r---,
"\
Time,t
Figure Ib Graphical representation of the stress-strain relationship in
DMA. Figuretrol), 1 dlJy (1Il00), 7 dlJys (7/100), and 28 dlJys (281100).J DMA curves
frr
specimen R1 aged at 100°Cfor 0 dlJys(con-Vibrator
"r---,
GLBBイMMセMM」A⦅BLNNNNNMMMM⦅BBMMMMセSPセMMNNNNNZZ]ABᄋ TEMPEft'TURE,'C,.,
28/130NNUセ
イZセセZZZZZ]BZBWZPNセZ
セ|
1-.;... " 7.5 ···•·•·..···....1(····-%1/130'1
CON,"Ol"
..
Liquid nitrogen '---Clamps セMMMM Drive shaft:::.:0-.',<__---,.
Displaoement transducer Temperature enclosureBMiヲ]iイjGセセセセセN」Z[セ[セᄋウ。ューGY
Front view Hカ・イエゥ」。ャセィッイャコッョエ。ャI イMMセ Stainless steet,clamping frame Figuretrol), 1 dlJy (1/130), 7 dlJys (71130), and 28 dlJys (28/100).4 DMA curves for specimen R1 aged at IJOOC for 0 dlJys (con.
t
a
t
Sample clamping bars
Sample
"r---,
,.,
- , >b
<-Top view ;;Clampnuts
M3 studs
t
t
セIウ。ュpiN
= =
t
Stainless steelc clamping frame
t
ArumlriUmdriveclampDrive shaft
!
Displacement axis,
ᄋャセo-"
,
TEMPERATURE, 'C CONTROL"
Figure 2 Polymer Laboratory dynamic mechanical thermal analyzer
mechanical head and clamp
Figure5 DMA curvesfor specimen R2 aged at 100oCfor 0 dlJys (con· trol),1dlJy (11100), (7/130), and 28 dlJys (28/130).
500 1991 International Symposium on Roofing 'Thchnology
"r---,
..
,
- 4 0 , . - - - , __ ." _." - - -_. - _. _.' - - _.... _.... -'0 '¢"" ."
NセコI[[LセセMMMNM[[LLZMMMMMMLNイッA[[MMMMMMエBGZMMMMMMABN TEMPERATURE,·cFigure6 DMA curves for specimen R2 aged at 130oGfor 0 days (can· trol), 1 day (11130), 7 days (7/130), and 28 days (28/100).
--.-.-.
---A
"
- - - - ' - . 6 , ' セ -50.a
セ8-セ
c .2 Nセ セ -60 ""'"
"
CONTROL . . . -... .... NセQ_NNN .... "" エZZZセZZZZZZZZNZ..::..
·6·.:·,,·..1..
ᄋセᄋᄋ...
LセNM /281130 7/130,'F
.
\
セMMMZNᄋW....
ᄋᄋᄋᄋLセN 1/130"
-70+--+--+--+--+--+--+--+--+--+--+--+---j o 5 10 15 20 25 3DHeat Ageing Time (Days)
- 4 0 , . - - - ,
Figure 9 Variation ofglass transition temperature as afunction ofheat· ageing at 1000G for samples Rl, R2, and R3.
A ' -....- .-_.,-
.,.-.
._.-._._.-.-._._"
0. __ O' - _.'".
セ -50セ
•
セ E セ c セ..
c o r=-60"
9.5,
a.5 .. セr:;·
ii,.:,. 0; a 71100 'J. .!' セLセNL.."
セセBB[Ba:
..
BセセGKG 7.5 ... '.;; 1/100 \, oJ.':,
CONTROL |Zセセセ ..•.ZMセ5'
...
セ """",
---'20 ·ro ·ro'"
"
TEMPERATURE,'CFigure 7 DMA curves for specImen R3agesat 1000Gfor 0 days (con.
tro/), 1 day (11100), 7 days (7/100), and 28 days (28/100).
",---,
"
\,
3D - 70-l--+--+---+--+---+--+--+---.,_-+---.,--+--I o 5 10 15 20Heat Ageing Time (Days)
Figure 10 Variation
if
glass transition temperature as afunctWn ofheat· ageing at lJOOG for samples Rl, R2, and R3.Figure8 DMA curves for specimen R3 aged at lJOoGfor 0 days (can· tro/), 1 day (11130), 7 days (7/130), and 28 days (28/130).
1991 International Symposium on Roofing Thchnology 501 QRセMMセMMMMMMMセMMMセ 11 \ . _·6 10 / / 30 25 s+---+--+-r--+---+---+-r--+--+---+-,----i o 5 10 15 20
Heat Ageing Time (Days)
Figure11 Variation of strength of R2 as a jumtUm of heat·ageing at