Publisher’s version / Version de l'éditeur:
Polymer Engineering and Science, 45, 4, pp. 606-612, 2005-04-01
READ THESE TERMS AND CONDITIONS CAREFULLY BEFORE USING THIS WEBSITE. https://nrc-publications.canada.ca/eng/copyright
Vous avez des questions? Nous pouvons vous aider. Pour communiquer directement avec un auteur, consultez la première page de la revue dans laquelle son article a été publié afin de trouver ses coordonnées. Si vous n’arrivez pas à les repérer, communiquez avec nous à [email protected].
Questions? Contact the NRC Publications Archive team at
[email protected]. If you wish to email the authors directly, please see the first page of the publication for their contact information.
NRC Publications Archive
Archives des publications du CNRC
This publication could be one of several versions: author’s original, accepted manuscript or the publisher’s version. / La version de cette publication peut être l’une des suivantes : la version prépublication de l’auteur, la version acceptée du manuscrit ou la version de l’éditeur.
For the publisher’s version, please access the DOI link below./ Pour consulter la version de l’éditeur, utilisez le lien DOI ci-dessous.
https://doi.org/10.1002/pen.20310
Access and use of this website and the material on it are subject to the Terms and Conditions set forth at
Real-Time Monitoring of Injection Moulding for Microfluidic Devices
using Ultrasound
Ono, Y.; Jen, C. -K.; Cheng, C. C.; Kobayashi, M.
https://publications-cnrc.canada.ca/fra/droits
L’accès à ce site Web et l’utilisation de son contenu sont assujettis aux conditions présentées dans le site LISEZ CES CONDITIONS ATTENTIVEMENT AVANT D’UTILISER CE SITE WEB.
NRC Publications Record / Notice d'Archives des publications de CNRC:
https://nrc-publications.canada.ca/eng/view/object/?id=9b4cd1ef-5f26-4e84-965d-95370b88ecc5 https://publications-cnrc.canada.ca/fra/voir/objet/?id=9b4cd1ef-5f26-4e84-965d-95370b88ecc5Real-Time Monitoring of Injection Molding for
Microfluidic Devices Using Ultrasound
Y. Ono, C.-K. Jen
Industrial Materials Institute, National Research Council of Canada, 75 de Mortagne, Boucherville, Que´bec J4B 6Y4, Canada
C.-C. Cheng, M. Kobayashi
Department of Electrical and Computer Engineering, McGill University, 3480 University, Montreal, Que´bec H3A 2A7, Canada
Real-time process monitoring of the fabrication process of microfluidic devices using a polymer injection mold-ing machine was carried out usmold-ing miniature ultrasonic probes. A thick piezoelectric lead-zirconate-titanate film as an ultrasonic transducer (UT) was fabricated onto one end of a 4-mm diameter and 12-mm long steel buffer rods using a sol gel spray technique. The center fre-quency and 6 dB bandwidth of this UT were 17 MHz and 14 MHz, respectively. A signal-to-noise ratio of more than 30 dB for ultrasonic signals reflected at the probing end was achieved. The probe can operate continuously at 200°C without ultrasonic couplant and cooling. Clear ultrasonic signals were obtained during injection mold-ing of a 1-mm-thick part havmold-ing test patterns on its surface. Shrinkage of the molded part and part detach-ment from the mold were successfully monitored. Sur-face imperfections of the molded parts due to a lack of the sufficient holding pressure is discussed with regard to the ultrasonic velocity obtained. The presented ultra-sonic probes and technique enable on-line quality con-trol of the molded part by optimizing the holding pres-sure and improvement of process efficiency by reducing the cycle time.POLYM. ENG. SCI., 45:606 – 612, 2005. © 2005 Society of Plastics Engineers
INTRODUCTION
A microfluidic device, consisting of one or more chan-nels with at least one dimension less than 1 mm, has attractive features such as small sample requirement and
low power consumption, realizing a lab-on-a chip device [1]. Polymer injection molding is a process of forcing melted polymer into a mold cavity having a unique shape for a designed production part. This technique is a promis-ing candidate to fabricate disposable microfluidic devices at low cost and in mass production [2]. However, polymers need to be selected and modified in order to meet the requirements of narrow process windows involved with their flow, solidification, and microstructure development in micron-size channels. Because of this complexity, real-time process monitoring is desired to improve the quality of the molded part and optimize the process. An ultrasonic method was chosen in this study because of its ability to probe the properties of polymers within the mold [3].
In this study, real-time process monitoring of a microflu-idic device fabrication, using an injection molding machine, was performed using miniature ultrasonic probes. A thick piezoelectric film ultrasonic transducer (UT) was fabricated onto one end of small steel buffer rods using a sol gel spray technique [4]. Monitoring of solidification and shrinkage of the molded part in the mold cavity are demonstrated using ultrasonic signals observed in an ultrasonic pulse-echo tech-nique. Surface imperfections of molded parts are also dis-cussed with regard to ultrasonic velocities in the molded part obtained during molding.
MINIATURE ULTRASONIC PROBES
Design and Fabrication
A thick piezoelectric film UT was fabricated onto one end of 4-mm diameter and 12-mm long steel buffer rods using a sol gel spray technique [4]. The sol gel was com-posed of fine lead-zirconate-titanate (PZT) powders and PZT solution. Figure 1a,b shows photographs of the steel buffer rod with the PZT film as the UT and a probe with a
Correspondence to:Yuu Ono; e-mail: [email protected] Permanent address for C.-C. Cheng is Dept. of Electrical Engineering, Hsiuping Institute of Technology, Taichung, Taiwan, ROC.
Current address for M. Kobayashi is Industrial Materials Institute, National Research Council of Canada, Boucherville, Que´bec, Canada.
Contract grant sponsor: Natural Sciences and Engineering Research Coun-cil of Canada.
DOI 10.1002/pen.20310
Published online in Wiley InterScience (www.interscience.wiley.com). ©2005 Society of Plastics Engineers
holder and an electric cable, respectively. Two spiral like V-grooves with a depth of 0.5 mm and a periodicity of 0.8 mm were machined onto the buffer rod periphery in order to enhance the signal-to-noise ratio (SNR) of the desired ul-trasonic signals obtained in pulse-echo mode. The top elec-trode size was 2 mm in diameter. The buffer rod itself served as a bottom electrode. Operating ultrasonic frequen-cies are available in the range of 10 –30 MHz by controlling the PZT film thickness. The detailed fabrication procedure by the sol gel spray technique can be found elsewhere [4]. The probes developed have a compatible external dimen-sion with conventional temperature and cavity pressure sen-sors (for example, 6167A, Kistler Instrument, Amherst, NY) so that it can be installed into the injection molding machine without modification of the existing mold. The temperature, pressure, and ultrasonic sensors are also inter-changeable.
Ultrasonic Performance
The SNR, which is one of the most important parameters to evaluate performance of the ultrasonic probes, is defined as the strength of the desired signals reflected at the probing end over that of the unwanted echoes in the buffer rod through this paper. Ultrasonic signals reflected at the prob-ing end, obtained by the probe without and with the
V-grooves on the rod periphery, are presented in Fig. 2a,b, respectively. In Fig. 2a, the trailing echoes [5] are observed between L1 and L2 echoes with the probe having no V-grooves, where L1and L2are the first and second roundtrip longitudinal-wave echoes, respectively, reflected from the probing end of the buffer rod. The trailing echoes are generated due to mode conversion, wave reverberation and diffraction within a rod of finite diameter and specific shape [5, 6]. These trailing echoes may interfere with the desired echoes and deteriorate the SNR of the desired signals in the pulse-echo measurements.
On the other hand, in Fig. 2b, the trailing echoes are eliminated and the SNR of the L1is significantly improved to 33 dB with the sensor having the V-grooves shown in Fig. 1, since the waves generated due to mode conversion are scattered at the boundary and are not added in-phase at the receiver [6]. For the purpose of further miniaturization of the sensor, an electrode diameter of 1 mm was tested. It was found that the signal amplitude (strength) and the SNR of the probe having an electrode diameter of 1 mm de-creased 21 dB and 12 dB, respectively, compared with an electrode diameter of 2 mm. Figure 3 presents the frequency spectrum of the L1echo in Fig. 2b obtained by the probe with V-grooves. The center frequency and 6 dB bandwidth were 17 MHz and 14 MHz, respectively. It was also verified that the probes can operate continuously at 200°C without serious deterioration of the signal strength and the SNR. The developed probes required no ultrasonic couplant or cooling for the current study.
FIG. 2. Ultrasonic signals reflected at the probing end, measured by the probe without (a) and with (b) V-grooves on the rod periphery. L1and L2
are the first and second roundtrip longitudinal-wave echoes, respectively.
FIG. 1. Photographs of a miniature ultrasonic probe developed. Steel buffer rod with PZT film UT (a), and complete probe with a holder and electric cable (b).
EXPERIMENTAL SETUP
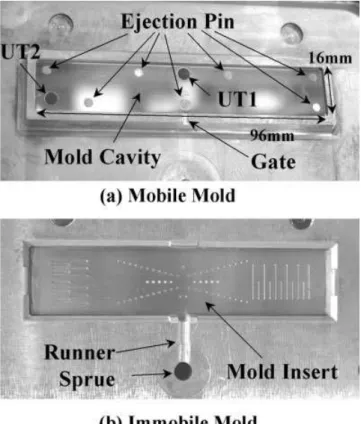
A mold of the injection molding machine (BOY30, BOY Machines, Exton, PA) used in the experiments was com-posed of a mobile mold (Fig. 4a) onto which the two ultrasonic probes (UT1 and UT2) were installed, and an immobile mold (Fig. 4b) onto which a replaceable mold insert having microstructures was attached. The probing ends of the UT1 and UT2 were flush with the cavity surface of the mobile mold as shown in Fig. 4a. The dimension of the mold cavity was 96-mm long, 16-mm wide, and 1.1-mm deep. The microstructures, which are printed on the surface
of the molded parts, were fabricated on one side of the steel mold insert facing the mold cavity as shown in Fig. 4b. The mold insert used in the experiments had test patterns of 22 line grooves (width: 1 mm; length: 6 or 12 mm; depth: 0.01, …, 0.3 or 0.5 mm) and 57 holes (diameter: 0.77 mm; depth: 0.01, …, 0.3 or 0.5 mm). The probing ends of the probes were located above the hole with a depth of 0.5 mm for UT1 and the two lines with depths of 0.3 mm and 0.5 mm for UT2.
A cycle of the injection molding process is as follows: 1) polymer melt is injected into the cavity of a mold through the sprue, runner, and gate; 2) the cavity is completely filled with the material and the additional melt is forced into the cavity under holding pressure until the gate is frozen in order to compensate for the shrinkage of the part due to the continuous cooling. Then the part is further cooled until it is sufficiently solidified; 3) the mold is opened and the part is detached from the immobile mold; and 4) the part is ejected from the cavity of the mobile mold by the ejection pins. Then the mold is closed and entire cycle, 1– 4, is repeated. A typical molding condition employed in the experi-ments was: melt and mold temperatures were 230°C and 60°C, respectively; injection and holding pressures were 10 MPa; and holding and cooling times were 3 sec and 10 sec, respectively.
A photograph of a part molded is given in Fig. 5. The material employed was a polymethyl methacrylate (PMMA, Acrylite M30, Cytec Industries, West Paterson, NJ) of in-jection molding grade. One can see that the patterns were printed on the surface of the part in Fig. 5. The white line circles in the figure indicate the areas corresponding to the probing end areas of UT1 and UT2 on the opposite side of the patterns. An ultrasonic data acquisition system was composed of two pulser-receivers (5072PR, Panametrics, Waltham, MA), 8-bit dual-channel digitizing boards (CS2125, Gage Applied Science, Montreal, QC, Canada) with a sampling rate of 125 MHz for each channel, and a personal computer with data acquisition and analysis pro-grams by LabVIEW. The signals were acquired every 10 msec during the entire molding process in the pulse-echo mode.
FIG. 4. Photographs of a mold of an injection molding machine used in the experiments. Mobile mold on which two miniature ultrasonic probes (UT1 and UT2) were installed (a), and immobile mold with a steel mold insert having test patterns (b).
FIG. 5. A photograph of a molded part having test patterns with different shapes and dimensions. The white line circles in the figure indicate the areas corresponding to the probing end areas of UT1 and UT2 on the opposite side of the patterns.
RESULTS
Figure 6 presents a schematic view of a cross-section of the mold (mobile and immobile mold), mold insert, and molded part (polymer) with the probes (UT1 and UT2). Ln (n ⫽ 1, 2, …) represents n-th roundtrip longitudinal-wave echoes reflected at the probing end, and L2n, L2n⬘, and L2n⬙
are those propagating in the polymer and reflected at the polymer-mold insert interface.
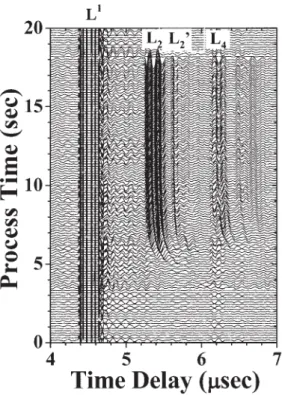
Figure 7 shows a typical result of acquired signals with UT1 during one cycle of molding. Only a portion of the acquired signals with a process time interval of 150 msec are shown in the figure, although the signals were acquired every 10 msec as mentioned previously. One can see the L1
echoes reflected at the probing end-polymer or -air interface depending on whether the polymer existed at the UT1 location or not. When the polymer melt arrived at the UT1 location and contacted the probing end, the L2, L2⬘, and L4
echoes were observed in addition to the L1echoes. The L2and L4were reflected from the top surface of the
mold insert, while the L2⬘ was from the bottom surface of
the 0.5-mm deep hole as illustrated in Fig. 6. At process times of 3–7 sec, the time delay of the L2, L4, and L2⬘
echoes gradually decreased since the ultrasonic velocity in the polymer increased due to solidification [3], which is further discussed below. At a process time of around 18 sec, those echoes vanished, which indicates that the molded part was detached from the probing end. With UT2, the L2, L2⬘,
L2⬙, and L4 echoes propagating in the polymer, shown in
Fig. 6, were observed as well (data not shown).
In order to investigate the correlation between ultrasonic signals observed and the molding cycle, the amplitude val-ues of the L1echoes with respect to the process time were obtained using the signals measured with UT1. Figure 8 gives variations of amplitude of the L1 with the different holding pressures during one molding cycle. When the polymer arrived at the UT1 location and contacted its prob-ing end at a process time of around 3 sec, the amplitude of the L1echo suddenly decreased due to the fact that a part of the ultrasonic energy was transmitted into the polymer through the probing end-polymer interface.
At 18 sec, the amplitude of the L1recovered to the initial value in the cases with holding pressures of 7.5, 10, and 15 MPa since the mold opened and the molded part was de-tached from the probing end. Ultrasonic reflection coeffi-cient at the steel (probing end)-air interface is almost unity and the transmitted ultrasonic signal into the air from the probing end was much smaller than the noise level of the measurement system. Thus, at this moment the L1 was totally reflected at the probing end-air interface. This means FIG. 6. Schematic view of a cross-section of the mold (mobile and
immobile mold), mold insert, and molded part (polymer) with two probes (UT1 and UT2). Lnand L
2n(n⫽ 1, 2, …) represent n-th round trip echoes
propagating in the buffer rods and those in the polymer, respectively.
FIG. 7. Typical signals measured with UT1 during cycle of injection molding process.
FIG. 8. Amplitude variations of L1echoes with respect to the process
time during one molding cycle, obtained by UT1 with different holding pressures.
that the ultrasonic method cannot measure the air gap be-tween the mold surface and the part developed, which is the limitation of the ultrasonic technique used here.
On the other hand, the amplitude of the L1, with holding pressures of 2.5, 5, and 6 MPa, was gradually recovered to the initial values at 5, 6.2, and 10.2 sec, respectively, before the mold opened, since the part was gradually detached from the probing end (i.e., the mold surface) because of shrinkage of the part, caused by the lack of sufficient holding pressure. The contact time, indicated by the dashed arrows in Fig. 8, was shorter with the lower holding pres-sures when the holding pressure was below 6 MPa.
Figure 9 shows the contact times obtained by UT1 (open circles) and UT2 (closed circles) with respect to the holding pressure. Three parts were continuously molded for each holding pressure. The contact time was an almost constant value of 15 sec with a holding pressure higher than 7.5 MPa. At 6 MPa, the contact time varied between 4 –15 sec, which means that this pressure value may be critical to have a stable molding condition. Below 6 MPa, the contact times obtained with UT1 were slightly greater than those with UT2. This suggests that the area at UT1 near the gate have higher holding pressures or have more polymer injected than the area at UT2 near the edge of the cavity.
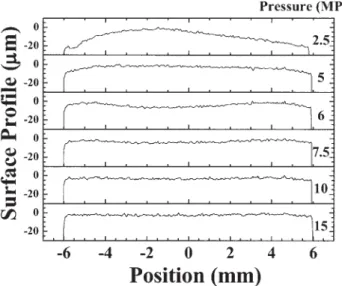
In order to study the effect of the holding pressure on quality of molded parts, we measured surface profile on the line pattern at the right side edge of the part, shown in Fig. 5, using an optical interferometory technique [7]. The mea-surement results are given in Fig. 10 and the maximum variation of the surface profile is summarized in Table 1. When the holding pressure was higher than 7.5 MPa, the surface was almost flat, with a maximum variation of 5 m or less. However, the maximum variation became larger as the holding pressure was lower than 6MPa. The maximum variation was 24 m at 2.5 MPa. This is due to the fact that the molded part detached from the mold surface before solidification, probably because of the lack of sufficient holding pressure when it was lower than 6 MPa. Therefore, it is concluded that the holding pressure higher than 7.5 MPa is required for a stable molding condition and for good parts having flat surfaces on the line pattern under our experimental conditions with the presented injection
mold-ing machine, the mold includmold-ing the mold insert, and the material employed in this study.
DISCUSSION
Velocity of ultrasound propagating in the polymer is strongly related to its physical and rheological properties. Therefore, solidification behavior of the polymer melt in-jected into the mold cavity may be predicted by monitoring the ultrasonic velocity in the molded part during the mold-ing process. The velocity can be determined usmold-ing the L2n
echoes propagating in the polymer. The ultrasonic velocity, v, is determined by v⫽ 2h/⌬t, where h is the depth of the mold cavity at the UT location, and ⌬t is the time delay difference between the L1and L2or the L2and L4shown in
Fig. 7.
Figure 11 presents the ultrasonic velocity with respect to the process time obtained with UT1 at different holding pressures. At a process time of 3.6 –5 sec, indicated by the dotted lines in Fig. 11, the data are missed since the echoes from the polymer (L2n) were not observed. This is due to the
ultrasonic attenuation in the polymer being so high during this period and we could not observe L2n. This will be
further discussed below. The measured velocity in the poly-mer at 7.5, 10, and 15 MPa varied from 1,000 –2,400 m/s, indicating the variation of the elastic properties of the part, such as elastic constants, viscosity, and density due to transformation of the polymer from the liquid to the solid state. At a process time of 10 sec, the velocity became almost constant and the maximum value of 2,400 m/s. However, at 2.5, 6, and 5 MPa, the velocities were obtained only before the part detached from the probing end due to its shrinkage, as described previously.
In order to predict the state of the polymer inside the cavity using the ultrasonic velocities obtained during mold-FIG. 9. Contact time obtained from amplitude variation of the L1echoes
shown in Fig. 8 with respect to the holding pressure.
FIG. 10. Surface profile on the line pattern at the right edge of the part, shown in Fig. 5, measured by an optical interferometory technique.
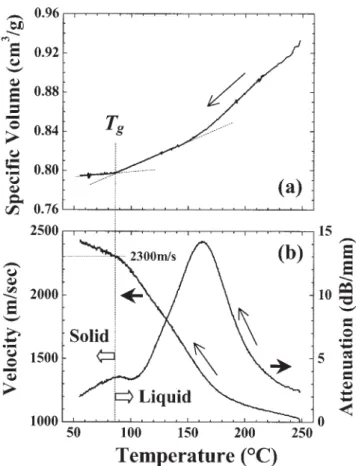
ing, we conducted off-line measurements of ultrasonic properties of the same PMMA using a static ultrasonic measurement system [8]. This system can measure the spe-cific volume, ultrasonic velocity, and ultrasonic attenuation in the polymeric materials simultaneously with a function of temperature and pressure. Details of this system can be found elsewhere [8]. Figure 12 presents measurement re-sults with PMMA at a temperature range of 250 –50°C during cooling at a pressure of 10 MPa. Ultrasonic fre-quency was 2.5 MHz and the cooling rate was –2°C/min. Figure 12a shows the specific volume. A knee was observed at 86°C, corresponding to the glass transition temperature, Tg[9]. Above or below Tg, the PMMA was in (viscous or
rubbery) liquid or (glassy) solid state, respectively, under the presented condition. Ultrasonic velocity and attenuation of the PMMA are given in Fig. 12b. The knee was also observed in the velocity curve at Tg, where the ultrasonic
velocity was 2,300 m/s. In the attenuation curve, a large peak (␣ peak) and a small one ( peak) were observed at 160°C and 90°C, respectively, related to relaxation phenom-ena [9].
Here our attempt is to interpret the solidification behav-ior of the PMMA in the mold and the surface profile in Fig. 10 by correlating the off-line measurement results in Fig. 12 with the ultrasonic velocities in Fig. 11 obtained during
molding. It is noted that temperature dependence of the material properties in Fig. 12 is sensitive to the thermal history of the material, pressure, and ultrasonic frequency employed. Therefore, we can only explain the behavior of the PMMA in the mold cavity qualitatively since the cool-ing rate in the moldcool-ing was much larger than that in the off-line measurements. In the molding, the melt (230°C) was cooled to mold temperature (60°C) within 15 sec under the presented molding condition while in the off-line mea-surements the cooling rate was –2°C/min, as mentioned previously.
When the molten polymer was injected into the mold cavity with holding pressures of 7.5, 10, and 15 MPa, and arrived at the UT location at 3 sec, the velocity was about 1,000 m/s, as shown in Fig. 11, corresponding to the veloc-ity in the liquid state in Fig. 12b. The ultrasonic signals from the polymer (L2n) were temporarily lost in the time range of
3.6 –5 sec in Fig. 11 due to the large attenuation peak during cooling caused by ␣ relaxation as shown in Fig. 12b. Then the velocity increased gradually and became almost con-TABLE 1. Maximum variation of surface profile on the line pattern of molded parts shown in Fig. 10, with different holding pressures.
Holding pressure (MPa) 2.5 5 6 7.5 10 15
Maximum variation (m) 24 15 8 5 5 4
FIG. 11. Ultrasonic velocity variation with different holding pressures obtained by UT1 during one cycle of the injection process.
FIG. 12. Specific volume (a), and ultrasonic velocity and attenuation (b) of the PMMA with respect to the temperature during cooling, measured by a static ultrasonic measurement system. The pressure was kept at 10 MPa during the measurement.
stant and maximum value of 2,400 m/s after a process time of 10 sec in Fig. 11, which is larger than that (2,300 m/s) at Tg, indicating that the part temperature was less than Tgand
the part was already in the solid state. Thus, further cooling may not have been necessary after 10 sec, and a shorter cycle time may be achieved. From this information, we can control the cooling time and improve the process efficiency of part manufacturing.
With holding pressures of 2.5, 5, and 6 MPa the ultra-sonic signals (L2n) were totally lost before the velocity
reached 2,300 m/s, which is the velocity value at Tgsince
the molded part was detached from the probing end (mold surface). This means that the part was apart from the mold surface when it was still soft, in a viscous or rubbery state. The lower the holding pressure, the smaller the ultrasonic velocity finally reached, as shown in Fig. 11 at 2.5, 5, and 6 MPa. This may explain why the roughness of the part surface increased with the lower holding pressures shown in Fig. 10 and Table 1. Thus, the part surface quality of the molded parts and the holding pressure can be optimized by monitoring the ultrasonic velocity in the material to reach the desired value in real-time during molding using the presented ultrasonic miniature probes and technique.
CONCLUSION
We performed real-time monitoring of the fabrication process of microfluidic devices using a polymer injection molding machine with miniature ultrasonic probes embed-ded into the mold of the machine. The center frequency and 6 dB bandwidth of these ultrasonic probes were 17 MHz and 14 MHz, respectively, and an SNR more than 30 dB for ultrasonic signals reflected at the probing end was achieved. The probes operated continuously at 200°C without ultra-sonic couplant and cooling.
Clear ultrasonic signals were obtained during molding of a 1-mm-thick part having test patterns on its surface. Shrinkage and detachment of the molded parts in the mold cavity were successfully monitored using the amplitude variation of the signals reflected from the mold cavity surface. The ultrasonic velocity in the molded parts can be
used to predict the state of the polymer injected into the mold cavity. It was verified by monitoring variation of the ultrasonic velocity that the molded part was detached from the mold surface before being sufficiently solidified at a holding pressure below 6 MPa with the presented molding machine, conditions, and material employed, resulting in an increase of the roughness on the part surface. Thus, it is demonstrated that the presented ultrasonic probes and tech-nique enable on-line quality control of the molded parts and improvement of process efficiency by optimizing the hold-ing pressure and the process cycle time.
ACKNOWLEDGMENTS
The authors thank J. Tatiboue¨t for useful discussion and N. Nardini, B. Gauthier, and H. He´bert for technical assis-tance.
REFERENCES
1. C.H. Ahn, J.-W. Choi, G. Beaucage, J.H. Nevin, J.B. Lee, A. Puntambekar, and J.Y. Lee, Proc. of the IEEE, 92, 154 (2004). 2. J.-W. Choi, S. Kim, R. Trichur, H.J. Cho, A. Puntambekar, R.L. Cole, J.R. Skimkins, S. Murugesan, K. Kim, J.-B. Lee, G. Beaucage, J.H. Nevin, and C.H. Ahn, Micro Total Analysis Systems, 411 (2001).
3. Y. Ono, M. Kobayashi, C.-K. Jen, C.-C. Cheng, A. Derdouri, and Y. Simard, SPE ANTEC, 556 (2004).
4. M. Kobayashi and C.-K. Jen, Smart Materials and Structures,
13, 951 (2004).
5. M. Redwood, Mechanical Waveguides, Pergamon, New York, 190 (1960).
6. C.-K. Jen, L. Piche, and J.F. Bussiere, J. Acoust. Soc. Am., 88, 23 (1990).
7. M.L. Dufour and B. Gauthier, Proc. of SPIE, 5260, 173 (2003).
8. L. Piche, F. Massines, A. Hamel, and C. Neron, U.S. Patent 4,754,645 (1988).
9. N.G. McCrum, B.E. Read, and G. Williams, Anelastic and Dielectric Effects in Polymeric Solids, John Wiley & Sons, London, 238 (1967).