DIAL • 4, rue d’Enghien • 75010 Paris • Téléphone (33) 01 53 24 14 50 • Fax (33) 01 53 24 14 51 E-mail : dial@dial.prd.fr • Site : www.dial.prd.fr
D
OCUMENT DE
T
RAVAIL
DT/2007-02
Youth and labour markets in Africa
A critical review of literature
YOUTH AND LABOUR MARKETS IN AFRICA
A CRITICAL REVIEW OF LITERATURE
DIAL1
Document de travail DIAL Février 2007
ABSTRACT
Young people in Africa are confronted with many difficulties when it comes to their integration in the labour markets and their research for decent and productive jobs. Youth unemployment, which is substantially higher than global adult unemployment, has been growing in the last decade. In spite of the dramatic economic, social and political consequences of African youth employment problems, few studies focus on this population.
This survey of literature stresses that a clear diagnosis of youth employment problems in African countries based on hard data and analytical research is badly needed. As shown by our research review, basic labour market indicators are lacking or are at best incomplete due to data availability and methodological problems. Worst, as illustrated in our paper, different sources lead to opposite diagnoses concerning youth unemployment and its trends. In order to contribute to this diagnosis, we present some new evidence based on the 1-2-3 Surveys recently conducted in 10 African countries, which provide a consistent and comparable picture of the situation of youth employment in urban labour markets in these countries. We also underline the diversity of the situation of youth employment on the continent (Southern Africa vs. other African countries; Anglophone vs. Francophone countries, etc.). We emphasize the “urban bias” in economic research on this subject, partly due to the lack of data on rural areas.
Key Words : Youth, labour, unemployment, Africa RESUMÉ
Les jeunes en Afrique sont confrontés à de nombreuses difficultés pour s’intégrer dans le marché du travail et pour y trouver un emploi décent et productif. Le chômage des jeunes, qui est substantiellement plus élevé que le chômage global des adultes, a crû au cours de la dernière décennie. En définissant une cible spécifique sur le chômage des jeunes dans les Objectifs du Millénaire pour le Développement, la communauté internationale a reconnu la gravité de la situation. Toutefois, malgré les dramatiques conséquences économiques, sociales et politiques des difficultés d’emploi des jeunes africains, peu d’études s’intéressent spécifiquement à cette population.
Cette revue de littérature souligne le fait qu’un diagnostic précis concernant l’emploi des jeunes en Afrique basé sur des données statistiques et une recherche analytique est cruellement nécessaire. Comme le montre notre étude, les indicateurs basiques sur le marché du travail manquent ou sont au mieux incomplets en raison du manque d’informations de bases et de problèmes méthodologiques. Pire, comme l’illustre notre papier, des sources différentes conduisent à des diagnostics opposés concernant le chômage des jeunes et ses tendances. Afin de contribuer à ce diagnostic indispensable, nous présentons de nouveaux résultats basés sur les enquêtes 1-2-3 conduites récemment dans 10 pays africains, qui procurent une image cohérente et comparable de la situation des marchés du travail urbains dans ces pays. Nous soulignons également la diversité de la situation de l’emploi des jeunes sur le continent (Afrique australe vs autres pays d’Afrique, pays anglophones vs francophones, etc.). Nous montrons enfin le « biais urbain » de la recherche économique sur ce sujet, dû en partie au manque de données sur les zones rurales.
Mots clés : Jeunes, travail, chômage, Afrique JEL Code : C25, D60, D71, D72, I31, I32
1 This study has been commissioned by the AFD. Corresponding authors: cling@dial.prd.fr, gubert@dial.prd.fr, nordman@dial.prd.fr, robilliard@dial.prd.fr. The contributors to this study include Thomas Bossuroy, Jean-Pierre Cling, Philippe De Vreyer, Marie-Hélène
Contents
1. INTRODUCTION ... 5
2. FACTS AND FIGURES: WHAT DO WE KNOW (AND DO NOT KNOW) ABOUT YOUTH EMPLOYMENT IN AFRICA ... 6
2.1. Youth employment in Africa ... 6
2.1.1. The challenge of monitoring youth employment ... 6
2.1.2. Youth labour force participation ... 9
2.1.3. Youth unemployment rates ... 10
2.1.4. Youth employment characteristics ... 13
2.2. What are the consequences?... 16
2.2.1. Delayed social integration ... 16
2.2.2. Disruptive social behaviour and armed conflict... 17
2.2.3. International migrations and brain drain ... 17
3. CAUSES OF THE YOUTH LABOUR MARKET DISADVANTAGE: A SUPPLY-SIDE PERSPECTIVE ... 18
3.1. Characteristics of the labour supply... 19
3.1.1. Weight of the young generations in the population and its likely evolution... 19
3.1.2. Rural-urban distribution of the young population ... 20
3.1.3. Education level of the workforce ... 20
3.2. Education, access to employment and returns to education training ... 21
3.2.1. Education and access to employment... 22
3.2.2. The private rate of returns to education (RORE) ... 23
3.2.3. Costs and benefits of vocational education and on-the-job training ... 26
3.2.4. Non-formal training and training in the informal sector ... 28
3.3. Access to other forms of capital ... 30
3.3.1. Social capital, ethnicity and access to employment ... 30
3.3.2. Access to land ... 32
3.3.3. Access to capital... 33
4. CAUSES OF THE YOUTH LABOUR MARKET DISADVANTAGE: A DEMANDE SIDE PERSPECTIVE... 34
4.1. Labour demand and wage flexibility ... 34
4.1.1. Ability of wages to decline over time ... 34
4.1.2. Tendency for wages to adjust in the face of unemployment ... 35
4.1.3. Wage differentials between sectors and/or firms of different size ... 35
4.2. Labour standards in Africa ... 37
4.2.1. Enforcement and coverage of labour standards ... 37
4.2.2. Example of Francophone West Africa ... 39
5. PUBLIC AND PRIVATE RESPONSES ... 40
5.1. Active labour market policies in Africa... 41
5.1.1. Public employment services... 41
5.1.2. Schemes to provide direct employment ... 42
5.1.3. Schemes to provide employable skills ... 43
5.1.4. Schemes to promote self-employment ... 44
5.1.5. Other schemes ... 45
6. CONCLUSION ... 46
STATISTICAL APPENDIX ... 58
List of tables
Table 1: Activity Rates by Age for Some Selected African Countries, Various Years (%) ... 58Table 2a: Activity Rates by Age and Sex (%)... 59
Table 2b: Activity Rates by Age and Sex in Congo (Dem.Rep.) and Cameroon. 2005 (%) ... 60
Table 3a: Youth and Overall Unemployment Rates in Selected Anglophone African Countries, Various Years ... 61
Table 3b: Youth and Adult Unemployment Rates in selected African Countries, Various Years ... 62
Table 4a: Unemployment Rates (*) by Age and Sex (%) ... 63
Table 4b: Unemployment Rates (*) by Age and Sex in Congo (Dem.Rep.) and Cameroon (%) ... 64
Table 5: Employment Characteristics of the Young (15-24), by Country... 65
Table 6a: Distribution of Employed Young Workers (15-24 years old) by Institutional Sector (%) ... 66
Table 6b: Distribution of Employed Young Workers (15-24 years old) by Institutional Sector in Congo (Dem. Rep.) and Cameroon, 2005 (%) ... 67
Table 7a: Incidence of Visible Underemployment (*) (%) ... 68
Table 7b: Incidence of Visible Underemployment (*) in Congo (Dem. Rep.) and Cameroon (%)... 69
Table 8a: Incidence of Invisible Underemployment (*) (%)... 70
Table 8b: Incidence of Invisible Underemployment (*) in Congo (Dem.Rep.) and Cameroon (%) ... 71
Table 9a: Mean Monthly Earnings by Age in PPA 1,000 CFA Francs (Main Activity) ... 72
Table 9b: Mean Monthly Earnings by Age in Congo (Dem. Rep.) and Cameroon (Main Activity) ... 73
Table 10: Rigidity of employment in Africa ... 74
Table 11: Who regulates employment the least – and who regulates employment the most?... 75
List of boxes
Box 1: Where do employment data come from? ... 8Box 2: Youth and unemployment in South Africa ... 13
Box 3: Why are youth unemployment rates higher than adult unemployment rates? ... 19
Box 4: The AFD study on job training in the informal sector... 29
Box 5: The informalisation of urban employment following crisis and structural adjustment ... 36
Box 6: Export processing zones in Africa, better job opportunities for youth? ... 39
List of figures
Figure 1a: Youth Labour Force Participation Rates by Region (1993 and 2003) ... 9Figure 1b: Activities Rates by Age in Urban Labour Markets (%) ... 10
Figure 2a:Youth vs. Adult Unemployment in Africa (%)... 11
Figure 2b: Youth vs. Adult Unemployment in Urban Labour Markets (%)... 12
Figure 3: Incidence of Invisible Underemployment by Age (%)... 15
Figure 4: Mean Monthly Earnings by Age in PPA 1,000 CFA Francs (Main Activity) ... 15
Figure 5: Share of the youth (age 15-24) in the total population, 1975-2025, by region (%)... 20
Figure 6: Percentage of Active Individuals Who Have Obtained Their Employment through Family or Personal Relationships (%) ... 31
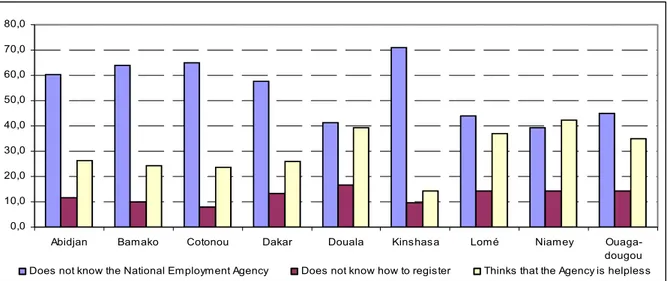
Figure 7: Share of the unemployed who are registered at the National Employment Agency (%) ... 41
1.
INTRODUCTION
Young people in Africa are confronted with many difficulties when it comes to their integration in the labour markets and their research for decent and productive jobs. Youth unemployment, which is substantially higher than global adult unemployment, has been growing in the last decade (ILO, 2006). The situation is likely to keep deteriorating as the total number of youth is expected to keep increasing rapidly in the next ten years2. By defining a specific target through the Millenium Development Goal concerning youth employment (Target 16) the international community has recognised the seriousness of the situation. However, in spite of the dramatic economic, social and political consequences (on poverty, social cohesion, migrations, etc.) of youth employment problems, the literature on African labour markets provides only very few studies focusing on this population. Following international standards, we define “youth” as people aged 15 to 24. This definition excludes children and therefore child labour issues.
This survey of literature focuses mainly on economic research done on Sub-Saharan Africa3, although some references are reviewed for North Africa. It stresses that an assessment of youth employment problems in African countries requires a (still missing) clear diagnosis based on hard data and analytical research on determinants of labour market participation and unemployment. Research on the links between formal education and on-the-job training and their economic returns are especially crucial in understanding inadequacy between labour supply and demand.
As shown by this research review, basic labour market indicators are lacking or are at best incomplete due to data availability and methodological problems. Worst, as illustrated below, different sources lead to opposite diagnoses concerning youth unemployment and its trends. In order to contribute to this badly needed diagnosis, we present some new evidence based on the 1-2-3 Surveys recently conducted in 10 African countries, which provides a consistent and comparable picture of the situation of youth employment in urban labour markets in these countries.
The literature survey also underlines the diversity of the situation of youth employment on the continent (Southern Africa vs. other African countries; Anglophone vs. Francophone countries, etc.). It also shows the “urban bias” in economic research on this subject, partly due to the lack of data on rural areas.
Section two begins by pointing out the main difficulties of monitoring youth employment given lack of data as well as methodology discrepancies among different available sources. Taking these difficulties into account, this section is devoted to putting forward the main stylized facts concerning youth employment in Africa, using both international statistics and existing survey data.
Section three addresses the main causes of poor youth employment performance by reviewing research done on labour supply characteristics, in order to grasp changes in labour force composition, and the extent of upgrades on labour force education. The issue of returns to education and training is discussed in detail. Research on the relative disadvantage of youth in the labour market in terms of access to social capital, land and capital is also reviewed.
Section four summarizes the main findings concerning the role of labour demand in relation to institutions. We review the research on the impact of labour standards and regulations. While being an opportunity for creating higher quality jobs, they are often considered to be, together with the lack of economic growth and investment, one of the main obstacles in creating more jobs in African countries. A review of policies and practices is carried out in the fifth section. African countries have been implementing several initiatives concerning employment for the last few years, some of them
2 In 2005, 62 percent of the population was below age of 25 and the total number of the youth (aged 15-24) is forecast to grow by an
additional 22 million between 2005 and 2015 (ILO, 2006:1). By 2010, the share of youth in the population in Sub-Saharan Africa will reach about 28 percent, making Africa the “youngest” region in the world (World Bank, 2006b: 2).
addressing the particular issue of youth employment. What can be said about the impact of these policies on improving labour market and income prospects for the youth? What are the lessons drawn from their successes or failures?
Sections four and five are more concise as the youth dimension is missing in most of the empirical literature relating to labour market institutions, growth and employment, and employment policies. Section six concludes.
2.
FACTS AND FIGURES: WHAT DO WE KNOW (AND DO NOT KNOW)
ABOUT YOUTH EMPLOYMENT IN AFRICA
Youth unemployment is a hot issue in the political agenda of both developed and developing countries. In spite of this common feature, existing empirical evidence and research shows that the nature of the problem is quite different in these two groups of countries. While in developed countries the youth's difficulties to get a job are related to lack of minimum professional skills required in the context of sophisticated production environments, in the case of developing countries, unemployment is generally found to rise with education levels. In the absence of unemployment insurance, only those with family (economic, social and demographic) resources can afford to wait in order to find a good match between their level of qualification and their occupations in the labour market. Conversely, most unqualified workers cannot afford to be unemployed and end up in the informal sector where productivity and revenues are low.
What are the nature and the extent of the problems faced by the young in Africa’s labour market? How have youth labour market outcomes changed in recent years? To these two questions, the picture provided by existing reports on the labour market situation of youth in Africa does not always provide clear answers. A noticeable exception concerns a recent World Bank report which is specifically devoted to this issue (World Bank, 2006b). Because reliable figures are lacking, most reports exploring the question of youth labour only focus on youth unemployment rates. This is doubly regrettable insofar as (1) unemployment rates are “only the tip of the iceberg in terms of fully explaining the multitude of employment-related problems facing youth” (ILO, 2004) and (2) the absence of regular data collections on employment and unemployment in many developing countries makes it impossible to estimate unemployment rates reliably. Notwithstanding these limitations, we present here some more detailed results on youth labour participation and labour characteristics stemming from comparable sources on a number of francophone Sub-Saharan countries. We also briefly review recent work on the consequences of youth unemployment.
2.1.
Youth employment in Africa
2.1.1. The challenge of monitoring youth employment
Monitoring youth employment in Africa meets two kinds of difficulties. First, there are conceptual issues relating to the specificities of African economies and labour markets. Labour markets in developing countries, and particularly in SSA, strongly differ indeed from those in developed countries. In particular, it is widely acknowledged that there are four types of labour markets, namely rural, public, private formal and informal4. These markets each have their specific characteristics, such as job seasonality and uncertainty about the level of demand, the nature of contracts and the structure of wages and earnings (Adams, 1991; Schultz, 2004). Formal wage labour is far less important than informal self-employment. Besides, there is no unemployment insurance and job search relies heavily on social and family networks instead of formal institutions. Also, the frontiers between activity and inactivity are fuzzy and this has an incidence on the unemployed and economically active population figures.
All this means that standard ILO labour indicators and methods should be adapted and complemented with other indicators in order to grasp the specificities of African labour conditions. For instance, according to the 1-2-3 Surveys conducted in several West African francophone capital cities, only 34.6 percent of occupied workers are, on average, wage earners, the remaining 65.4 percent being self-employed workers who created their own employment (Brilleau, Roubaud and Torelli, 2005). Thus, most often, searching a job in Africa amounts to relying on informal networks and/or gathering enough funds to establish as an informal street vendor or open a small service business. Moreover, rural wage labour markets are very thin: almost all occupied workers are informal, self-occupied non paid family workers. They are also subject to important seasonal variations and short-term migration is not uncommon. This means that using one-week recall periods may be well-suited in urban settings but is definitely ill-suited in rural areas. More generally, analysis of labour markets has tended to neglect rural Africa because of “an apparent lack of socio-economic phenomena that corresponds to the labour economists’ usual definitions of employment” (Leavy and White, 1999).
Given the widespread importance of informal sector employment, research on the economic returns to education and, more generally, research focusing on wage income alone can only provide a partial and biased picture of income-generating processes. Informal production units (IPU) are characterized by not carrying accounts. As a result, asking an informal worker how much he earned over the last 30 days through simple one-question (as is usually done in existing surveys) gives a much distorted figure of his real labour income. Informal workers generally do not know how much they earned over the last month. Part of the reason they do not know is because intermediate productive consumption and value added are concepts that are difficult to define and to measure in the case of IPUs. Thus special survey design, such as the one used in 1-2-3 Surveys, is needed in order to obtain a more accurate informal income measure (Razafindrakoto and Roubaud, 2003).
Apart from these conceptual issues, the lack of comprehensive, integrated and centralized databases on youth labour market and poverty outcomes in Africa remains a major barrier for analysing employment-linked poverty outcomes in the region. In the first place, it is important to recognize that when centralized databases with information on labour market outcomes exist, they usually contain stand-alone indicators of employment, unemployment and labour force, which do not allow a thorough analysis of youth labour market outcomes and the determinants of these outcomes. Moreover, one should be cautious with international comparisons, since data are generally comparable within countries but not necessarily across them (there is in particular a strong diversity in the definition of “youth” and unemployment).
Many reports from international agencies such as the United Nations (UN), the International Labour Organisation (ILO) and the World Bank (WB) have attempted to draw overall pictures of youth unemployment and underemployment in different parts of the world (ILO, 2006; UNECA, 2005; World Bank, 2006a; 2006b). In the case of Africa, however, lack of adequate and reliable data makes it difficult to properly assess youth labour force participation, youth unemployment and even more so youth underemployment (see Box 1). As an illustration, ILO’s main database on labour statistics, namely ILO/LABORSTA, which supposedly covers household income and expenditure statistics, economically active population, employment and unemployment by detailed occupational group and sex for more than two hundreds countries and territories only has data on youth unemployment for eleven African countries5, among which only seven are in SSA. Similarly, the UN Youth Employment Statistics section has data on youth unemployment for only few countries. Given such a poor geographical and temporal coverage of the African continent, few stylized facts emerge from this literature. In addition, the lack of reliability of the data often leads to contradictory conclusions.
Box 1: Where do employment data come from?
Data used to measure unemployment, employment and underemployment are drawn from household surveys or population censuses. However, censuses in Africa are very infrequent (many African countries have not conducted a census for the last 20 years) which causes high sampling errors for household surveys.
1. Household surveys
Living Standards Measurement Surveys (LSMS). Promoted by the World Bank, these surveys have been an
important tool in measuring and understanding poverty in developing countries for the last two decades. They collect data on many dimensions of household well-being, including consumption, income, savings, employment, health, education, fertility, nutrition, housing and migration. While the measurement of consumption is strongly emphasized in the questionnaires, the employment module is comparatively short and most questions have the last week as the reference period, which is not always adequate for rural work (CDPR, 2005). Because of the lack of other sources of information, these surveys are the most commonly used for employment analyses.
Labour Force Surveys (LFS). These surveys are standard household-based surveys of work-related statistics
and should constitute as such the main source of employment data. However, they have been conducted on a very irregular basis and with substantial lags in many developing countries. Less than 10 African countries have conducted one LFS since 1990 (CDPR, 2005).
The World Bank is putting a lot of efforts to collect and harmonise micro-datasets on SSA through its Survey-based Harmonised Indicators Project (SHIP). The SHIP will provide comparable and comprehensive socio-economic indicators for African countries.
1-2-3 Surveys. In the case of French-speaking African countries, for which available evidence on youth labour
market is particularly poor, the 1-2-3 Surveys conducted recently in seven West-African economic capital cities (namely Abidjan, Bamako, Cotonou, Dakar, Lome, Niamey and Ouagadougou), in Madagascar (Antananarivo, where an annual series is available over more than ten years), in Cameroon and in the Democratic Republic of Congo are (to date) probably the most reliable data source providing harmonised labour market statistics in Africa6. Exploitation of the data has been undertaken by DIAL7 in collaboration with National Statistical Institutes (Brilleau et al. 2004) and a book entitled “Urban Labour Markets in Sub-Saharan Africa” is forthcoming.
2. International databases
International databases on employment use household surveys and census data when available. Such databases include the ILO database on Labour Statistics (LABORSTA), the World Development Indicators (WDI) computed by the World Bank, and the FAO labour statistics (FAOSTAT). Another problem with existing centralised databases is that information on youth outcomes is often incomplete for many African countries. For instance, the FAO database does not contain labour data by age group. And while the LABOURSTA and the WDI databases contain specific indicators on youth employment and unemployment, these indicators are barely available for all countries in Africa and for more than a few years.
Besides the poor coverage of youth labour market outcomes, a further issue is that reported indicators of labour market outcomes are not always consistent across databases. For instance, there are non-negligible discrepancies between FAO and WDI data on the one hand, and ILO data on the other. This is probably due to the use of different data sources and methodology.
In fact, the main part of the problem is due to the lack of an integrated statistical programme addressing labour market issues on the continent. In most countries of the world, led by developed countries, but also in the developing countries of Latin America, Asia, North Africa, etc., i.e. everywhere except SSA (with the noticeable exception of South Africa), labour force surveys (LFSs) play a central role in the system of statistical information on household. This diagnosis formulated more than 15 years ago (Roubaud and Séruzier, 1991) is still relevant today, in spite of a constant advocacy to promote such a type of surveys (Rakotomanana, Ramilison and Roubaud, 2003). This
6 The first 1-2-3 Survey was conducted in Yaoundé, Cameroon in 1993. The methodology was then applied to Antananarivo, Madagascar in
1995 and extended to the seven main urban centres of Madagascar in 2000 and 2001. Today, 1-2-3 Surveys have been conducted in many parts of the world including Latin America (El Salvador, Bolivia, Colombia, Equator, Peru, Venezuela in 2002-2003), Africa (Morocco in 1999-2000, capital cities of the WAEMU in 2001-2003, and Madagascar in 1995-2006, Cameroon in 2005, Democratic Republic of
continental exception, which can be explained by historical reasons, is a surprising paradox, when one considers that most Africans, especially the poor, derive their income (be it in money or in kind) from work. One of the main objectives of the 1-2-3 Survey is specifically to fill this gap. The recent key focus of development policies on poverty alleviation is a cogent argument for the inclusion of a permanent employment monitoring system, since access to paid and productive jobs is the best way of escaping poverty.
2.1.2. Youth labour force participation
Youth participation rates everywhere are found to be less than those of the adult population. However, due to data limitations, there is no definitive answer to the question of whether youth participation rate in SSA has increased or decreased over the recent period
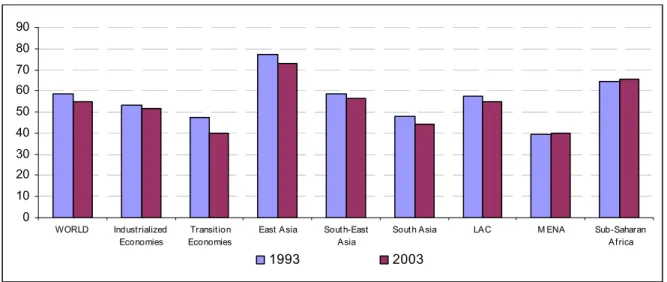
According to ILO’s Global Employment Trends for Youth 2004, youth labour force participation rates decreased in the world as a whole by almost four percentage points between 1993 and 2003 (Figure 1a). This trend is mainly the result of an increasing number of young people attending school and/or staying in the education system for longer periods of time. In SSA, however, the youth labour force participation rate is found to have increased over the period even though it was already one of the highest in 1993. According to the report, this increase could be the result of an overall trend of women participating more in the labour market.
Figure 1a: Youth Labour Force Participation Rates by Region (1993 and 2003)
0 10 20 30 40 50 60 70 80 90 WORLD Industrialized Economies Transition Economies
East Asia South-East Asia
South Asia LAC M ENA Sub-Saharan
Africa
1993 2003
Source : Global Employment Trends for Youth, ILO Annual Report 2004
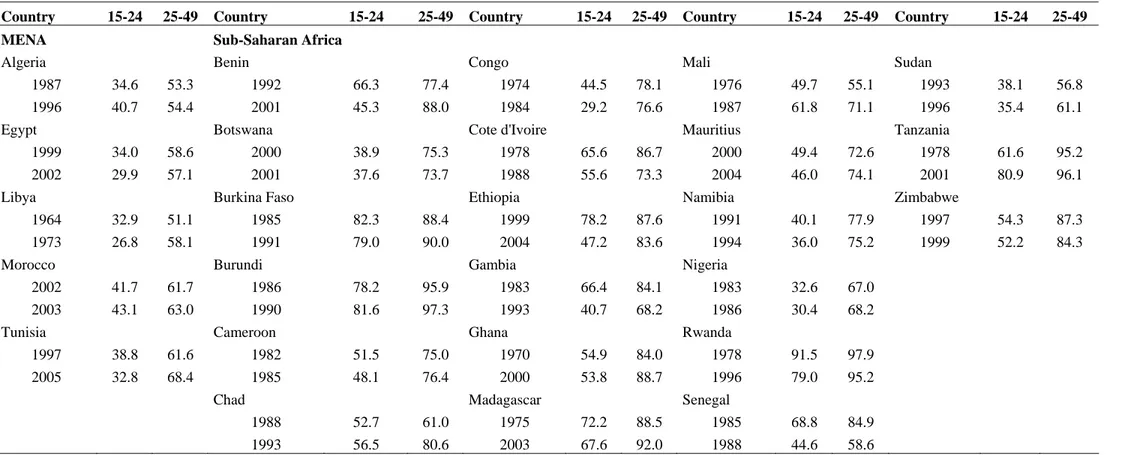
Existing evidence on such an increase in youth participation rates for the African continent is rather weak, though. Table 1 in Appendix reports youth and adult labour market participation rates for some selected African countries computed by the authors of the present report using the ILO/LABORSTA database. For most of the countries for which data are available8, the youth (15-24) participation rate is actually found to have decreased over time, while the adult (25-49) participation rate is found to have generally increased. Such a widening gap between youth and adult activity rates could reflect either the delayed entry of young in the labour market due to later school termination or an increasing number of young people too discouraged by limited job opportunities to even enter the labour force. Evidence on the former point is given by Antoine, Razafindrakoto and Roubaud (2001) in the capital cities of Cameroon, Madagascar and Senegal.
On the other hand, what clearly emerges from the data is the strong heterogeneity across African countries in both youth and adult participation rates. For example, Burkina Faso, Burundi and Rwanda
8 The list of included countries is: Algeria, Benin, Botswana, Burkina Faso, Burundi, Cameroon, Chad, Congo, Côte d’Ivoire, Egypt,
Ethiopia, Gambia, Ghana, Libya, Madagascar, Mali, Mauritius, Morocco, Namibia, Nigeria, Rwanda, Senegal, Sudan, Tanzania, Tunisia and Zimbabwe.
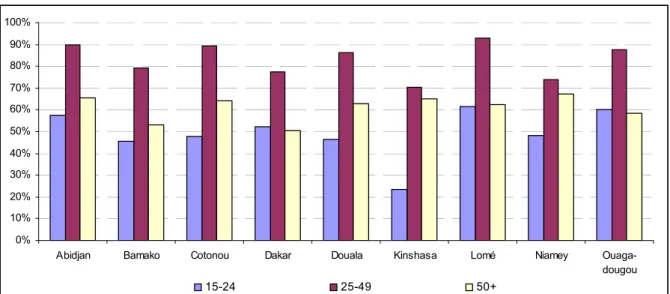
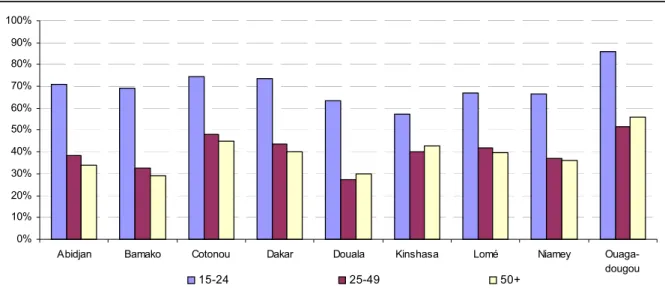
have rather high labour force participation rates while Botswana, Nigeria and Congo are clear outliers on the low side (see Table 1 in Appendix). However, the reasons for this variation are not immediately apparent and merit more detailed investigation even though we suspect that part of the differences between countries may be due to the lack of comparability in labour market definitions across surveys. Measurement errors are not the sole explanation, however, as a variation in youth activity rates between countries is also observed using homogenized labour market statistics computed from the 1-2-3 Surveys. As shown by Figure 1b, activity rates rapidly increase as the young leave school and enter the labour market. The proportion of young actives is the highest in Lome, Abidjan and Ouagadougou while it is rather low in Kinshasa. In Abidjan and Cotonou, girls are much less likely to be enrolled in school than boys and this is reflected in labour market indicators as youth activity rates for young females are much higher than for young males (see Table 2a in Appendix).
In Cameroon and the Democratic Republic of Congo, where 1-2-3 Surveys were conducted at the national level, there are sharp differences in youth and adult activity rates between rural and urban areas (see Table 2b in Appendix). Activity rates in rural areas are in particular more than twice as high as those in urban areas among individuals aged 15-19, suggesting earlier school termination and higher labour absorptive capacity in rural areas. However, high rural activity rates are often associated with a significant amount of underemployment (see below).
Figure 1b: Activities Rates by Age in Urban Labour Markets (%)
0% 10% 20% 30% 40% 50% 60% 70% 80% 90% 100%
Abidjan Bamako Cotonou Dakar Douala Kinshasa Lomé Niamey
Ouaga-dougou
15-24 25-49 50+
Source: 1-2-3 Surveys. Phase 1 (labour force survey). 2001-2005. National Statistical Institutes. AFRISTAT. DIAL ; authors' computations.
2.1.3. Youth unemployment rates
Evidence from international agencies reports
Five main observations concerning youth unemployment in Africa can be made.
(1) In spite of the lack of consensus regarding SSA’s position relative to other parts of the world in terms of youth unemployment, the statement of the World Bank’s World Development Report 2007 according to which SSA would have the lowest youth unemployment rate is likely to be correct.
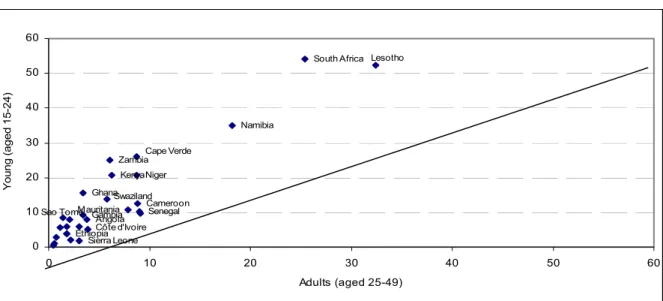
(2) Despite all the problems of consistency that afflict employment statistics in Africa, youth unemployment rates are consistently higher than overall unemployment rates with strong variation among countries (Figure 2a and Tables 3a and 3b in Appendix). The ratio of the former to the latter varies from 1.5 to as much as 4, although in most cases the rate of youth unemployment is about twice as high as the adult unemployment rate. For both the young and the adults, unemployment rates appear particularly strong in countries in Southern African and, to a lesser extent, in Cape Verde (see Box 2 for a detailed description of the South African case).
Figure 2a: Youth vs. Adult Unemployment in Africa (%)
Ethiopia Sierra Leone
GambiaAngola Senegal Mauritania Côte d'Ivoire Cameroon Swaziland Ghana Kenya Zambia Niger Cape Verde Lesotho South Africa Namibia Sao Tomé 0 10 20 30 40 50 60 0 10 20 30 40 50 60 Adults (aged 25-49) Y o u n g ( aged 1 5 -24)
Source: World Development Report 2007, Table A3, pp. 274-275
(3) Although data are scarce, there is suggestive evidence in Africa in general that youth unemployment rates are higher in urban areas than in rural areas (see, e.g., UCW preliminary report, p.13; World Bank, 2006b:27).
(4) Youth unemployment rates are generally found to be higher among females than males, but there are exceptions. Young males are more likely than females to be unemployed in São Tomé and Principe and Zambia, for example (World Bank, 2006b: 26)
(5) Although the relationship between educational attainments and employment outcomes is not always clear (Kanyenze, Mhone and Sparreboom, 2000), higher educational attainment in the form of secondary and tertiary education does not lead to a decrease in the unemployment rate for youth (on the contrary, unemployment is sometimes found to increase with education, see World Bank, 2006b: 36).
Evidence from 1-2-3 Surveys
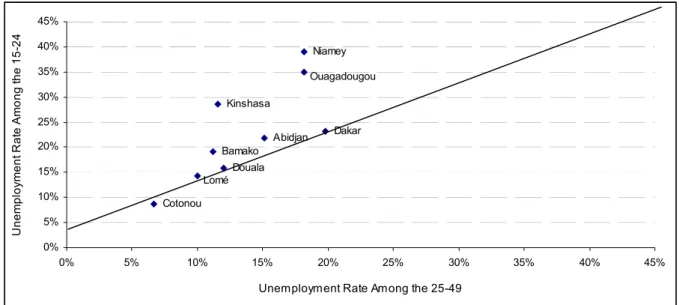
Recent labour force surveys (namely 1-2-3 Surveys, Phase 1) conducted in the economic capital cities of seven West African Economic and Monetary Union (WAEMU) countries, in Cameroon and the Democratic Republic of Congo produce comparable and reliable labour market statistics. Concerning youth unemployment levels, data confirm the relative disadvantage of the young compared to the adults. In all capital cities, indeed, youth unemployment rates are consistently higher than adult unemployment rates, especially when the “young” category is restricted to the 20-24 years old (Figure 2b and Table 4a in Appendix). The youth disadvantage is particularly strong in Niamey, Ouagadougou and Kinshasa.
By contrast, gender differences are not uniform across countries. While Abidjan, Dakar, Douala, Niamey and Ouagadougou display higher proportions of female unemployment among the young, the reverse is true for Kinshasa, Lome and, to a lesser extent, Bamako and Cotonou. If we now turn to Cameroon and the Democratic Republic of Congo, Table 4b in Appendix shows that the difference in both youth and adult unemployment by location (rural vs. urban) is very large: the unemployment ratio for urban young people is respectively seven and five times higher than that of rural young people in the Democratic Republic of Congo and in Cameroon. These figures highlight the contrasted nature of rural and urban labour markets and the important role that the agricultural sector plays in absorbing young rural workers.
Figure 2b: Youth vs. Adult Unemployment in Urban Labour Markets (%) Kinshasa Niamey Bamako Douala Cotonou Abidjan Dakar Ouagadougou Lomé 0% 5% 10% 15% 20% 25% 30% 35% 40% 45% 0% 5% 10% 15% 20% 25% 30% 35% 40% 45%
Unemployment Rate Among the 25-49
Une m pl o ym e nt Ra te A m on g t h e 1 5 -2 4
Source: 1-2-3 Surveys. Phase 1 (labour force survey). 2001-2005. National Statistical Institutes. AFRISTAT. DIAL ; authors' computations. Evidence from country-case studies
Representative national or sub-national surveys provide a rich source of information on the situation of the youth on labour markets in African countries. However, country-case studies focusing on this specific issue are rather scarce. Exceptions, focusing on urban employment, include Burkina Faso, Ethiopia and South Africa9. Their results are consistent with the above mentioned studies. In the case of Burkina Faso, Calves and Schoumaker (2004)10 estimate that the unemployment rate among young men (aged 15-24) in the two main cities is about 40 percent, that is 2.5 times higher than that of men aged 25-34 and 8 times higher than that of men aged 35-44. For women, unemployment rates are higher than those of men at all ages, and the same youth disadvantage can be observed. The authors estimate that the youth unemployment rate among men was about 30 percent in 1980, which corresponds to an increase of 10 points in twenty years. In urban Ethiopia, Serneels (2004) estimates that 50 percent of active men aged 15-30 are unemployed. The incidence of unemployment is the highest at the ages of 19-20 (around 70 percent) and falls afterwards to reach a constant level beyond age 30 (around 20 percent).
9 The second volume of the 2006 World Bank Report entitled “Youth in Africa’s Labor Market” actually contains four other country case
studies (Burkina Faso, Ethiopia, Tanzania and Uganda) based on representative national surveys. Due to space limitations, their results are not reported here.
Box 2: Youth and unemployment in South Africa
The characteristics of unemployment in South Africa have several main specificities, compared with the rest of SSA (Burger and Woolard, 2005; Mlatsheni and Rospabe, 2002).
1/ The unemployment rate is extremely high (respectively 41 percent and 29 percent in 2002 according to the expanded or narrow definitions, among the highest worldwide), and the youth unemployment rate is even higher (70 percent using the expanded definition); the youth represent 76 percent of the unemployed. The very high unemployment rate indicates that the informal sector is not absorbing much surplus labour; it is not fulfilling as elsewhere its role of “last resort employer”.
2/ The wide gap between the narrowly-defined unemployment rate and the “expanded” one is due to the very high percentage (around 12 percent of the active population) of discouraged workers. Many of the non-searching unemployed live in remote areas with high unemployment rates (Kingdon and Knight, 2000). A survey (see Kanyenze et al., 2000; du Toit, 2003) illustrates the discouragement of unemployed South African youth and the difficulties they face in searching for a job. The existence of a reservation wage is investigated by Nattrass (2002a) in two Cape Town townships.
3/ Indeed, the percentage of workers employed in the informal sector is relatively low (28 percent), which is much smaller than in many other developing countries especially in Africa. Since 1995, about one third of the newly created jobs have been in the informal sector where jobs are poorly paid and insecure, so that the quality of employment has deteriorated. These jobs have been mostly taken by African unskilled and semi-unskilled females (Casale and Posel, 2002).
4/ South African workers are mostly urbanised (less than 40 percent of the labour force reside in rural areas); the unemployment rate is much higher in rural than in urban areas (48 percent vs. 37 percent); it is especially high in areas previously classified as homelands; subsistence agriculture plays a much less important role than in other developing countries, where unemployment is typically lower in rural than in urban areas; the existence of rural unemployment (virtually inexistent in the rest of SSA) is made possible by social (such as old-age pensions) and urban migrants transfers.
5/ Most unemployed workers are unskilled (or semi-skilled); having completed secondary or some form of tertiary education substantially reduces the probability of being unemployed. The reverse is true elsewhere especially in WAEMU countries.
6/ Last of all, unemployment has a strong racial dimension; the unemployment rate for Africans (who have on average the lowest qualifications) amounts to 48 percent, compared to only 10 percent for Whites, unemployment rates for Coloureds (32 percent) and Indians (25 percent) being in between.
These characteristics can be explained by the specificities of South Africa on the continent: development level, history and the heritage of apartheid, etc. It seems that other Southern African countries (Lesotho, Swaziland, etc.), which are strongly integrated with the South African economy and labour market, share some of these characteristics.
The issue of the so-called rigidities on the labour market and their impact on the labour content of growth are strongly debated in South Africa as in the rest of Africa: have the existing labour regulations a negative impact on job creations, leading to youth unemployment? Some surveys rank South African laws among the most rigid (World Bank, 2006a). However, the causal relationship between these rigidities and the high unemployment rate has not been well established yet. (A more detailed discussion on labour market rigidities is provided in Section 4.2).
2.1.4. Youth employment characteristics
Data on youth employment characteristics (underemployment, employment by sector and occupation, wage level, job satisfaction, etc.) are even scarcer than data on youth participation and youth unemployment rates.
Using World Bank Standard Files and Standard Indicators (SFSI) datasets, the UCW preliminary report provides some figures on the distribution of young workers by sector for a few African countries (see Table 5 in Appendix). Workers fall into four main groups: wage employment, informal sector employment, self-employment and other. Self- and informal employments account for the overwhelming majority of young workers in both rural and urban areas. The high level of informal employment in most countries may be a sign of labour market entry difficulties. It may also be
synonymous of low employment quality since informal jobs are generally less secure jobs in which labour and safety regulations do not apply.
Based on four country-case studies, namely Tanzania, Ethiopia, Burkina Faso and Tanzania, the 2006 World Bank Report entitled Youth in Africa’s Labor Market provides some figures on youth time-related underemployment. According to the report, 6 percent of young men and more than 10 percent of young women report being underemployed in Tanzania. In Ethiopia, underemployment is high in rural areas, with the average worker working less than 30 hours a week, according to the 1999 Labour Force Survey. In Burkina Faso, about 16% of all workers feel that they are under-employed.
Using tracer surveys11, Al-Samarrai and Bennell (2006) provide an in-depth description of the labour market outcomes of secondary school and university leavers in four Anglophone African countries (Tanzania, Malawi, Uganda and Zimbabwe). The authors find no evidence of widespread and growing open unemployment among educated youth. While the activity profile for university graduates has not changed for the last 20 years (with wage employment dominating), there has been marked changes during the 1990s in all four countries for the secondary school leavers (with wage employment opportunities declining over the period and self-employment becoming an increasingly important source of income).
In addition to providing harmonised data on youth participation and unemployment rates, one of the original features of 1-2-3 Surveys is to make available rich and reliable information on the employment characteristics of the young. First, data reveal that in all capital cities the bulk of youth employment is in the informal sector (Tables 6a and 6b in Appendix)12. While about three quarters of all the employed are found in the informal sector in each country (80 percent in Cotonou and Lome), this proportion is as high as 90 percent among the sole young, reflecting strong labour market entry difficulties. By contrast, almost no young people are found in the public sector. The young have indeed been strongly penalized by the freezing of new recruitments in this sector. Though their figures concern urban Burkina Faso and first jobs only, Calves and Schoumaker (2004) reach the same conclusion: while 13 percent of young men had their first job in the public sector in 1980, they were only 8 percent in 1990 and about 3 percent in 2000. The same evolution is observed for the formal private sector, with the share declining from 10 percent to 5 percent between 1980 and 2000. Back to 1-2-3 Surveys, gender differences are mostly found in the proportion of young working in the formal private sector. The latter is always higher for young male workers than for young female workers. Second, data suggest that the situation of the young and the adults is more or less the same with respect to time-related underemployment. Be they in their twenties or their forties, between 10 percent and 15 percent of the workers work less than the legal duration of working hours but are willing and available to work more, except in Douala and Kinshasa where this proportion is higher (Table 7a in Appendix). Young women fare worse than young men in all capital cities. In the case of Cameroon and the Democratic Republic of Congo for which data are available at the national level, the same feature prevails: the incidence of visible underemployment is as high for the young as for the adults (Table 7b in Appendix). It is however much higher in the Congo (around 32 percent) than in Cameroon (19 percent). Last, no clear pattern emerges when comparing the situation in rural and urban areas.
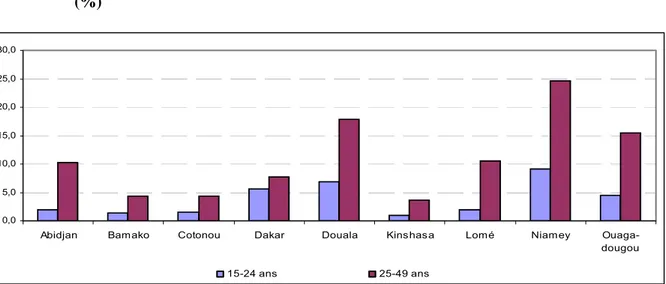
On the other hand, there are marked differences between young and adults in terms of invisible underemployment where invisible underemployment includes all workers earning less than the minimum hourly wage (Figure 3 and Table 8a in Appendix). Despite variation in levels between capital cities, the incidence of invisible underemployment among the young is almost twice as high as that of adults in most cities except Kinshasa where the difference is less strong. It is thus very likely that the share of working poor is higher among young people than among adults. As for visible underemployment, young women are found to be more concerned than young men. The cases of
11 Tracer surveys aim to track down a group of individuals with a specific education/training background and systematically gather
Cameroon and the Democratic Republic of Congo finally suggest that the incidence of invisible underemployment is higher in rural areas than in urban ones (Table 8b in Appendix).
Third, being less experienced and working less hours than older workers, young people are also found to earn significantly less than their older counterparts (Figure 4 and Tables 9a and 9b in Appendix). However, as noted by ILO’s Global Employment Trends for Youth 2004, the question of how much ‘less’ is acceptable and how much ‘less’ reflects discrimination against young people is very hard to judge and requires more detailed statistical analyses that are beyond the scope of this report.
Figure 3: Incidence of Invisible Underemployment by Age (%)
0% 10% 20% 30% 40% 50% 60% 70% 80% 90% 100%
Abidjan Bamako Cotonou Dakar Douala Kinshasa Lomé Niamey
Ouaga-dougou
15-24 25-49 50+
Source: 1-2-3 Surveys. Phase 1 (labour force survey). 2001-2005. National Statistical Institutes. AFRISTAT. DIAL ; authors' computations. Figure 4: Mean Monthly Earnings by Age in PPA 1,000 CFA Francs (Main Activity)
0 20 40 60 80 100 120 140 160 180
Abidjan Bamako Cotonou Dakar Lomé Niamey Ouagadougou
15-24 25-49 50+
Source: 1-2-3 Surveys. Phase 1 (labour force survey). 2001-2003. National Statistical Institutes. AFRISTAT. DIAL ; authors' computations. Last, 1-2-3 Surveys provide various indicators on youth and adult job satisfaction that complete the picture of labour market conditions for young people (Brilleau et al., 2005). Among employed youth, 35 percent are satisfied with their job and do not plan to look for another job in the near future. Surprisingly enough, this proportion does not significantly vary between sectors: it amounts to 37 percent in the public sector against 36 percent in the informal sector. On the other hand, 51 percent of the employed young would like to get a new job. This proportion decreases with age and income in all capital cities. This means that pressure on the labour market comes not only from the unemployed but also, and in a substantial proportion, from those already employed but dissatisfied with their job. Finally, the wishes expressed by the young reveal a strong mismatch between their preferences and
real job opportunities. 27.2 percent of the young would like to get a job in the public sector whereas only 4 percent of new jobs were created in this sector during the year preceding data collection. By contrast, the informal sector appeals to only 48.4 percent of the young even though 81.7 percent of new jobs were created in this sector. The same kind of results is obtained by Serneels (2004) in the case of Ethiopia. According to the author, half of the young unemployed in urban Ethiopia are looking for a job in the public sector, in spite of the lack of new recruitments. These results suggest that strong disillusions among the young are to come, that could well give rise to severe political and social tensions.
2.2.
What are the consequences?
The situation of youth on African labour markets has many economic, social and political consequences: first of all, the absence or weakness of labour income negatively affects the welfare of the youth in a broad sense13, while their vulnerability to negative shocks increases their probability of becoming or staying poor. According to ILO (2006), the number of youth working poor in Africa (near 60 percent of total youth employment) is increasing. However, this issue does not seem to have been studied in depth yet in the economic literature.
Other consequences include: a delayed social integration and modification of their demographic behaviour; disruptive social behaviour and participation to armed conflicts; migrations, etc. We review hereafter existing evidence and studies on these three other types of consequences.
2.2.1. Delayed social integration
Several recent studies provide evidence on the relationship between youth unemployment (or, more broadly, access to employment) and social integration.
The problem of delayed social integration has been analysed in the case of three African cities by Antoine et al. (2001). Using biographical data from surveys of inhabitants of Dakar, Yaoundé and Antananarivo, they show that social integration has been delayed for urban young adults with regard to three main events: access to the first job, marriage, and residential autonomy. The researchers put forward the hypothesis that difficult access to the first job and the lengthening of studies lead young men to put off their marriages by between 5-10 years. Because, contrary to many European countries, residential autonomy is the last step to be taken for young people before their independence, the percentage of those who have left the parental household at the age of 25 is falling sharply (only one fourth for the younger generation in Dakar).
In South Africa, Klasen and Woolard (2005) provide some evidence of similar mechanisms. Analysing household surveys conducted in 1993, 1995 and 1998, they find that the household formation response of the unemployed is the critical way by which the unemployed assure access to resources. In particular, unemployment delays the setting up of an individual household by young persons, in some cases by decades. It also leads to the dissolution of existing households and a return of constituent members to parents and other relatives and friends.
In rural areas, some evidence also supports the finding of delayed social autonomy for young adults. According to Ayalew, Dercon and Krishnan (2000), young adults in rural Ethiopia have more and more difficulties accessing to land. As a result, they end up dependent on their families and farm plots are subdivided into ever smaller parcels. In a village of North-Western Rwanda, André and Platteau (1998) also find that young adults have difficulties leaving their parents and setting up their own households. More specifically, they find that, between 1988 and 1993, the proportion of children in age of marriage (20 to 25 years old) but still living with their parents has increased more than two fold.
2.2.2. Disruptive social behaviour and armed conflict
Social behaviours that have negative externalities on the economy are also frequently cited as a consequence of the situation of young people on the labour market.
The combination of poverty and reduced social contacts faced by unemployed young people, especially urban migrants, may lead them to engage in criminal activities, drug addiction or prostitution14. Apart from the fact that they increase health hazard, these activities further take young people away from the “normal” labour market. According to Nattrass (2002b), crime and violence have been increasing in many parts of SSA among unemployed young people. Youth gangs typically satisfy the economic and social needs of unemployed young people through violence. Sustained unemployment could cause young people to be hostile to the world of work and more receptive to drugs and crime. This has also been documented in the case of Rwanda before the civil war by Maton (1994).
While it would certainly be an exaggeration to claim that youth unemployment is directly responsible for the high prevalence of civil conflicts on the African continent, it is likely that the availability of young unemployed men, possibly involved in criminal activities or addicted to drugs, fuels these conflicts. In the context of the current age profile of African populations, the quite widespread shortages of opportunities for regular productive employment or self-employment create conditions in which it is hardly surprising if many youths do not need to be coerced to join in civil war (Austin, 1999). This fact has been mainly documented in the academic discussion of the Liberian and the Sierra Leonean wars which has focused on the role of the poor, socially marginal young males (see for instance Peters and Richards, 1998). In a recent study on Sierra Leone, Richards, Bah and Vincent (2004) show that the conflict was fought primarily by unemployed marginalized young men coming mainly from rural areas.
In a relatively recent paper, Urdal (2004) empirically tests the notion that “youth bulges” – historically large youth cohorts relative to the total population – make countries more susceptible to armed conflict. This assumption is tested in an event history statistical model covering a high number of countries and politically dependent areas over the period 1950-2000. The study provides support for the hypothesis that youth bulges increase the risk of domestic armed conflict, and that the combination of youth bulges and poor economic performance can be explosive. The authors also argue that the lack of support of the youth bulge hypothesis in previous World Bank studies (Collier, 2000; Collier and Hoeffler, 2001) results from an empirical misspecification of the youth bulge measure.
2.2.3. International migrations and brain drain
McKenzie (2006) shows that, generally, people around 20 years old have a higher propensity to migrate (in the case of the United States, the distribution curve of male immigrants’ age peaks at 20); but that skill immigration criteria, like those applied by Canada, tend to increase the age of immigrants. Moreover, he finds that young people represent a higher proportion of the flow of international migrants than the stock. In other words, the average youth immigrant is much more likely to have recently arrived in the host country than older migrants.
Narayan and Petesch (2006) show that, in Morocco, the difficulty of obtaining good jobs locally feeds emigration. Facing poor job prospects, young men and women see migration overseas as the best way to have a better life, and regularly save money to emigrate legally or illegally abroad. This positive view of migration is shared by adults who consider migration as one of the main factors helping the best-off households, and as a way out of poverty.
Based on two complementary databases made available only recently on the stocks of international migrants in OECD countries (Docquier and Marfouk, 2006; Dumont and Dumaître, 2004), Gubert and
14 ILO (2005) reports that unemployment has driven many young women and girls into sex work. The lack of job opportunities and their
disadvantageous social role, both in terms of assets (education and health) and cultural norms, make them more likely to end up as sex workers. The demand for commercial sex workers from international tourism flows to Africa is on the rise.
Nordman (2006) provide a detailed picture of the levels, trends, determinants and prospects of migration from the Middle East and North Africa (MENA) region to OECD countries. The authors show that the expatriation rates of the most educated migrants are the most reactive ones to the population density in the origin country. One interpretation of this finding is that the brain drain is responsive to demographic pressure in the origin country. In particular, the share of the young in the origin population is found to exert a positive influence on expatriation rates suggesting that migration flows are predominantly composed of young people.
Finally, some authors argue that skilled migration may induce positive effects on developing countries under certain conditions (Docquier, 2006; Docquier and Sekkat, 2006). From some macroeconometric studies reviewed in Docquier (2006), the author finds that the threshold emigration rate above which the brain drain becomes harmful for development can be prudently estimated between 15 and 20 percent in low-income countries. The average optimal emigration rate (which maximizes country gains) probably lies between 5 and 10 percent. Docquier (2006) finally observes that “unfortunately, many poor regions such as Sub-Saharan Africa and Central America, are well above that "optimal" threshold”.
Knowledge gaps:
There are still huge knowledge gaps to be filled. In particular and as suggested above, comprehensive and comparable data on urban and rural labour markets are missing and concepts and definitions appear to be ill-suited for studying labour market in rural areas. Also, little is known about the working conditions of employed young people. In rural areas, both agricultural and non-agricultural labour markets deserve more attention.
With regard to migration issues, the empirical literature remains poor to guide policymaking. As suggested by Docquier (2006:24), “it would be helpful to build new micro survey explicitly conducted to capture the relationship between emigrants and their country of origin, to collect more data and case-studies on the sectoral impact of the brain drain, to improve the time dimension in available macro data sets, and the quality of human capital indicators of residents”.
3.
CAUSES OF THE YOUTH LABOUR MARKET DISADVANTAGE: A
SUPPLY-SIDE PERSPECTIVE
In this section, we focus on the supply side of youth employment. We describe the main characteristics of the youth workforce (weight in total population, education, etc.) and review the evidence on the link between human capital (including on-the-job training) and access to employment as well as returns to education. Indeed, young people are often at the end of the job queue for the formal labour market because they lack adequate skills and experience, as well as efficient social networks (see Box 3). We also present the results of studies on the individual impact on employment of possessing some other forms of capital (social capital, land and physical capital).
Box 3: Why are youth unemployment rates higher than adult unemployment rates?
According to ILO (2006), there are many likely explanations15 (for the case of south-east Europe, see also Kolev and Saget, 2005),
- The last-in, first-out explanation. Youth are more vulnerable than adults in difficult economic times. They are likely to have less work experience than adults. Assuming that employers seek employees with past experience, the youth who is entering the labour force for the first time will be at a disadvantage and have a harder time finding employment vis-à-vis an adult with a longer history of work experience. In times of surplus labour competing for a limited amount of jobs, the youth will be the “last in”. Similarly, because a younger worker is likely to have less tenure than an adult worker, less company funds invested in them for training purposes and to have a temporary contract, it will be considered cheaper to let the younger worker go in times of economic downturns. Thus, young workers will be the “first out”.
- The lack of job search experience explanation. A young person often lacks both labour market information and job search experience. In many developing countries, it is only through informal placement methods – typically through family and friends – that a young person finds work. Beyond the word of mouth approach through families and friends, they simply might not know how and where to look for work. Adults, on the other hand, might have the possibility of finding future work through references from previous employers or colleagues and are more likely to know the “right” people.
- The “shopping around” explanation. Another possibility is that youth might take longer to “shop around” for the right job, meaning they might wait longer to find work that suits their requirements. This, however, implies that a support structure, such as the family, exists to economically support them while they search for work. In low-income countries, this support structure does not exist for the majority of young people and as a result, a young person simply cannot afford to be unemployed and is likely to take whatever work becomes available, regardless of working conditions or whether or not the job fits his/her education or skills-base.
The explanations given above are a mixture of demand-side causes and supply-side causes that are analysed in sections 3 and 4 together with more general analyses of unemployment in Africa and offer-demand mismatch. The “shopping around” behaviour explains well in our view (but not exclusively) the high unemployment rate of educated people.
3.1.
Characteristics of the labour supply
3.1.1. Weight of the young generations in the population and its likely evolution
In a macroeconomic perspective, the weight of the young generations in the population is often invoked as one of the causes for the difficult insertion of the new generations on the labour market (UNECA, 2005).
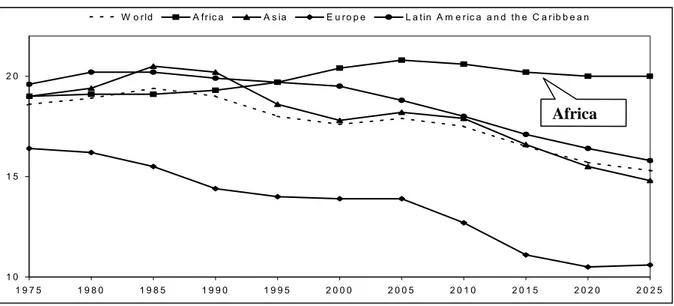
The youth currently represents 21 percent of the African population, compared to about 18-19 percent for other developing regions (Asia and Latin America) and 14 percent in Europe. Available country data indicate that some African countries have fairly higher youth’s shares than others.
While the share of the youth in the total population has started to decrease markedly in major developing regions and in the world as a whole since the mid-eighties, this is not the case in Africa, where the share of the youth can be estimated to stop increasing around 2005 (see Figure 5)16. No strong decline of the youth’s share in the labour force can therefore be expected in the medium run.
15
We only refer here to the explanations which seem adequate for African countries.
Figure 5: Share of the youth (age 15-24) in the total population, 1975-2025, by region (%)
Source: UN World Population Prospects: The 2004 Revision
According to ILO calculations, in SSA “the youth labour force is expected to grow in pace with the adult labour force at least until 2015 despite the HIV/AIDS pandemic which seems to have a bigger impact on young people” (ILO 2004, p.3). There are however differences among African countries: the share of the youth declined in Morocco between 1995 and 2002, while it increased in Algeria during 1995-2000; over a comparable period, it rose sharply in Benin but fell in Mauritius, etc. These national differences are certainly worth investigating in conjunction with youth labour market outcomes, since they could help clarify the relative importance of this demographic factor as a cause of the youth labour market disadvantage. In the case of Ethiopia, Rosati (2006) finds that local labour markets with the largest share of youth in the population have the highest youth unemployment rates (see O’Higgins, 2003 for a study on 32 developing and transition countries).
3.1.2. Rural-urban distribution of the young population
We have stressed above the differences between urban and rural areas regarding the labour market situation of the youth. In terms of demographic structure, it is a priori unclear which have a higher youth share, and therefore face a potential higher excess supply of young people: rural areas because of higher fertility, or cities because of internal migration? Although there are exceptions, the youth’s share is generally found to be higher in urban areas, indicating that the challenges faced by urban labour markets regarding the insertion of youth may be higher than in rural areas. However, as we will see below, cities are also the location of potentially more diverse and more dynamic labour demand sources.
3.1.3. Education level of the workforce
Although education is the main factor of productivity, it remains desperately rare in Africa, even if progress has been made for the past 15 years. According to the EFA Report 2002, while the net primary enrolment rate amounted to 83 percent worldwide, it was only 57 percent in SSA, the lowest rate of any region. However, enormous progress is being made. According to the World Bank (2006b), since 1990, eight of the developing world’s ten top performers in annual increases in primary completion rates have been in Africa (Benin, Eritrea, Ethiopia, Guinea, Mali, São Tomé and Principe, Togo, and Malawi). Primary completion rates in these countries have grown by more than 5 percent a year, well above the low-income country average of 0.8 percent a year. Obviously, this global trend hides enormous national disparities with, on the one hand, countries like Rwanda where primary education is practically universal (NER of 97 percent) and on the other, Niger, where only 21 percent of children of primary school age are effectively in school. In addition to having the lowest enrolment
1 0 1 5 2 0 1 9 7 5 1 9 8 0 1 9 8 5 1 9 9 0 1 9 9 5 2 0 0 0 2 0 0 5 2 0 1 0 2 0 1 5 2 0 2 0 2 0 2 5 W o r ld A fr ic a A s ia E u r o p e L a tin A m e r ic a a n d th e C a r ib b e a n Africa
rates, Africa is also the region in the world where the girl/boy disparities are the highest, with an average gap of 20 points in enrolment rates to the detriment of women.
However, enrolment rates alone cannot provide a clear picture of the stock of human capital available because, on the one hand, knowledge gained from schooling (in this case reading and writing) is only completely acquired once the individual has achieved a minimum level of study (6 years in primary school) and, on the other, it is vital to take into account the total length of study. Figures from World Bank (2006a) indicate that in many countries the minimum mastery rate is lower than the net enrolment rate. It also shows that less than a third of children in Malawi, Namibia and Tanzania achieved minimum mastery in literacy by grades 4–6, even though the average net enrolment rate was about 65 percent. In Ghana and Zambia, half or fewer of all young women ages 15-24 can read a simple sentence after even grade 6.
Kuepie, Nordman and Roubaud (2006) examine this question using the 1-2-3 Surveys on seven main West African cities (PARSTAT project). Their results indicate that even if the average individuals’ level of education in each capital is much higher than that found for the overall country, the accumulation of education remains low in all seven cities: the average number of years of completed schooling is only about five years, and over half of the individuals aged 15 years or over (55 percent) either never attended school or attended school but did not complete primary cycle. Yet people are only considered to be literate as adults when they have completed primary school. On this basis, they estimate the proportion of literate individuals aged 15 and over in the WAEMU cities in the early 2000s at 45 percent. Moreover, these literate individuals’ level of education was extremely modest since nearly half of them did not go beyond the Secondary College (first four-year cycle of secondary education), and less than a quarter completed the second secondary cycle (total of seven years of secondary education), with the possibility of enrolment in higher education.
Kuepie et al. (2006) highlight the fact that the distribution of individuals aged 15 and over by level of education in each of the cities taken separately is pyramid-shaped with a broad base and a very narrow summit. This is indicative of a high level of illiteracy (at least 44 percent) and high drop-out rates between and within the cycles. Possession of the minimum human capital (i.e. at least completed primary schooling) also varies markedly by gender. Women are largely disadvantaged in that nearly two-thirds (64 percent) did not complete primary school (as opposed to 45 percent of men). This rate rises to 68 percent in Dakar, Niamey and Bamako. Even in the cities with the longest-standing and most developed schooling (Cotonou and Lome), women remain largely on the fringes: 59 percent did not complete primary school.
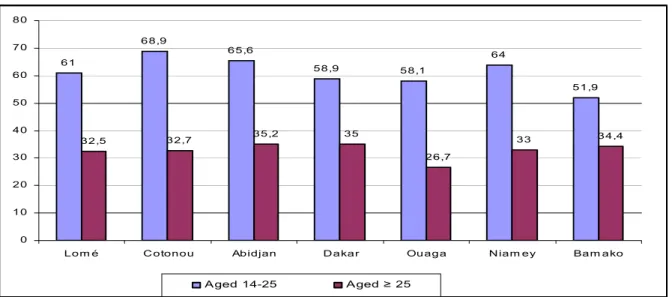
When studied by generation, more under-35s (48 percent) have the minimum level of schooling compared to their elders aged 35 to 44 (44 percent) and especially those aged 45 and over (34 percent). This configuration reflects the steady development of the education system in the African countries. Yet the schooling dynamic is not the same everywhere. At one end of the scale, there are the cities with a long tradition of schooling. At the other end of the spectrum are those where the development of schooling has been stepped up more recently. The first group comprises Lome, Abidjan and Cotonou where, even among the individuals aged 45 to 59, a significant proportion (at least 45 percent) has the minimum level of schooling. In the second group (Bamako, Niamey and, to a certain extent, Ouagadougou), over 60 percent of the over-35s do not have the minimum level of schooling. Dakar stands out for its stagnation (at around 60 percent) in the proportion of individuals without the minimum grounding in education across all generations (15 to 59 years old).
A last point worth mentioning about the educational landscape of the major WAEMU cities is the low weight of vocational education, which never exceeds 2 percent of the over-15s with the notable exception of Mali where it comes to 6 percent. This is characteristic of an education system in which vocational training is left by the wayside.
3.2.
Education, access to employment and returns to education training
In Africa, education is often seen as the main policy instrument in the fight against poverty because it may help individuals access better jobs and thus raise their labour earnings. However, in practice,