HAL Id: tel-01958391
https://pastel.archives-ouvertes.fr/tel-01958391
Submitted on 18 Dec 2018
HAL is a multi-disciplinary open access archive for the deposit and dissemination of sci-entific research documents, whether they are pub-lished or not. The documents may come from teaching and research institutions in France or abroad, or from public or private research centers.
L’archive ouverte pluridisciplinaire HAL, est destinée au dépôt et à la diffusion de documents scientifiques de niveau recherche, publiés ou non, émanant des établissements d’enseignement et de recherche français ou étrangers, des laboratoires publics ou privés.
Karl Chatelain
To cite this version:
Karl Chatelain. Oxidation stability of fuels in liquid phase. Chemical engineering. Université Paris-Saclay, 2016. English. �NNT : 2016SACLY020�. �tel-01958391�
THÈSE DE DOCTORAT
DE L’UNIVERSITE PARIS-SACLAY
préparée àL’ENSTA ParisTech
ÉCOLE DOCTORALE N
◦579
Sciences Mécaniques et Énergétiques, Matériaux et Géosciences (SMEMAG) Spécialité de doctorat : Génie des procédés
par
Karl CHATELAIN
Etude de la stabilité à l’oxydation des carburants
en phase liquide
Thèse présentée et soutenue à Rueil-Malmaison, le 15 décembre 2016 Composition du jury :
Dr. André NICOLLE Président IFP Energies nouvelles, R102
Pr. Richard WEST Rapporteur Northeastern University, Boston, CoMoChEng Pr. Pierre-Alexandre GLAUDE Rapporteur CNRS Nancy, LRGP
Dr. Mickael SICARD Examinateur ONERA, DEFA Dr. Thomas DUBOIS Examinateur TOTAL ACS
Dr. Laurie STARCK Examinateur IFP Energies nouvelles, R104 Mme. Arij BEN AMARA Examinateur IFP Energies nouvelles, R104
This work was made possible thanks to the support of the IFP Energies nouvelles (IFPEN) and the chemical engineering laboratory (UCP) of the ENSTA ParisTech, Université Paris-Saclay. It was mainly performed at IFPEN in partnership with several divisions: powertrain and vehicule (R10) mostly, physics and analysis (R05) and process experiments (R15). It also includes several months spent in the Massachusetts Institute of Technology (MIT) in Cambridge (MA,USA) as a visiting researcher.
First, I would like to thank the committee for accepting to evaluate this work. In particular, Professor Richard West from Northeastern University in Boston and Professor Pierre-Alexandre Glaude from the CNRS Nancy for accepting to review my thesis.
I also thank all others committee members, notably Doctor Mickael Sicard from ONERA and Doctor Thomas Dubois from Total ACS, for their interest in this topic and our fruitful discussions during and after the defence.
I would like to thank Profesor Laurent Catoire, as the laboratory head of UCP and my PhD advisor, for his scientific contribution, his time and the trust he placed in me to accomplish this research. In addition, I thank Doctor Laurie Starck for promoting this stimulating research topic at IFPEN involving both experimental and modeling work on fuel autoxidation. In addition, I am grateful for the opportunity she gave me to accomplish part of this work in MIT. Thus, I am also thankful to Professor William Green and his group for welcoming me as a visiting researcher.
I appreciated the regular discussions and meetings on this research topic with Doctor André Nicolle and Arij Ben Amara, thank you very much for your investment.
I would like to thank all people who contributed to the success of this experimental work, Doctor Maira Alves-Fortunato, Pascal Hayrault, Michel Chardin, Benjamin Veyrat and also the students who contributed to part of the data acquisition Skander and Clara.
Now I would like to thank all colleagues and friends who contributed indirectly to the success of this work with our discussions or just by sharing common hobbies. The IFPEN runners: Mickael, Lama, Jan, Guillaume, Pascal and Patricia. My office mates: Betty, Elias, Benjamin, Edouard and Eleftherios. All others IFPEN colleagues: Sophie, Federico, Valerio, Gorka, Antoine and Detlev. My ENSTA colleagues: Aurélien, Julien, Amir, Zhewei and Johnny. And the others friends not mentioned earlier: Olivier, Larysa, Audrey, Sébastien, Amélie and Romain.
Before to conclude, I especially thank my previous advisors, Pr. Rémy Mével and Pr. Joseph Shepherd with whom my interest in Research started, thanks to their stimulating research topics in the Explosion Dynamics Laboratory (EDL) in the California Institute of Technology (Caltech).
Finally, and most importantly, I would like to thank my parents, my family and especially my wife Tiphaine for their understanding, their care and patience during the last three years.
1.1 CO2concentration evolution in the atmosphere over the last ten thousand years [1] . . . 2
1.2 Illustration of a local pollution episode which occurred during Spring 2014 in Paris [2] . . . 2
1.3 Simplified representation of a common rail injection system in a 4-cylinder engine from [3]. Text in purple represents issues caused by fuel autoxidation. Red dashed blocks represent areas with fuel stresses. Black and grey arrows stand for the fuel flow. Fouling induced by heterogeneous catalysis are not represented but should be considered in every lines. . . 2
1.4 Injector deposit formation after 1016 hours of operation with Rapeseed Biodiesel observed by Sem [4] . . . 3
1.5 Effect of water on the decomposition of urea [5] . . . 3
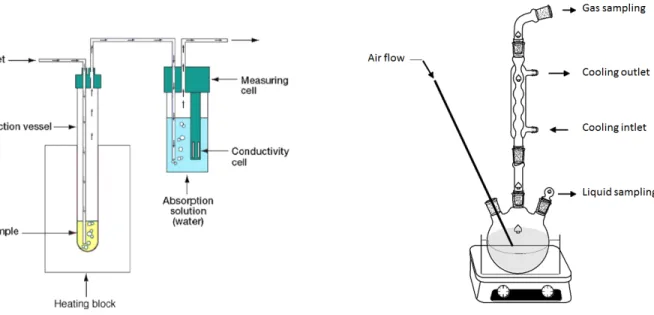
2.1 Examples of experimental apparatus used in liquid phase autoxidation studies . . . 6
2.2 Fuel composition impact on autoxidation rate . . . 7
2.3 Impact of oxygen on autoxidation . . . 7
2.4 Typical molecule from each antioxidant family. a), b) and c) are respectively H donor, peroxy inhibitor and complexing agent . . . 8
2.5 Antioxidant types and concentration effects on autoxidation kinetics. . . 8
2.6 Chain length impact on the autoxidation kinetics . . . 9
2.7 Uncertainties on the branching impact on autoxidation kinetics . . . 9
2.8 Insaturation impact on autoxidation kinetics . . . 10
2.9 Specific effect of blending on autoxidation kinetics. . . 10
2.10 General presentation of a chain mechanism . . . 11
2.11 Global mechanism for liquid phase autoxidation proposed by Zongo [6] . . . 11
2.12 Potential initiation steps of liquid phase autoxidation . . . 12
2.13 Major pathways leading to oxygenated species formations . . . 13
2.14 Major pathways leading to lighter oxidation products formation . . . 14
2.15 Major reaction steps from the Bayer-Villiger reaction [7,8,9] . . . 15
2.16 Illustration of the close relation between chemical and physical processes on deposition mech-anism. Modified scheme from Beaver et al. [10] . . . 15
2.17 Global process for the deposit formation. The bulk reactivity path (i) is represented with black arrows. The catalytic oxidation path (ii) is represented with purple arrows. The solubility of deposit into fresh solvent (iii) is represented with grey arrows. . . 16
2.18 Temperature profile during the autoxidation of several compounds [11] . . . 16
2.19 Illustration of Reverse Micelle formation and its implication in the chain mechanism of au-toxidation . . . 17
2.20 Whitman model presentation for a reacting system consuming A in the liquid phase. PA is the partial pressure and CA,gthe concentration of species A in the gas phase. Indices g, l and i respectively stand for gas liquid, and interface. . . 18
2.21 Thermodynamic cycle presenting solvation process. Grey arrow represents the Free energy
change between ideal gas to diluted solute in solvent. Diagram is from Jalan et al. [12] . . . . 19
2.22 Solvent model illustration from discrete (a) to continuum model (f). Illustration is from Jalan et al. [12] . . . 19
2.23 Solvation effects on activation energies . . . 21
2.24 Typical size of detailed and skeletal mechanisms for hydrocarbon fuels.The figure is from Lu and Law [13]. As presented with the mechanism selected, mechanism size is linearly correlated with the number of species, N umberR xn= 5 × NumberS pc. . . 23
3.1 PetroOxy device representation and its typical experimental result . . . 26
3.2 Autoclave scheme and typical experimental signal . . . 27
3.3 Gas chromatograph presentation and a scheme presenting Mass Spectrometer (MS) working principle. . . 29
3.4 Fourier Transform InfraRed (FTIR)-Attenuated Total Reflectance (ATR) working principle and typical signal presentation . . . 30
3.5 Comparison of HP-5 and DB-FFAP separation capability on an oxidation residual sample. . . 31
3.6 Illustration of valve timing with the Gas Chromatograph (GC)-Thermal Conductivity Detec-tor (TCD). Area (a) represents the injection loop loading. Area (b) stands for all products elution. At the beginning of the (c) area, the valve V2 switches and traps all light products, and during this period, heavier ones are eluted. In (d), the valve V2 switches back and re-leases light products trapped in step (b). . . 33
3.7 Example of Detector Response calculation using the Equivalent Carbon Number (ECN) model. a.u stands for area units. HMF stands for 5-Hydroxymethyl-2-furaldehyde. . . 34
3.8 Relative Errors (R elativeError(RE) =∆(D.R.ECN,i− D.R.Ex p,i)/D.R.Ex p,i))on Detector Re-sponse (DR) prediction over the 6 molecules tested for a given ECN reference compound. "Ref. C8" means octane is selected as a reference compound (DRre f) in the ECN model . . . . 35
3.9 Final predictions on the detector response according to typical chemical families of oxidation products. C8and C12predictions are obtained according to FID linearity rule and oxygenated molecules predictions are obtained according to the ECN models. . . 36
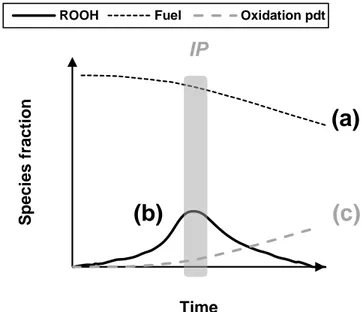
3.10 Techniques used to extract Induction Period (IP) from experimental data containing different type of data: Species profiles, macroscopic measurements. . . 37
3.11 General modeling chain from fuel to reactor . . . 38
3.12 Multi-Scale Approach (MSA) presentation. . . 38
3.13 Decision diagram presentation . . . 39
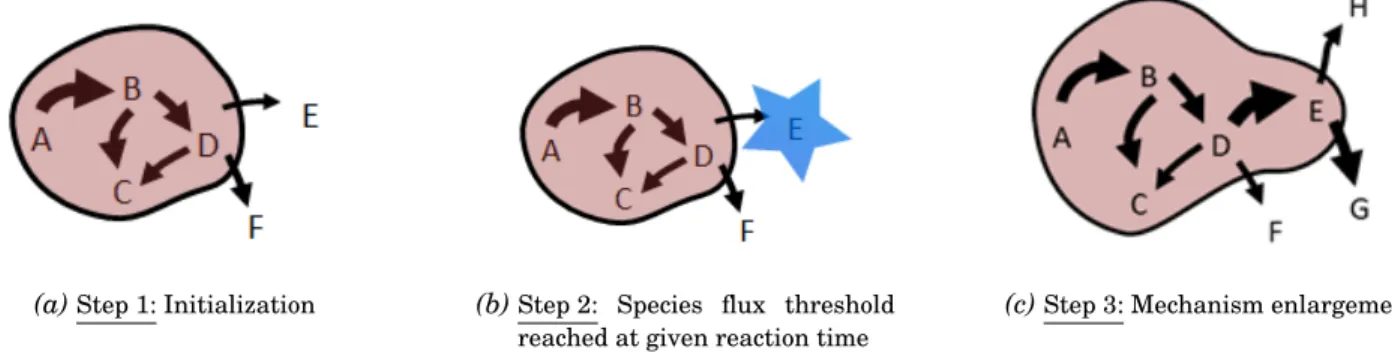
3.14 RMG generation process illustration. Species A, B, C and D are reactants. During the initial-ization step, the algorithm is finding reactions matching those species. After a given reaction time, Species E is passing the tolerance threshold and is added to the core mechanisms. Then new paths are investigated with species E in the core mechanism. Illustration was extracted from a RMG study group presentation [14]. . . 40
3.15 Geometry optimisation process . . . 42
3.16 Potential Energy Surface (PES) with low energy barrier (D step) obtained by Jalan et al. [15]for the Korcek’s reaction . . . 42
3.17 Impact of the Absolute TOLerance (ATOL) and Relative TOLerance (RTOL) parameters on the mechanism size. . . 44
3.18 Adjacency lists illustration. * means this adjacency list contains explanatory H atoms, whereas they are not mandatory. The very first number represents the position of atoms. Then, C and O represent the atoms, then the number stand for the number of radical on the atom, then the list of connection of this atoms are presented between brackets: first number is referring to the atom number and then the letter to the bound type (S: single, D:double) . . 45
4.1 Typical experimental results and initial oxygen pressure effect on IP measurements . . . 48
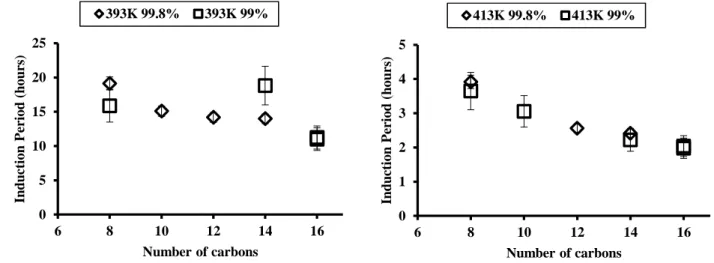
4.2 Measurements uncertainties induced by purity levels . . . 49
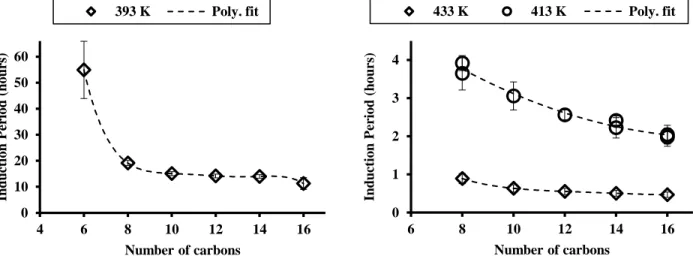
4.3 Impact of the chain length on n-alkanes autoxidation within the 393-433 K temperature range. 50 4.4 Impact of the blending on n-paraffins autoxidation using two blends . . . 50
4.5 Model validation with current and literature data. Blue and black symbols respectively stand for present study and literature data results. Red dashed and black solid lines respectively stand for fit of experimental data and model predictions. Data are available as a supplemen-tary material. . . 53
4.6 Species profile validation of n-decane and n-dodecane mechanisms with literature data. . . 54
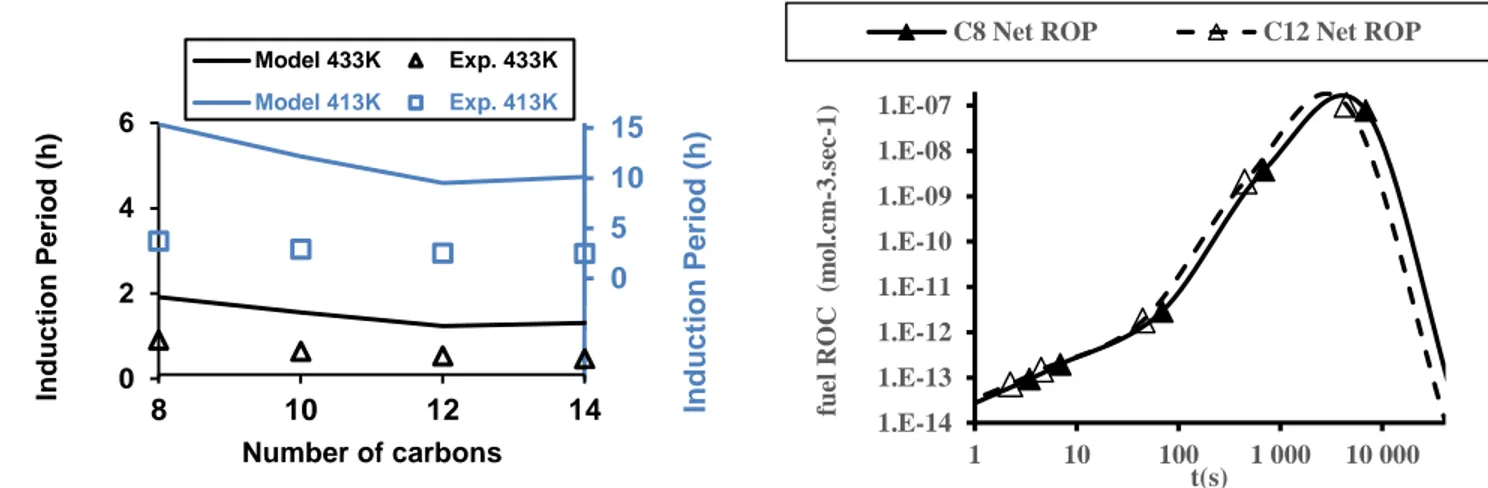
4.7 Comparison of predicted and experimental IPs for the n-alkanes range. Symbols represent values from the above-mentioned fit of our experimental data. Solid lines correspond to model predictions. . . 55
4.8 Fuel RoC analysis performed on C8 and C12mechanisms. IPs are respectively reached at t = 6890 s and t = 4460 s for C8and C12models. . . 55
4.9 RoC analysis of both HO and HO2radicals between C8and C12mechanisms . . . 55
4.10 Reaction families involved in the fuel rate of consumption between C8 and C12mechanisms. Solid and dashed lines, respectively, represent C8and C12models. . . 56
4.11 Macroscopic results for n-octane (n-C8) oxidation at 383 K and 1000 kPa in autoclave . . . 58
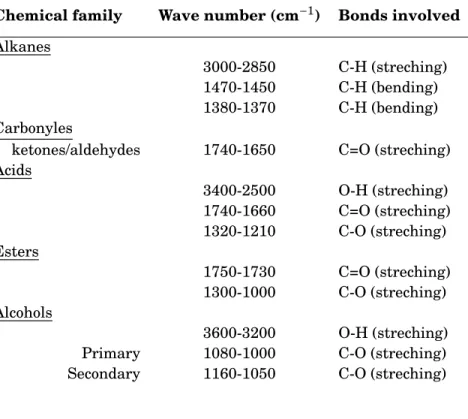
4.12 Total Ions Current (TIC) MS spectrum for oxidized n-C8 sample filtered with specific m/z ions. 59 4.13 FTIR-ATR analysis of n-C8 sample after 94 h oxidation. Absorption bands 1 and 3 are rele-vant to C-H bond stretch respectively from CH3 and CH2 groups. The absorption band 2 is relevant to C=O bond stretch from n-C8 ketones isomers formed during autoxidation . . . 59
4.14 Species profiles of major species identified during n-C8 oxidation at 383 K. . . 60
4.15 Species profiles of minor species identified during n-C8 oxidation at 383 K. . . 60
4.16 Example of an esterification reaction [16] . . . 61
4.17 IP=f(1/T) for the four molecules investigated. . . 63
4.18 IP evolution with the number of ramification on C8 alkanes at several temperature . . . 64
4.19 Assessment of regressions performance with the ratio of the regression error (∆(IPR e g.− I PEx p)) over experimental errors (∆(IPex p)). When |Ratio| < 1, the error from the regres-sion (∆(IPR e g.− IPEx p)) is lower than experimental uncertainties. . . 65
4.20 Models prediction on IP against present study (blue symbols) and literature data (black sym-bols). For clarity sake, a regression on present study data (dashed blue line) is performed to assess models (solid black lines) performance. Uncertainties on models prediction correspond to IPs variations between 50-20000 ppm initial Oxygen concentration. . . 67
4.21 Model prediction of the branching impact on paraffins oxidation kinetics . . . 68
4.22 RE calculations on both present and literature data models to predict IP at several tempera-tures. . . 68
4.23 Effect of both oxygen concentration and temperature on the sum of fuel Rate of Production (RoP) and Rate of Consumption (RoC) respectively presented on the upper and lower parts of each chart. Analysis was conducted at 423 K with 20000 ppm and 1000 ppm of oxygen respectively in solid and dashed lines. . . 70
4.24 Effect of oxygen concentration on fuel RoC distribution. Analysis was conducted at 423 K with 20000 ppm and 1000 ppm of oxygen respectively in solid and dashed lines. rOO◦stands for the sum of light hydroperoxides from C1 to C7 . . . 71
4.25 Effect of oxygen concentration on major species formation. Analysis was conducted at 423 K with 20000 ppm and 1000 ppm of oxygen respectively in solid and dashed lines. . . 72
4.26 Temporal evolution of the sum of RoC and RoP with two different pairs of mechanisms. . . 74
4.27 Temporal evolution of the RoC distribution with different pairs of mechanisms. . . 75 v
4.28 Macroscopic results for 2-methylheptane (MH) oxidation at 383 K and 1000 kPa in autoclave . 77
4.29 TIC MH spectrum for oxidized octane sample filtered with specific m/z ions. . . 78
4.30 FTIR-ATR analysis of MH sample after 24 h oxidation. Absorption bands 1 and 3 are relevant to C-H bond stretch respectively from CH3and CH2groups. The absorption band 2 is relevant to C=O bond stretch from MH ketones isomers formed during autoxidation. . . 78
4.31 Species profiles of major species identified during MH oxidation at 383 K. . . 79
4.32 Species profiles of minors species identified during MH oxidation at 383 K. . . 80
4.33 Evolution of both IPs and regression parameters as function of the number of carbons of all n-paraffins studied. . . 81
4.34 Evolution of both IPs and regression parameters as function of the number of carbons of all iso-paraffins studied. . . 81
4.35 Validation of the extended model for n-paraffins chemical families . . . 82
4.36 Validation of the extended model for iso-paraffins chemical families . . . 82
4.37 Measured IPs for MH according to both experiments . . . 83
4.38 Pictures of samples and autoclave content for both n-C8 and MH . . . 85
4.39 Two phases analysis on the most oxidized sample of n-C8 experiment . . . 86
4.40 Two phases analysis on the most oxidized sample of MH experiment . . . 86
4.41 Two phases analysis on the most oxidized sample of n-C8 experiment and theorical IR spec-trum of water from NIST. The area 1 represents the water signal contribution. The area 2 represents the C-H bonds vibrations. The area 3 represents contribution of the C=O bands. . . 87
4.42 Example of an esterification reaction [16] . . . 87
4.43 Species profiles agreement between experimental results and model predictions on n-C8 at 383K and 10 bars. . . 88
4.44 Species profiles agreement between experimental results and model predictions on MH at 383K and 10 bars. . . 88
4.45 Species profiles agreement between experimental results and model predictions on n-C8 at 383K and 10 bars with an hypothetical new reactor model. . . 90
4.46 Species profiles agreement between experimental results and model predictions on MH at 383K and 10 bars with an hypothetical new reactor model. . . 90
4.47 Representation of the sum of products remained in the liquid phase from both n-C8 and MH models predictions at 383 K. . . 91
5.1 Schematic presenting the overall methodology used here. The framed block and arrow in green aim to emphasize the current modeling limitation pointed during this work. . . 94
6.1 Current liquid phase reactor model representing an homogeneous liquid phase with a set of species (SPC) and its associated mechanism. . . 96
6.2 Hypothetical new reactor model with four distinct phases: gas, liquid1, liquid2 and solid. Every phase has its own set of species with its own mechanism. Three distincts interfaces are represented in purple to represent the species transport from one phase to another. . . 96
6.3 Global process for the deposit formation. The bulk reactivity path (i) is represented with black arrows. The catalytic oxidation path (ii) is represented with purple arrows. The solubility of deposit into fresh solvent (iii) is represented with grey arrows. . . 96
4 Thermodynamic cycle to determine formation enthalpy at 298 K for a given hydrocarbon CxHy. Atom.Ener g. correspond to atomization energy. . . 107
5 General presentation of each hierarchy defined by Wheeler et al [17]. . . 107 vi
6 Comparison of average errors using atomization energies and the new homodesmotic hier-archy presented by Wheeler et al. [17] obtained for conjugated hydrocarbons or not against common theory levels. The two cut off values are respectively from left to right 342 and 36
kcal/mol. . . 108
7 Free rotors examples . . . 110
8 IP validation with both RMG Java version: 3.2.1 and 4.0.1 . . . 112
9 Accuracy of thermochemistry calculations of RMG 3.2.1 and RMG 4.0.1. . . 113
10 Illustration of the group representation used in RMG . . . 113
11 Presentation of the Evans-Polanyi expression to obtain Eafrom the empirical law (4). . . 114
12 Impact of both temperature and oxygen concentration on the sum of HO◦2 radical RoP and RoC respectively presented on upper and lower part of each chart. . . 115
13 Impact of both temperature and oxygen concentration on the sum of OH◦ radical RoP and RoC respectively presented on upper and lower part of each chart. . . 116
14 Species profiles agreement between experimental results and model predictions on n-C8 at 383K and 10 bars. . . 117
15 Species profiles agreement between experimental results and model predictions on MH at 383K and 10 bars. . . 117
3.1 Typical InfraRed (IR) absorption bands for oxidized paraffins with vibrational mode
informa-tions in bracket. . . 30
3.2 List of all analytical devices. ? sign means those analyses were set for autoclave study and was not available for previous studies. If no holding time are provided in oven programs it means this value equals 0. . . 32
3.3 The value of carbons and chemical functions penalties used in the ECN model. . . 34
3.4 Summary of ECN model deviation on predicting D.R.com p from a given reference compound. S1 corresponds to the sum of the absolute relative errors obtained over the 6 molecules tested for a given reference compound, with RE =∆(D.R.ECN,i− D.R.Ex p,i)/D.R.Ex p,i. S2 represents the sum of the absolute relative errors for oxygenated molecules only. . . 35
4.1 Identified products in n-alkanes autoxidation in the present study and literature. Lines start-ing with asterisks correspond to chemical families for which previous studies may not present the full isomer distinction. . . 51
4.2 Mechanisms obtained with four n-alkanes . . . 52
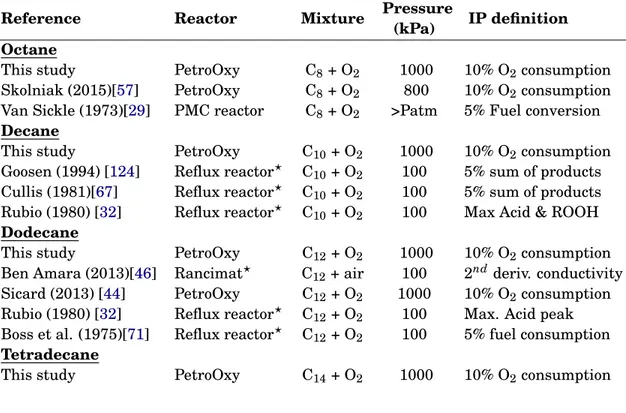
4.3 Summary of Literature Data Used for Validation. Operating conditions and reconstruction techniques are given to make comparison easier between experimental data. "5% sum of prod-ucts" means that IP is obtained when the products concentrations sum reaches 5% of initial fuel concentration. PMC stands for Partially Mixed and Closed. "?" means the experimental device has a bubbling system. . . 52
4.4 Summary of reactions involved in the RoC analysis of fuel with reaction examples for the octane model with typical kinetic parameters . . . 56
4.5 Summary of experimental conditions tested in the present work. . . 61
4.6 Mechanisms obtained with the four C8-alkanes. . . 62
4.7 Coefficients of both linear and exponential regressions . . . 64
4.8 Similarities and differences of oxidation products formed between the tested isomers of C8. X, - and ∼ signs respectively mean compounds identified, not identified and traces suspected. 65 4.9 Literature data used for validation with their associated detection technique.* Due to the pos-sible existence of two oxidation regimes, data below 393 K are not conserved for the validation of 2,2,4-trimethylpentane (TMP) . . . 66
4.10 Summary of reactions involved in the RoC analysis of fuel with corresponding kinetic pa-rameters within each label. * Means papa-rameters are identical on each mechanisms. I, II and III mean there is no rate constant distinction if the radical is respectively on a primary, secondary and tertiary carbon. . . 69
4.11 Performance of the extended empirical model according to both chemical families and IPs values . . . 83
1 Gaussian input file example. The effective input file is within the section filled in grey and comments on each line are in parenthesis. . . 109
2 Number of conformers obtained for C2-C16paraffins with 2 and 3 rotations per rotor following the expression: R otN umberd ihedrals. With R ot corresponding to the number of twist per rotors and N umberd ihedrals= Ncarbons−1for n-paraffins . . . 109 3 RMG input file example. The effective input file is within the section filled in grey and
com-ments on each line are in parenthesis. . . 110 4 Elements used in the group definition . . . 114
A Preexponential factor. AE Absolute Error. AH Antioxidant.
ASTM American Society for Testing and Materials. ATOL Absolute TOLerance.
ATR Attenuated Total Reflectance. BDE Bond Energy Dissociation. BtL Biomass to Liquid.
CtL Coal to Liquid.
DMH 2,5-dimethylheptane. DR Detector Response. Ea Activation Energy.
ECN Equivalent Carbon Number. ESC Electronic Structure Calculation. FID Flame Ionization Detector. FTIR Fourier Transform InfraRed. GC Gas Chromatograph.
GtL Gas to Liquid. HC Hydrocarbon. HL Henry’s Law.
HOOQOO◦γ-peroxy-alkyhydroperoxi radical. HOOQOOH alkyl-di-hydroperoxide.
IP Induction Period. IR InfraRed.
KHP Keto-Hydro-Peroxide. KSE Kinetic Solvent Effect.
LPA Liquid Phase Autoxidation.
LSER Linear Solvation Energy Relation. MH 2-methylheptane.
MS Mass Spectrometer. MSA Multi-Scale Approach. n-C8 n-octane.
NPD Nitrogen-Phosphorus Detector. PES Potential Energy Surface. RE Relative Error.
RF Response Factor. RM Reversed Micelles.
RMG Reaction Mechanism Generator. RoC Rate of Consumption.
ROO◦alkyl-peroxy radical. ROOH alkyl-mono-hydroperoxide. RoP Rate of Production.
RSSOT Rapid Small Scale Oxidation Test. RTOL Relative TOLerance.
SATP Standard Ambient Temperature and Pres-sure.
SCRF Henry’s Law.
TCD Thermal Conductivity Detector. THF TetraHydroFuran.
TIC Total Ions Current. TMP 2,2,4-trimethylpentane. TST Transition State Theory. UV Ultra-Violet.
1 Context of the study 1
2 Literature review 5
2.1 Liquid phase autoxidation . . . 5
2.1.1 Experimental results of autoxidation studies . . . 5
2.1.2 Chemical kinetics of autoxidation . . . 9
2.1.3 Oxidation products and deposition processes . . . 12
2.2 Solvent modeling . . . 15
2.2.1 Heterogeneity inside the liquid bulk . . . 15
2.2.2 Phase equilibrium in liquid phase autoxidation . . . 17
2.2.3 Solvent effects in liquid phase autoxidation . . . 18
2.3 Modeling tools . . . 22
2.3.1 Mechanism generators . . . 22
2.3.2 Electronic structure calculations . . . 23
2.4 Conclusions . . . 24
3 Material and Methods 25 3.1 Experimental devices . . . 25
3.1.1 PetroOxy experiment . . . 25
3.1.2 Autoclave experiment . . . 26
3.1.3 Analytical devices . . . 28
3.1.4 Calibration coefficient estimation . . . 32
3.1.5 Induction Period definitions . . . 36
3.2 Molecular modeling approach . . . 37
3.2.1 Description of the methodology . . . 38
3.2.2 Models coupling . . . 39
3.2.3 Key steps of the multi-scale approach . . . 43
3.3 Conclusion . . . 44
4 Results and Discussions 47 4.1 N-paraffins studies . . . 47
4.1.1 Preliminary study with PetroOxy . . . 47
4.1.2 Detailed results with autoclave . . . 57
4.2 Iso-paraffins studies . . . 61
4.2.1 Preliminary study with PetroOxy . . . 61
4.2.2 Detailed results with autoclave . . . 76 xiii
4.3 Discussions . . . 79
4.3.1 Structure reactivity impact on paraffins autoxidation . . . 79
4.3.2 Experimental results discussions . . . 83
4.3.3 Modeling results discussions . . . 85
4.4 Conclusion . . . 91
5 General conclusions 93 6 Perspectives 95 6.1 New chemical systems . . . 95
6.2 New reactor model . . . 95
6.3 Reaction Mechanism Generator (RMG) upgrades . . . 97
6.3.1 Solvent database upgrade . . . 97
6.3.2 Solvent effects on the thermokinetics . . . 97
Bibliography 99 Appendices 107 .1 Electronic Structure Calculation (ESC) supplementaries . . . 107
.2 RMG supplementaries . . . 110
.2.1 Reactivity difference between RMG3 and RMG4 mechanisms . . . 110
.2.2 Correction on the Free energy of solvation calculation implemented since RMG4 . . . . 110
.2.3 RMG input file . . . 110
.2.4 Molecule identification and thermo-kinetic calculations . . . 111
.2.5 RMG thermochemistry calculation . . . 112
.2.6 RMG kinetic rate estimation . . . 113
.3 Complementary iso-paraffins mechanisms analyses . . . 115
Context of the study
Liquid phase stability is a major concern in the transportation and the energy field. Relevant examples are fuels, lubricants and additives which have to be stable from the refinery to their application (engine, combustors). However, liquid phase reactivity can occur even at low or high temperature under many differ-ent conditions such as pyrolytic/oxidative, photo-chemically activated, microbiological (aerobic or anaerobic conditions), under atmospheric or pressurized conditions. Different applications can be cited from fuel sta-bility under storage [18] or operating conditions [4] to production industries or health sector such as food, comestics and fragrances. In this thesis, fuel stability under both storage and operating conditions are considered where degradations are more likely occurring under the low temperature regime also defined as autoxidation [19].
The fuel and transport field is constantly changing due to recent environmental considerations with the reduction of greenhouse gas emissions and the improvement of local air purity respectively presented in Figure 1.1and Figure 1.2. On one hand, those considerations impact fuel compositions with the increasing use of biofuels (E10, B7) and the diversification of additive packages whose chemistry and interaction with conventional fuel fractions is poorly assessed. On the other hand, they are also the source of many technology improvements (engine downsizing, flex fuels and engine hybridation) or the development of breakthrough technologies and concepts (E1001, HCCI2 engine, RCCI3 engines, fuel cells). However, technologies using conventional liquid fuels have to be compatible with our current fuel design and engine technologies, particularly in aeronautics where an aircraft lifetime is close to 40 years.
1E100 stands for pure Ethanol fuel
2Homogenous Charge Compression Ignition 3Reactivity Controlled Compression Ignition
Figure 1.1: CO2 concentration evolution in the atmo-sphere over the last ten thousand years [1]
Figure 1.2:Illustration of a local pollution episode which
occurred during Spring 2014 in Paris [2]
As an example, before the 2000’s and the arrival of the direct injection engines in automotive, injection pressures were about 200 bar. Now, with the 4thgeneration of diesel piezo injector, new studies investigate injection pressures above 2500 bar [20, 21]. This drastic pressure increase combined to both engine heat release and fuel cycling increase fuel stresses. In aeronautic field, fuel stress is also occurring where fuel is used as an engine coolant [22, 23, 24], hydraulic fluid and consequently stressed by the variations of temperature and pressure during flight conditions. Those stresses can degrade both jet fuels [25, 26] and diesel fuels [4, 27, 28] to form gums or deposits. Deposits affect the whole engine efficiency, thereby degrading operation of injection units, pumps or filtering system as summarized inFigure 1.3.
Priming system Filtering System Injection Pump
Pressure + Engine heat Compression Fuel preheat Fuel cycling Rail Injectors Oxidation in tank
Filter plugging Pump failure
Pump failure Rail and
injectors fouling
Figure 1.3:Simplified representation of a common rail injection system in a 4-cylinder engine from [3]. Text in purple
represents issues caused by fuel autoxidation. Red dashed blocks represent areas with fuel stresses. Black and grey arrows stand for the fuel flow. Fouling induced by heterogeneous catalysis are not represented but should be considered in every lines.
Another consequence is the fuel composition change, which may significantly modify fuel properties. For ex-ample, hydroperoxides, a known oxidation product in Liquid Phase Autoxidation (LPA) [29,30,31,32,33], was shown to impact fuel ignition delays [34]. Viscosity may also be impacted by autoxidation process and may increase up to 60-fold in n-alkane autoxidation [35]. To solve these old and well known degradation issues [36, 37], antioxidants are added to the fuel. Antioxidants have a bivalent behaviour according to their concentration or the temperature and can respectively inhibit or promote autoxidation processes as presented by Zabarnick et al. [38]. This bivalent behaviour emphasizes the requirement of an indeep
knowledge of the autoxidation chemistry. In addition, it had been demonstrated that autoxidation pro-cesses cannot be modeled as gas-phase propro-cesses [19,39]. Figure 1.5presents an example on how solvent can impact both thermochemistry and kinetics. Thus, the modeling of liquid phase autoxidation processes has to integrate solvent effects (on both thermochemistry and kinetics).
Figure 1.4: Injector deposit formation after 1016 hours
of operation with Rapeseed Biodiesel observed by Sem [4]
Figure 1.5:Effect of water on the decomposition of urea
[5]
This thesis aims to develop and validate a complete methodology combining both experimental data acquisition and the development of kinetic models for LPA of fuels. However, due to both the variability4 and the complexity5of real fuels composition, the direct kinetic study of fuel autoxidation is not realistic. In agreement with the majors constituents of real fuels [40], and due to their increasing interest as a drop-in fuel, normal and iso-paraffins were subsequently investigated as a fuel surrogate to validate the developed methodology.
The first part of this manuscript will present the state of the art of LPA. From literature review, it highlights the key parameters of autoxidation, well known oxidation pathways and both common experi-mental and modeling tools used in LPA.
Then, material and methodologies selected and developed within the framework of this thesis are pre-sented. Experimentally, it combines both industrial and research oriented apparatus with several ana-lytical devices. Numerically, a multi-scale methodology developed to generates detailed kinetic models for liquid phase is presented. It is based on an open source code called RMG which generate kinetic models with some solvent effects in the kinetic models. This methodology is then validated with the two exper-imental devices on both normal and iso paraffins systems. The combination of both results gives access to macroscopic reactivity descriptor IP and detailed species profiles over reaction time. Then, agreements between experimental data and model are discussed quantitatively and qualitatively. In addition to species identification similarities, the mechanisms analyse pointed common oxidation pathways between normal and iso-paraffins compounds.
4Variability between seasons for automotive fuels and the Jet A and Jet A-1 differences 5Number of species or additives
Literature review
To study liquid phase fuel stability, aspects covering this topic are presented according to three axes. The first is based on experimental literature review to present systems already studied, identify relevant kinetic paths and suspected deposition processes. The second part is focused on presenting chemical engineering aspects involving liquid phase heterogeneity, multi phases interactions, solvent effects occurring in LPA. The last part is devoted to a general presentation of the modeling tools available in literature to perform autoxidation kinetics.
2.1
Liquid phase autoxidation
As presented earlier, fuel autoxidation was studied in several industrial contexts starting from crude oil and refinery fouling [41] to fuel aging [4] within fuel injection systems. Due to the complex fuel composition [42, 25, 43], one can distinguish two kinds of literature data. The first one is dedicated to real fuel au-toxidation investigating reactivity promoters and inhibitors. The second is more specific to fuel surrogates with studies on specific chemical family (paraffins or aromatics) to reproduce either the reactivity or the deposits formation. Based on this distinction, a first part of the literature review is dedicated to experimen-tal observations to identify relevant parameters and species to consider in LPA. Then, kinetic processes are discussed as well as the chain reactivity of LPA. Finally, a bibliographic review of deposition processes and their relationship with autoxidation phenomena is presented.
2.1.1 Experimental results of autoxidation studies
Autoxidation studies were performed using a variety of experimental apparatus from Rapid Small Scale Oxidation Test (RSSOT) to more research-oriented apparatus (reflux reactor, closed reactors coupled to an-alytical devices). Due to their specificity, reactor configurations, the mixing system, reactor materials or operating conditions, the results obtained in all these studies may differ from one author to another. In addition, the parameters followed to measure the overall reactivity bring an additional variability of the results. As an example, some authors focused on macroscopic observables such as pressure [9,44], acidity [45] or conductivity [46] and proposed correlations to obtain the equivalent extent of the fuel consumption. As most of these macroscopic descriptors are presented in section3, their description is not performed in this review. Other authors performed on-line or off-lines analyses to evaluate oxidation products profiles. In this case, the sampling system and/or the detection technique chosen can induce uncertainties on the quantification that are higher for off-line analysis. These two types of results can be obtained with the
apparatuses presented inFigure 2.1. In order to compare one experiment to another, a set of key param-eters is presented to understand promoting or inhibiting effects between each experiment. For the sake of simplicity, those parameters are classified according to their importance.
(a)Example of open-reactor with the monitoring of a macro-scopic parameter, the conductivity using the Rancimat ex-periment [46]
(b)Example of open-reactor with species profile measure-ments: a reflux reactor with sampling systems [33]
Figure 2.1:Examples of experimental apparatus used in liquid phase autoxidation studies
Key parameters in liquid phase autoxidation
Due to Arrhenius expression, the first key parameter in LPA is the temperature. Thus, as presented in many studies, the reactivity increases exponentially with the temperature. In second, it is the reactant itself (or fuel composition) for which reactivity is highly correlated with the chemical structure. Its impact on the reactivity is well illustrated by C-H Bond Energy Dissociation (BDE) which differs from one chemical species to another [8]. This behaviour is also illustrated by the comparison of different JET A-1 autoxidation tendencies at 185◦CFigure 2.2a. This composition effect is also presented inFigure 2.2billustrating that methyloleate addition into dodecane contributes to increase reactivity. This demonstrates the requirement of multi-component fuel surrogate to model real fuel autoxidation and capture all interactions between each chemical families.
The third major parameter is the oxygen availability in the liquid phase. From the deposition rate presented in Figure 2.3a, two reaction regimes can be identified: (i) a pyrolytic regime common to oxy-genated and de-oxyoxy-genated fuels and (ii) an autoxidation regime driven by the oxygen concentration in the system. This oxygen requirement is also illustrated in the literature [30,33], where autoxidation can be accelerated by increasing the oxygen flow (Figure 2.3b). This illustrates (1) the existence of two chain mechanisms leading to deposits (one oxidative and one pyrolytic) and (2) the diffusion limitation that may be encountered under these operating conditions. As the temperature range considered in our study lies below 750 K, the oxygen concentration in the system is an important parameter to consider in experimental data collection.
Heteroatomic species (as nitrogen, sulfur or oxygen containing molecules) present in the fuel promote deposits formation [37,26,25]. Without any distinction of chemical groups in the fuel, polar species have been shown to promote deposit formation [25]. One of the most impacting heteroatomic species are the
(a)Oxygen consumption as function of time for 3 different fu-els. Data were obtained in Near Isothermal Flowing Test Rig (NIFTR) at 185◦C from Jones et al. [47]
(b)IP measurements from Ben Amara et al. [46] for different n-dodecane/Methyl-Oleate mixtures as function of temper-ature
Figure 2.2:Fuel composition impact on autoxidation rate
(a)Deposition rate as function of temperature for oxygenated and de-oxygenated fuel from Spadaccini et al. [48]
(b)Fuel consumption over time with several oxygen flows. Re-sults were obtained with a reflux reactor [33]
Figure 2.3:Impact of oxygen on autoxidation
hydroperoxides which were found to be key species in LPA [8] and strong reactivity promotors [49,50]. The last promoting effect underlined in literature are the homogeneous catalytic effect of dissolved metals and the heterogeneous catalytic effects of walls. To reduce heterogeneous catalytic effects, pas-sivation processes have been investigated in literature and demonstrated a reactivity decrease [51]. As dissolved metals are present in fuels [47,26], initiation steps involving dissolved metals should be consid-ered when studying real fuels autoxidation. As can be concluded, reactivity can be highly enhanced by trace level species.
To reduce all those impacts, stabilizing species, called Antioxidants (AHs), are usually added into the fuels to limit their low temperature reactivity [52,53] and their deposits formation tendencies. Several families of antioxidants are commonly added to the fuels such as peroxy inhibitors, hydrogen donors and complexing agents. A typical antioxidant from each family is presented inFigure 2.4.
In addition, Zabarnick [38] pointed out a somewhat ambivalent behavior of antioxidants in oxidative fuel stability. In his study, the introduction of AH at low concentrations (< 6000 ppm) resulted in the in-crease of fuel stability and a maximum stability was reached at 60 ppm. However, at higher concentrations (> 6000 ppm) the introduction of antioxidant contributes to accelerate the oxidation process as shown in
Figure 2.5b. As can be expected, this critical concentration depends on each fuel [54]. In addition to the
concentration effect, antioxidant efficiency has to be considered as presented in Figure 2.5awhere Para-PhenyleneDiamine (PPD) increases by a factor of two the delay to consume similar O2amounts compared to BHT. This stabilizing effect resulting from the addition of trace species makes the study of real fuels
(a)THQ: 1,2,3,4-tetrahydroquinoline (b)BHT: Butylated hydroxytoluene
(c)N,N’-Bis(salicylidene)-1,3-propanediamine
Figure 2.4:Typical molecule from each antioxidant family. a), b) and c) are respectively H donor, peroxy inhibitor and
complexing agent
even more complex. Before attempting to work with all those interactions, detailed mechanisms will have to be validated on the oxidation of individual chemical families without additives.
(a)Antioxidant effect on head space oxygen consumption on JP-5 at 180◦C [55]. Results with no additives are repre-sented withN, results with addition of 25 mg/L and 100 mg/L of BHT are respectively with• and ■ symbols, re-sults with addition of 25 mg/L and 100 mg/L of PPD are presented with◦and ä.
(b)Antioxidant effect on O2decay rate. Data were obtained
with n-dodecane at 200◦C from Zabarnick [38]. The arrow illustrates the O2decay without antioxidant. In this case,
the AH effect is maximized for an AH concentration of 2 × 10⁻⁴mol/l (≈ 60ppm)
Figure 2.5:Antioxidant types and concentration effects on autoxidation kinetics.
Structure-reactivity relations in autoxidation
As presented earlier, real fuels are a complex blend of hundreds of species involving several chemical fam-ilies. To understand the stability of such media, we already highlighted the influence of the chemical composition on the oxidation stability. Yet, more precise chemical informations are still required to better describe the autoxidation stability of the different chemical families.
As an example, an overall reactivity increase with the paraffinic chain length has been reported in literature over several chemical families [56, 40, 57]. This is illustrated in Figure 2.6a and Figure 2.6b
where the increase of the paraffinic chain length leads to a decrease of the oxidation stability on both n-paraffins and cyclic molecules.
In addition, an unclear impact of molecules branching is also observed depending on the chemical family investigated [57,40]. As presented in Figure 2.7a, the stability tends to increase with branching level for paraffins whereas this impact is not observed for aromatics inFigure 2.7b.
(a)IP measurements for several n-alkanes obtained at 140◦C and 500 kPa of pure O2[57].
(b)IP measurements for several cyclic molecules obtained at 140◦C and 700 kPa of pure O2[40]
Figure 2.6:Chain length impact on the autoxidation kinetics
(a)IP measurements for a normal and iso paraffin obtained at 140◦C and 500 kPa of pure O2[57]. Isooctane stands for
2,2,4-trimethylpentane
(b)IP measurements for several aromatic molecules with sev-eral branching levels obtained at 140◦C and 700 kPa of
pure O2[40]
Figure 2.7:Uncertainties on the branching impact on autoxidation kinetics
number for a given number of carbons, an increase of insaturation degree stabilises cyclic and aromatic molecules. On the contrary, an increase of the insaturations number on alkanes decreases the stability as presented inFigure 2.2a.
Other results present a specific blending behaviour according to each component chemistry. As illus-trated inFigure 2.9a, autoxidation of blends may evolve linearly according to the proportion of individual components. While, in other conditions,the reactivity of blends may be very specific to the molecules se-lected. As presented inFigure 2.9b, the stability of decane blends may be either strongly or poorly impacted by a 10% addition of cyclic component. Surprisingly, a strong stabilizing effect is observed with the tetralin where the 10% blend of tetralin in decane is much stable than individual constituents.
This section illustrates the importance of understanding the oxidation kinetics of individual compo-nents. Yet, the study of the interaction of different components is also important to assess the complex phenomena occurring in real fuels LPA.
2.1.2 Chemical kinetics of autoxidation
As presented in the previous section, oxygen presence is a prerequisite for low temperature deposit forma-tion in the liquid phase. From the Semenov’s theory, autoxidaforma-tion process are assumed to proceed through
(a)IP measurements for a normal and unsaturated alkanes obtained at 140◦C and 500 kPa of pure O2[57].
(b)IP measurements for several mono and poly aromatic molecules obtained at 140◦C and 700 kPa of pure O2[40].
Figure 2.8:Insaturation impact on autoxidation kinetics
(a)IP measurements for an aromatic blend obtained at 140◦C and 500 kPa of pure O2 [57]. Percentages are given by
volume.
(b)IP measurements for blends cyclic compound in decane ob-tained at 140◦C and 700 kPa of pure O2[40].
Figure 2.9:Specific effect of blending on autoxidation kinetics.
a chain mechanism. As presented in Figure 2.10, the chain reaction is composed of three distinct steps: Initiation, Propagation and Termination. In literature, global chemical mechanisms [26, 38,58] for fuel autoxidation were proposed with similar chain mechanisms (C.f Figure 2.11) involving lumped species1. However, as commercial fuels are complex blends of compounds from several chemical families, appropri-ate thermochemical and kinetic data are required to get a meaningful mechanism. While, lumped species are used to describe oxidation pathways, structural isomers must be considered in each of them.
The initiation step
In low temperature regime, the thermal energy in liquid phase system is modest and the initiation step is still not fully elucidated. For this reason, the initiation step may be presented in several ways (Figure 2.12). Some authors consider the initiation step as resulting from trace level species (hydroperoxides decomposi-tion, azo-compounds decomposition), concerted H abstraction with O2 [38,8] or photochemical reactions2.
1Lumped species correspond to a mixture of several distinct molecules showing similar properties 2This initiation is not considered in all systems, such as tanks which are opaque to UV-visible light.
RH + O2−−−→ Rνi,ki ◦+ HO◦2 (i.1) Initiation RO2H → RO◦+ HO◦2 (i.2) Initiation R◦+ O2→ RO◦ 2 (p.1) Propagation RO2◦+ RH → RO2H + R◦ (p.2) Propagation R◦+ R◦ ν−−−→ terminationproductst,kt (t.1) Termination 2RO◦2−−−→ RO4νt,kt R (t.2) Termination
Figure 2.10:General presentation of a chain mechanism
Figure 2.11:Global mechanism for liquid phase autoxidation proposed by Zongo [6]
Others, consider the first step as unknown and introduce a lumped species (Initiator) to obtain the first alkyl radical. In addition, the initiation step may be catalytically enhanced by dissolved metals, surface effects, acid catalyzed and ionic reactions.
Propagation step
The reaction (p.1) between alkyl radicals and molecular oxygen is the main propagation path due to its low energy barrier (close to 0 kcal/mol) [26, 59]. Chain mechanism proceeds then through reaction (p.2) according to which the peroxi-radical reacts with the initial hydrocarbon to form hydroperoxides and a new alkyl radicals. Then RO2H decomposes (i.2) and forms new radicals which can also react with RH
RH + O2→ R◦+ HO◦2 RH + I → R◦+ IH
I nitiator → R◦
Figure 2.12:Potential initiation steps of liquid phase autoxidation
to produce more alkyl radicals. Those, in turn contribute to increase the chain reactivity. This chain mechanism is now well established in literature [31,60,6, 46] from the 1930’s with Semenov theory [61]. Recent experimental observations [62] of the QOOH radicals corroborate the consistency of such chain mechanism.
Termination step
The termination can be simplified as a sum of all intermediates reaction paths through dimerization [63], tetroxide formation [64], peracid formation, decarboxylation process, intra-molecular reactions, concerted acid and ketone formations, disproportionation reactions. As presented here, LPA is governed by a radical chain mechanism where overall reactivity is induced by branching steps (producing more radicals in the system). For short conversion system, the overall reaction can be expressed following few parameters [65] (kp,ki and kt and fuel concentration) as presented on equation2.1. Based on same principle, Bolland [66] proposed an oxidability criteria based on the ratio of propagation rates and termination rates as presented in equation2.2. V = s ki 2kt· kp× [RH] (2.1) K = kp p2kt = V [RH] ·pVi (2.2) As presented here, chemical kinetics involved in autoxidation is relatively well known for major product formation. However, the addition of isomers in all those steps cannot be performed manually. That is why the approach proposed in this manuscript relies on an automated mechanism generation in order to integrate all reactions - as comprehensively as possible - in oxidation mechanisms.
2.1.3 Oxidation products and deposition processes
In order to study the deposition process involved in LPA, it is a major concern to identify the deposit precur-sors and the pathways involved in their formation. Those need to be integrated into kinetic mechanisms. As paraffins are usually the main fuel constituents and the resulting products from all drop-in fuels like Biomass to Liquid (BtL), Coal to Liquid (CtL) and Gas to Liquid (GtL), they were selected during this thesis to evaluate the robustness of liquid phase mechanism generation methodology. For this reason, the present literature review of oxidation products formation focuses mainly on this chemical family as presented in this section. Studies investigating other fuel constituents like naphtenes, cycloalkanes or oxygenated com-pounds are available3 but are out of the scope of the present work. For the sake of clarity, the oxidation pathways are presented with lumped species, structural isomers should be considered for these species when it applies.
Oxidation products formation
Hydroperoxides have been widely described in literature [8,31,67,44] as the first oxidation product. These highly reactive species, even at very low concentration, are formed mainly by oxygen addition on alkyl radicals and a subsequent H-abstraction as presented inFigure 2.10. They thermally decompose to produce two radicals which subsequently produce first stage oxidation products, alcohols and ketones, as shown in
Figure 2.13.
ROOH → RO◦+ OH◦ RO◦+ RH → ROH + R◦ (a)Alcohol formation (ROH)[60]
RO◦
2+ R1R2CHOOH → RO2H + R1R2C◦OOH R1R2C◦OOH → R1R2CO + OH◦
(b)Ketones formation (RO)[60]
Figure 2.13:Major pathways leading to oxygenated species formations
Second stage oxidation products include to several oxidized products including most likely lower molecular weight products compare to fuel like ketones, acids and aldehydes. Many pathways were pro-posed in the literature for the formation of those species. Due to the mechanism generator requirements, our interest was focused on reactions describing elementary steps only.
As observed in the gas phase [68], an isomerization step of alkyl-peroxy radical (ROO◦) radicals is compet-ing with ROOH formation as proposed by Korcek et al [31] and presented in Figure 2.14a. This compe-tition leads to the formation of Keto-Hydro-Peroxide (KHP) and initiates the "so-called" Korcek’s reaction
(Figure 2.14b). Thanks to a recent work from Jalan et al. [69], Electronic Structure Calculations (ESC)
validated this two-step reaction formulated by Korcek in the 70’s. This reaction starts with a concerted keto-hydroperoxide cyclisation, then the cycle breaks following two pathways: to form either acids and ke-tones or acids and aldehydes depending on the R1and R2groups on the molecule. Another pathway leading to the lighter oxidation products formation is the direct homolytic C-C bond breaking. These reactions may occur through eitherα/βdecarbonylation or cracking reactions (Figure 2.14c). This leads to the formation of lower n-alkanes, alkenes, carbonyles and light gases like CO ,CO2, water [29,70,44,71,72].
Finally, a group of reactions, involving late oxidation reactions with a maintain or a growth of oxi-dation products size may be presented. One of them is the Baeyer-Villiger rearrangement which conserves reactant size. This reaction starts from peracids [8, 9] and leads to acids and esters formation through several intramolecular and concerted stepsFigure 2.15. Still maintaining reactants size, oxygenated cycle like lactones, furanones or epoxides [73,67,8,63] may be formed with not well known chemical pathways 4. Further investigations are still required to get relevant pathways for these producs. Finally, all the reticulation/termination steps that form heavier oxidation products like Tetroxides (RO4R’)[64] or alkanes (R’R)[63] are well defined in literature.
Despite the apparent simplicity of the above-mentioned autoxidation paths, co-oxidation or poly-substituted products formation (poly-poly-substituted hydroperoxides [31,8]) must be considered.
Deposition process
Deposition issues, involved in refinery and fuel injection systems, have been already studied for several decades [22,74,41]. Due to the complexity of the deposition processes, this section aims to briefly introduce the overall phenomenology of deposit formation with its key parameters. As mentioned in Figure 2.3a, autoxidation regimes influences the kind of deposits formed. Two types of deposits can be distinguished. A
RH + I → R◦ O−−→ RO2 ◦2−−−−→ HOOQisom. ◦ O−−→ HOOQOO2 ◦ isom.−−−−→ O = QOOH + OH◦ (a)Korcek’s initiation: KHP formation
(b)Major steps presenting Korcek’s reaction. As presented, the second path requires R2
as an H to be possible. Further information with the detailed PES are available in literature [69].
(c)Major intermediates in the CC bond breaking reactions. All akyl radicals intermediates can lead to alkenes as presented in Zador et al. [68]
Figure 2.14:Major pathways leading to lighter oxidation products formation
first one which is pyrolytic (coke composed mostly of C and H atoms) and a second with oxygenated deposits. Other types of deposits have been evidenced in literature, like the soap deposits, but they are not presented in this work [75,3].
A first approach, is to consider only the reactivity inside liquid bulk to form deposits as presented in
Figure 2.16[76,10]. This process is a sum of a chemical process corresponding to the autoxidation inside
the liquid bulk then a physical process with the deposit formation on wall-surfaces. First, fuel autoxida-tion leads to the formaautoxida-tion of deposit precursors in the liquid phase. These precursors agglomerate into bigger molecular weight products. Those may interact finally with the surface, or they continue growing until reaching their solubility limit and accumulate on side-walls. The sediments then react by thermal degradation or surface reaction to form varnish which in turn capture deposits precursor and increase the overall deposit size.
Another approach is to consider catalytic interactions between fuel and surfaces with heated plate experiments. Recent work presented specific fuel-surface interactions for several biodiesel blends [3] and identified specific surfaces that increased the deposition rates and influence deposit morphology.
A reduction of deposits amount is also observed in literature when fresh fuel is solubilizing a fraction of the deposit [77]. This deposition reduction process is called the "washing" and illustrates a possible equilibrium between deposits and the liquid bulk.
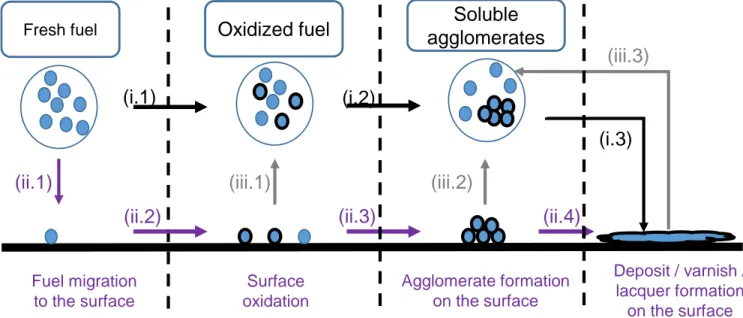
To conclude, the overall process of deposit formation from fuel autoxidation may be represented as shown inFigure 2.17 with all the interactions previously presented: (i) bulk reactivity, (ii) catalytic reac-tions with the surfaces and (iii) the deposit-bulk equilibrium caused with washing phenomenon.
Figure 2.15:Major reaction steps from the Bayer-Villiger reaction [7,8,9]
(a)Chemical processes involved in deposit formation
(b)Physical processes involved in deposit formation
Figure 2.16: Illustration of the close relation between chemical and physical processes on deposition mechanism.
Modified scheme from Beaver et al. [10]
2.2
Solvent modeling
The previous section presented key steps of fuel autoxidation in liquid phase. This section aims to present chemical engineering aspects governing LPA. The presentation of the multiphase competition in LPA is presented, then the solvent effects on both thermochemistry and kinetic are discussed. First, a brief pre-sentation of the heterogeneity of LPA is introduced and illustrated with experimental observations.
2.2.1 Heterogeneity inside the liquid bulk
In most autoxidation studies, the liquid phase is considered as an homogeneous media often isothermal. However, the oxidation media is not always homogeneous, for example, multiphases temperature spikes may be observed during autoxidation of fatty-compounds and heavy hydrocarbons [78,11].This high energy release is not systematic as observed for iso-hexadecane inFigure 2.18aand is linked to the hydroperoxides decomposition rate which is a very exothermic step. Similarly to gas phase with ignition delay, in one condition the system generates high amounts of hydroperoxides before they decompose. The accumulation step induces a high energy release when the hydroperoxides decompose, assimilable to a thermal runaway
Fresh fuel
(ii.1)
(i.1)
Soluble
agglomerates
(i.2)
(iii.1)
(ii.3)
(i.3)
(iii.2)
(ii.2)
(ii.4)
(iii.3)
Oxidized fuel
Surface oxidation Agglomerate formation on the surface Deposit / varnish / lacquer formation on the surface Fuel migration to the surfaceFigure 2.17: Global process for the deposit formation. The bulk reactivity path (i) is represented with black arrows.
The catalytic oxidation path (ii) is represented with purple arrows. The solubility of deposit into fresh solvent (iii) is represented with grey arrows.
in the gas phase. While in other conditions, the smaller hydroperoxide accumulation induces a smaller and slower energy release which is progressively absorbed and diffused inside the whole liquid.
(a)Autoxidation of paraffins at 160◦C [11]: (1) hexadecane, (2) isohexadecane (heptamethylnonane), (3) squalane (hexam-ethyltetracosane), and (4) pristine (tetramethylpentade-cane)
(b)Autoxidation of esters at 170◦C [11]: (1) dimethyl sebacate, (2) dibutyl sebacate, (3) dioctyl sebacate, and (4) pentaery-thritol ester
Figure 2.18:Temperature profile during the autoxidation of several compounds [11]
In addition, as presented inFigure 2.19a, polar molecules like hydroperoxides and oxygenated prod-ucts self-assemble into Reversed Micelles (RM) during the autoxidation processes [79, 80, 11, 78]. The formation of such structure reveals the existence of a network of RMs inside the liquid bulk during au-toxidation process and indeed a high concentration gradient of hydroperoxides between RM and the liquid bulk. As considered with the chain mechanism presented inFigure 2.19b, these RMs may interact with the formation of first oxidation products.
This section introduced the liquid phase heterogeneity that may occur during the autoxidation ac-cording to two aspects: the possible non isothermal conditions and the nanoreactor structures (RM) that may play a role in the chain reaction process.
(a)Schematic of the Reverse Micelle formation [81]. Po-lar heads are oriented towards the center of the structure and apolar parts of molecules are oriented in the oposite direction.
(b)Hypothetical impact of the Reverse Micelles (RM) on the first stage of autoxidation [78]. Polar products accumulate inside the RM and react inside the structure to give either volatile products or radicals that can contribute to the chain reaction.
Figure 2.19:Illustration of Reverse Micelle formation and its implication in the chain mechanism of autoxidation
2.2.2 Phase equilibrium in liquid phase autoxidation Gas diffusion towards liquid phase
As presented in the previous section, O2is a key species to consider in liquid phase autoxidation. Contrary to gas phase, liquid phase concentration of oxygen (or any other gases) is limited by its solubility in the solvent of interest. Henry’s Law (HL) Equation (2.3) gives oxygen concentration calculation into the liquid at the limit of diluted solutions. The relation links partial pressure, pi, of a species i to its liquid phase concentration, ciwith Henry’s coefficient, kh.
pi= kh× ci (2.3)
HL coefficients are available for many gases (H2, He, Ne, O2, N2, CO2, ...) in several solvents (alkanes, alcohols, esters, cycloalkanes, aromatics). However, only few experimental data for hydrocar-bons/molecular oxygen mixtures are available. Pure solvent estimation of HL are available in DETHERM database [82] using empirical relations. In addition, some chemical structure-property relationships have been presented in literature [83, 84, 85]. HL data are limited to steady states conditions but for real re-acting system, O2 may not reach the steady state due to diffusional limitations. The diffusion inside the bulk is linked to the interfacial areas which can be either natural (free interface between gas and liquid) or forced (bubbling system with multiple spherical interfaces). In both cases, the diffusion process can be expressed using a film model such as the Whitman model presented inFigure 2.20for a reacting system. When the system is perfectly mixed (no diffusion limit) or at the equilibrium, film sections (gas and liquid) does not exist (δg= 0 andδl= 0) and concentration gradients inside each phase become negligible.
As the molecular oxygen concentration in the liquid phase is very low (typically 1000 ppm for n-paraffins at 298 K), a competition between oxygen diffusion into the solvent bulk and its consumption may occur easily in highly reactive conditions.
Gas desorption from liquid
Due species volatility, some lighter compounds may diffuse from the liquid phase to the gas phase (such as H2, CO, CO2 or light oxygenated products). Vapor pressure can be calculated using the empirical Antoine
Figure 2.20: Whitman model presentation for a reacting system consuming A in the liquid phase. PA is the partial pressure and CA,gthe concentration of species A in the gas phase. Indices g, l and i respectively stand for gas liquid, and interface.
equation (2.4). This equation allows to quantify evaporation rate of liquid products in the gas phase (A and B being two parameters relevant to the molecule volatility). Multiphase mass transfer issues presented in this part underlines the need of a specific multiphase reactor for the modeling of these phenomena. Thus, the multiphase reactor will have to considerer both HL coefficient of gas phase species and product partial pressure of liquid phase species to model those equilibrium states.
log10(P) = A − B
(T + C) (2.4)
2.2.3 Solvent effects in liquid phase autoxidation
As presented inFigure 2.23, the solvent impacts both thermochemistry and apparent kinetic rates. This statement has been discussed by various authors [8,86,12]. Although thermochemical and the kinetic data in liquid phase can be measured directly from experimental data, defining both parameters in all solvent of interest is not realistic. On the other hand, there is a growing interest in correcting the gas phase data from literature by applying corrections corresponding to the solvent effect. This section aims to presents how those data can be obtained. Each section is divided into two parts, the first one presents the tools available in literature to calculate solvent corrections. The second one is devoted to the method used in the present work.
Impact on the thermochemistry
To present the liquid phase correction,∆Gsolv, a thermodynamic cycle is given inFigure 2.21. It includes all individual corrections to consider from real gas mixture to concentrated solute in solvent. Corrections can be divided into four main steps [86]: (1) ideal states corrections (where gases and liquids are moved from concentrated to diluted conditions), (2) cavity formations correction, (3) Van der Waals corrections (also called dispersion-repulsion forces) and (4) electrostatic contributions referring to the charge distribution in the solvent.
The accuracy of the results is indeed a function of each correction which can be evaluated sepa-rately (by molecular modeling) or corrected collectively (using semi-empirical methods). The accuracy of the methods relies on the description of solute-solvent interactions on both semi-empirical methods (with solute-solvent descriptors) and computational modeling methods (using different solvent description the-ories). The level of description of solvation in molecular modeling is presented in Figure 2.22. Solvation models can be divided into two approaches. In the first one, solvent molecules surrounding the solute are represented explicitly (in a, b and c). In the second one, a continuum model is used to model all (in f) or part of the solvent (d and e). In both approaches, molecules can be either described using Quantum Me-chanics (QM) or Molecular MeMe-chanics (MM). Assessment of these methods and their accuracies have been performed in literature [86].
Figure 2.21: Thermodynamic cycle presenting solvation process. Grey arrow represents the Free energy change
between ideal gas to diluted solute in solvent. Diagram is from Jalan et al. [12]
To overcome these limitations, semi-empirical methods, like the Linear Solvation Energy Relation (LSER) method described are still widely explored. These methods require parameters, mainly based on physical properties of both solute and solvent to obtain solvation corrections. Many species/solvent pairs can
be investigated and the solvation correction is obtained using a small set of equations (Cf. Equations (2.5) to (2.9)). However, only stable products parameters can be obtained experimentally and calculations are still required for radicals or short life-time species. This is the main raison why this method was retained in RMG to obtain high-throughput solvation estimation for all species involved in the mechanism[69].
In RMG, the liquid phase thermochemistry is calculated according to two steps, both using LSER methods. The first one, expressed in (2.5), consists in calculating the liquid phase Free Energy of the species, Gl iq, using the Free Energy of solvation, ∆Gsolv, on its gas phase Free Energy, Ggas. ∆Gsolv is obtained with (2.6) and the partition function, kva por−solventof a given solute-solvent pair given by (2.7). LSER method based on Abraham’s models (presented in (2.7)) [87] provides an estimation of this partition coefficient at 298 K. In these coefficients, a first set is referring to solute descriptors (E,S,A,B,L) and a second to solvent descriptors (c,e,s,a,b,I). The second step of the calculation is to calculate the enthalpy of solvation (∆Hsolvation) at 298 K using Mintz’s model, also based on Abraham’s model. With Mintz’s model, solute descriptors remain the same and solvent descriptors (c’,e’,s’,a’,b’,I’) are obtained through a new empirical correlation [88] and give∆Hsolvationat 298 K is obtained using (2.8). Decomposing∆Gsolv(298K ) in H −TS, gives ∆Ssolv(298K ). As ∆Hsolv and ∆Ssolv are assumed to be temperature independent, ∆Gsolv can be expressed as a function of temperature following (2.9). Those assumptions give reasonable agreements (0.5 kcal/mol RMSE5) in many systems as presented by Jalan et al. [15] over 900 data points. Further work is required to better predict the thermochemistry of oxygenated solvents.
Gl iq= Ggas+∆Gsolv (2.5)
∆Gsolv= −RT ln(Kva por−solvent) (2.6) log Kva por−solvent= c + eE + sS + aA + bB + lL (2.7) ∆Hsolv(298K ) = c0+ a0A + b0B + e0E + s0S + l0L (2.8) ∆Gsolv(T) =∆Hsolv(298K ) − T∆Ssolv(298K ) (2.9) In equations (2.7) and (2.8), sS term corresponds to the electrostatic interactions, eE accounts for residual contributions from dipolarity/polarizability, lL term is attributed to the cavity formation and dis-persion interactions, aA and bB terms respectively stand for the ability to donate hydrogen (acidity) and accept hydrogen (basicity).
Impact on the kinetics
Transition State Theory Solvents effects impacts rates according to three different effects: (1) by in-creasing or dein-creasing the activation energy (Ea) (as presented inFigure 2.23), (2) barrier recrossing and (3) by local diffusion-reaction competition(cage scale). Many observations of solvent effects on kinetic are presented in literature. They indicate a modification of the liquid phase kinetics compare to gas phase values [8,89]. Kinetic Solvent Effect (KSE) on energy barrier may be explained by the Menschutkin effect
(Cf. Figure 2.23b). When a Transition State (TS) is more polar than the Reactant (RCT), the use of polar
solvent stabilizes TS and decreases Ea value.
Then, as presented by Hynes [90], the solvent may induce barrier recrossing and reaction coordinate due to solvent friction(ζ). In chemical system with competing reactions, a reaction coordinate less impacted by solvent friction may become predominant beside (origin) major one highly impacted by solvent effects. The relation derived from Kramers’s theory (2.10) demonstrates that for low friction ( ζ
2 ·ωb ¿ 1), k ≈ k T ST
![Figure 1.3: Simplified representation of a common rail injection system in a 4-cylinder engine from [ 3 ]](https://thumb-eu.123doks.com/thumbv2/123doknet/2720204.64418/19.918.92.832.609.810/figure-simplified-representation-common-rail-injection-cylinder-engine.webp)