HAL Id: hal-00380949
https://hal.archives-ouvertes.fr/hal-00380949
Submitted on 15 May 2009
HAL is a multi-disciplinary open access
archive for the deposit and dissemination of sci-entific research documents, whether they are pub-lished or not. The documents may come from teaching and research institutions in France or abroad, or from public or private research centers.
L’archive ouverte pluridisciplinaire HAL, est destinée au dépôt et à la diffusion de documents scientifiques de niveau recherche, publiés ou non, émanant des établissements d’enseignement et de recherche français ou étrangers, des laboratoires publics ou privés.
Lowest Flicker-Frequency Floor Measured on BVA
Oscillators
Alexander Kuna, Jan Cermak, Ludvik Sojdr, Patrice Salzenstein, Frédéric
Lefebvre
To cite this version:
Alexander Kuna, Jan Cermak, Ludvik Sojdr, Patrice Salzenstein, Frédéric Lefebvre. Lowest
Flicker-Frequency Floor Measured on BVA Oscillators. IEEE Frequency Control Symposium
& 23rd European Frequency and Time Forum, Apr 2009, Besançon, France. pp.185 - 187,
Lowest Flicker-Frequency Floor Measured on BVA
Oscillators
A. Kuna, J. Čermák, L. Šojdr
Institute of Photonics and Electronics
Czech Academy of Sciences Prague, Czech Republic
[email protected] P. Salzenstein FEMTO-ST Institute CNRS Besançon, France [email protected] F. Lefebvre Oscilloquartz S.A. Neuchâtel, Switzerland [email protected]
Abstract—In this paper we will present the results of the
time-domain measurement of short-term frequency stability on seven ultra-stable 5 MHz Oscillloquartz 8600 and 8607 BVA oscillators. The measurement took place in the Institute of Photonics and Electronics (IPE) in July 2008 and was a continuation of the previous stability measurements of BVA oscillators reported in VI.
I.INTRODUCTION
The state-of-the-art quartz oscillators based on the BVA technique are extremely stable frequency sources in the short term VI. Their limiting noise has a character of flicker frequency modulation with the noise floor of less than 4x10-14
in terms of Allan deviation, σy(τ), of average fractional
frequency. Thus at averaging intervals of a few seconds, the BVA quartz oscillators achieve better stability than the best active hydrogen masers.
To measure the short-term frequency stability of these precision oscillators, a highly sensitive measurement system is needed with background stability less than 10-14 at 1 s.
Unfortunately the commercially available instruments do not provide such performance and therefore dedicated laboratory system has to be built to satisfy this requirement.
At the Time and Frequency Department we have developed such system based on the classical dual-mixer time-difference multiplication (DMTDM) VI, VI, VI, VI, VI, VI, VI which we have optimized to achieve the minimum background noise at an averaging interval of 1 s VI, VI. The first experimental version appeared in 2003 and since then much improvement has been made VI, VI.
The capability of our system has recently been verified in repeated measurements on the best ever produced BVA quartz oscillators VI. The measurements have been carried out within the #847 EURAMET Project in collaboration with Franche
Comté Electronique Mécanique Thermique et Optique - Sciences et Technologies, Besançon, France, and with the
producer of the oscillators – Oscilloquartz (OSA) S.A., Neuchâtel, Switzerland. The two partners provided the 5 MHz
8607 OSA oscillators which we measured along with our 8600 two OSA BVA units.
II.MEASUREMENT BASICS
The measured quantity is the variations in the phase-time difference between two quasi-synchronous sine-wave signals at nearly equal frequency. The measurement sensitivity is enhanced using the dual-mixer time-difference multiplication (DMTDM).
The method is based on dual mixing the two compared signals at frequency ν with a signal at frequency ν ± νB from a
common oscillator (CO) to provide two beat-note signals at ν
B. The multiplication factor is thus M = ν/νB.
A time-interval counter then periodically measures the time interval, xk, between two adjacent zero-crossings of the
compared beat-note signals.
The measurement result is the frequency stability estimated from the sequence {xk} in terms of Allan deviation
σy(τ) as a function of the averaging time interval τ VI, VI.
Since these ultra-stable oscillators have comparable short-term stability none of them can be taken as reference as it is common in metrology. Thus what we actually obtain from the comparison is the pair stability rather than individual stability
σ2
ΑΒ(τ) = σ2Α(τ) + σ2Β(τ). (1)
To decompose the pair stabilities into individual stabilities we need to measure at least three oscillators and then employ the three-cornered-hat method under the assumption of uncorrelated signals.
III.PHASE-TIME COMPARATOR
Dedicated laboratory phase-time comparator, IPE3, based on DMTDM technique has been used during our comparisons. The common signal of the comparator is provided from a
The work has been sponsored by the Czech Office for Standards, Metrology and Testing (No. III/13/08 Project).
5 MHz Milliren MTI260-504A quartz oscillator. Its output frequency is offset by 5 Hz and the output level is low-noise amplified to +11 dBm.
The comparator makes use of Stanford Research SR620 time interval counter. The measured data is collected by PC and further processed using the Stable32 software VI.
The equivalent noise bandwidth of the IPE3 system is 26 Hz and it can be optionally switched to 260 Hz.
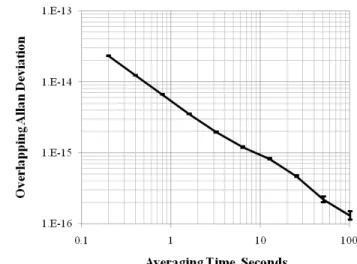
IIIshows the results of the system background stability tests by using two +4 dBm signals power split from one BVA reference oscillator.
Given the extremely high sensitivity of the measurement, we have experienced great difficulties in reducing the electromagnetic interference and other environmental effects that occur irregularly and make the disturbing process non-stationary in the short-term sense.
To our knowledge the background stability of 5.6x10⁻¹⁵ at
1 s in 26 Hz bandwidth is the best ever achieved in a time-domain measurement at 5 MHz. Thus our DMTDM is a unique system that allows to measure the best BVA oscillators. It may also be considered as a benchmark for the future systems that will employ immediate analog-to-digital conversion of the measured signal.
Figure 1. Background stability of IPE3 system.
IV.COMPARED OSCILLATORS
During the last measurement campaign in July 2008 we had at our disposal seven BVA oscillators listed in IV
TABLE I. COMPARED OSCILLATORS Type S/N Possessed By Name
8600 291 IPE A 8600 315 IPE B 8607 199 FEMTO-ST D 8607 543 OSA E 8607 567 OSA F 8607 691 OSA G 8607 692 OSA H
Each oscillator showed the flicker frequency modulation floor of less than 1x10-13.
Before the measurement all of the oscillators were mounted into extra cases each with an arrangement for fine tuning with a relative resolution of 1x10-12. These extra cases
also ensured additional shielding for the oscillators. The fine tuning allowed us to maintain the compared signals in quasi-synchronism to within 1 ns which is needed to reject the noise originating from the DMTDM common oscillator.
Each measurement session lasted at least 4000 s which, given the basic sampling interval of 200 ms, provided robust enough statistics for stability analysis. We have performed about hundred of these measurement sessions in different periods of day and week with all possible combinations of oscillator pairs.
To reject disturbances from power line the phase-time comparators and all of the oscillators were battery powered during all measurements. In addition the time interval counter and computer collecting data were both powered from isolation transformer.
V.MEASUREMENT RESULTS
Seven oscillators make 21 possible oscillator pairs from which we focused mainly at three best units E, F and H.
Oscillator pair stabilities σEF(τ)i, σEH(τ)i and σFH(τ)i are
shown in Figure 2 to Figure 4. Here the confidence intervals are hidden for sake of clarity. The corresponding number of performed comparisons is 11, 14 and 16, respectively.
Stable32 analysis tool has been used for calculation of frequency stability of each oscillator pair.
Outliers and frequency drift have been removed from measured data prior to all calculations.
Figure 2. Frequency Stability of E-F Oscillator Pair
Figure 3. Frequency Stability of E-H Oscillator Pair
Figure 4. Frequency Stability of E-H Oscillator Pair
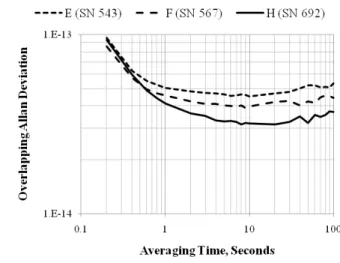
By employing over-determined three-cornered-hat method, we have obtained the results depicted in Figure 5.
Figure 5. Frequency stability of the reference oscillators of the OSA
The corresponding flicker-frequency floors are 3.2x10⁻¹⁴,
4.0x10⁻¹⁴ and 4.5x10⁻¹⁴, respectively, in terms of Allan
deviation for averaging interval of 5 s. VI.CONCLUSIONS
In measuring these ultra-stable oscillators it is useful to introduce a model of inherent stability which is the one obtained with a near-ideal measurement system in non-interfering and stable environment (i.e. with no external electromagnetic interference, stable temperature, no vibrations etc.). Given the low background noise of our DMTDM system and stable environmental conditions in the laboratory, we can assume that our measurement approximates this case. It follows that the stability shown in Vrepresents the oscillator
noise limits and its performance potential in a given bandwidth. The user, therefore, must consider this result in terms of the oscillator’s best capability. Consequently, if he wants to make full use of this capability he must operate the oscillator in “near-ideal” conditions concerning both the application and the environment.
The FFM floor of 3.2x10⁻¹⁴ in terms of Allan deviation for averaging interval of few seconds obtained for the H (SN 692) unit is in our point of view the best value ever reported on a BVA oscillator.
REFERENCES
[1] A. Kuna, J. Čermák, L. Šojdr, P. Salzenstein, and F. Lefebvre, “Comparison of Ultra-Stable BVA Oscillators,” Proc. 22nd EFTF, 2008
[2] J.-P. Aubry, J. Chauvin, and F. Sthal, “A new generation of very high stability of BVA oscillators,” Proc. 21st EFTF- IEEE FCS, June 2007 [3] D.W. Allan and H. Daams, “Picosecond time difference measurement
system,” Proc. 29th Annu. Symp. Frequency Contr., Atlantic City, USA, pp. 404-411, 1975.
[4] S. Stein, D. Glaze, J. Levine, J. Gray, D. Hilliard, D. Howe and L.A. Erb, “Automated high-accuracy phase measurement system,” IEEE Trans. Instrum. Meas. vol. IM-32, pp. 227-231, (1983).
[5] S.R. Stein, “Frequency and time – their measurement and characterization,” in Precision Frequency Control, vol. II, E.A. Gerber and A. Ballato, Eds. New York: Academic Press, pp.229-231, (1985). [6] L. Sze-Ming, “Influence of noise of common oscillator in dual-mixer
time-difference measurement system”, IEEE Trans. on Instr. And Meas., vol. IM-35, pp. 648-651 (1986).
[7] R. Barillet, “Ultra-low noise phase comparator for future frequency standards (Comparateur de phase ultra faible bruit pour les futurs étalons de frequence),” Proc 3th EFTF, pp. 249-254, March 1989. [8] C.A. Greenhall, “Common-source phase error of a dual-mixer stability
analyzer,” TMO Progress Report 42-143, Jet Propulsion Laboratory, November 2000.
[9] G. Brida, “High resolution frequency stability measurement,” Rev. Sci. Instrum., vol. 73, pp. 2171-2174, May 2002.
[10] L. Šojdr, J. Čermák and G. Brida. “Comparison of high-precision frequency-stability measurement systems,” Proc. Joint IEEE FCS/EFTF Meeting, pp. 317-325, May 2003.
[11] L. Šojdr, J. Čermák and R. Barillet, “Optimization of dual-mixer time-difference multiplier,” Proc. 18th EFTF, CD: Session 6B/130.pdf, April 2004.
[12] D.W. Allan, “The statistics of atomic frequency standards,” Proc. IEEE, vol. 54, No. 2, pp. 221-230, February 1966.
[13] J.A. Barnes, et al, “Characterization of frequency stability,” IEEE Trans. Instrum. Meas., Vol. IM-20, No. 2, pp. 105-120, May 1971. [14] “Stable32 version 1.54: frequency stability analysis,” Hamilton