HAL Id: hal-03025212
https://hal.laas.fr/hal-03025212
Submitted on 26 Nov 2020HAL is a multi-disciplinary open access archive for the deposit and dissemination of sci-entific research documents, whether they are pub-lished or not. The documents may come from teaching and research institutions in France or abroad, or from public or private research centers.
L’archive ouverte pluridisciplinaire HAL, est destinée au dépôt et à la diffusion de documents scientifiques de niveau recherche, publiés ou non, émanant des établissements d’enseignement et de recherche français ou étrangers, des laboratoires publics ou privés.
Nanoscale Evidence Unravels Microalgae Flocculation
Mechanism Induced by Chitosan
Irem Demir, Jonas Blockx, Etienne Dague, Pascal Guiraud, Wim Thielemans,
Koenraad Muylaert, Cécile Formosa-Dague
To cite this version:
Irem Demir, Jonas Blockx, Etienne Dague, Pascal Guiraud, Wim Thielemans, et al.. Nanoscale Evi-dence Unravels Microalgae Flocculation Mechanism Induced by Chitosan. ACS Applied Bio Materials, ACS Publications, 2020, 3 (12), pp.8446-8459. �10.1021/acsabm.0c00772�. �hal-03025212�
Nanoscale evidences unravel microalgae flocculation mechanism
1induced by chitosan
23
Irem Demir1,2ⱡ, Jonas Blockx3,4ⱡ , Etienne Dague2,5, Pascal Guiraud1,5, WimThielemans3,
4
Koenraad Muylaert3,4, and Cécile Formosa-Dague1,5* 5
6
1
TBI, Université de Toulouse, INSA, INRAE, CNRS, Toulouse, France 7
2
LAAS, Université de Toulouse, CNRS, Toulouse, France 8
3
Sustainable Materials Lab, Department of Chemical Engineering, KU Leuven, Campus Kulak Kortrijk, 9
Belgium 10
4
Laboratory for Aquatic Biology, KU Leuven, Campus Kulak Kortrijk, Belgium 11
5
Fédération de recherche FERMAT, CNRS, Toulouse, France 12
13 14
ⱡThese two authors equally contributed to the work 15
Corresponding author: Cécile Formosa-Dague, formosa@insa-toulouse.fr 16
17 18 19
ABSTRACT 20
In light of climate change, there is a growing interest for sustainable energy. Microalgae are a 21
promising resource for biofuel production, although their industrial use is limited by the lack of 22
effective harvesting techniques. Flocculation consists in the aggregation and adhesion of cells into 23
flocs that can be more easily removed from water than individual cells. Although it is an efficient 24
harvesting technique, contamination is a major issue as chemical flocculants are often used. An 25
alternative is to use natural biopolymers flocculants, such as chitosan. Chitosan is a bio-based non-26
toxic polymer, which has been effectively used to harvest Chlorella vulgaris cells at pH lower than its 27
pKa (6.5). While the flocculation mechanism reported relied on electrostatic interactions between 28
chitosan and the negative cell surface, no molecular evidence has yet confirmed this mechanism. In 29
this study, we performed force spectroscopy AFM experiments to probe the interactions between C. 30
vulgaris cells and chitosan at the molecular scale to decipher its flocculation mechanism. Our results
31
showed that at pH 6, chitosan interacts with C. vulgaris cell wall through biological interactions, 32
rather than electrostatic interactions. These observations were confirmed by comparing the data 33
with cationically modified cellulose nanocrystals, for which the flocculation mechanism, relying on an 34
electrostatic patch mechanism, has already been described for C. vulgaris. Further AFM experiments 35
also showed that a different mechanism was at play at higher pH, based on chitosan precipitation. 36
Thus this AFM-based approach highlights the complexity of chitosan-induced flocculation 37
mechanisms for C. vulgaris. 38 39 40 41 42 43 44
KEYWORDS: Atomic force microscopy, Force spectroscopy, Microalgae, Flocculation, Chitosan, 45
Cellulose nano-crystals 46
These last two decades, the global interest for microalgae has increased, notably because of 47
their oil production capacity that makes them an interesting alternative resource for biofuel 48
production.1 Indeed, several studies have estimated that microalgae could produce between 40 000 49
and 90 000 L of biofuel per Ha, depending on the sunlight and the biomass oil content of the species 50
considered.2–4 This represents up to 200 times more liters than soybean and 25 times more liters 51
than oil palm.5 Among the wide variety of microalgae species, several have been considered for 52
biofuel production such as Chlorella vulgaris. C. vulgaris is a unicellular freshwater microalgae species 53
first discovered in 1890 by a Dutch researcher.6 This species first attracted attention in the 1950s for 54
its nutritional value, as its protein content represents up to 55% of its dry mass7. Nowadays, C. 55
vulgaris is mainly used for nutraceutical purposes; studies have shown for example that it has
56
immune-modulating and anti-cancer properties8,9, but has also received interest for biofuel 57
production4. Indeed, C. vulgaris has the capacity to accumulate important amounts of lipids under 58
certain culture conditions, with a fatty acid profile adapted for biofuel production.7,10,11
59
But presently, the commercialization of microalgae-based biofuels is hindered by the lack of 60
economically competitive harvesting techniques, as this step is generally estimated to represent 20-61
30% of the total microalgal biomass production cost.12,13 In the case where the harvesting step is 62
combined with lipid extraction, as needed in biofuel production processes, this cost can increase up 63
to 90%, resulting in a negative energy balance for the production of microalgae-based biofuels at 64
large scale.14–16 The parameters that make harvesting microalgae such a challenging task are their 65
low concentration in water, their small cell size, their negatively charged surface, and their low 66
density. So far, different harvesting techniques have been proposed, including centrifugation, 67
filtration, flotation, flocculation, and electrical-based processes. A recent review compared and 68
described the advantages and disadvantages of each of these techniques.13 Among them, 69
flocculation stands out as it is inexpensive, making it an option for large-scale harvesting for a wide 70
variety of microalgae species.17 Flocculation consists in the aggregation of cells to facilitate their 71
separation from water by sedimentation or flotation for example. While this technique presents 72
many advantages, a major issue in flocculation is contamination, as it often requires the use of 73
chemical flocculants to induce flocculation, which end up in the harvested biomass, and can interfere 74
with downstream processes or with its final application.18 In this context, an interesting alternative is 75
to use biopolymers to induce flocculation19, the most popular in microalgae harvesting being 76
chitosan. 77
Chitosan is a cationic polyelectrolyte obtained by deacetylation of chitin, an abundant 78
natural polymer. Chitosan presents many advantages compared to traditional inorganic flocculants 79
as it is non-toxic, biodegradable, biocompatible, and renewable.20,21 Moreover, chitosan does not 80
contaminate the harvested biomass as chitin-like polysaccharides are naturally present in the cell 81
wall of many microalgae species, including C. vulgaris, and thus harvested cells can then be directly 82
exploited.22 Chitosan-induced flocculation has so far been used to harvest successfully both fresh-83
water and marine microalgae species. For fresh-water species such as C. vulgaris, its efficiency is 84
mostly attributed to the amino groups present in chitosan. These groups have a pKa value of about 85
6.523, and thus below this pH these groups are mostly protonated and confer a positive charge to 86
chitosan, which allows supposedly its electrostatic interaction with the negatively charged surface of 87
microalgae cells.24 As a result, cells are believed to be flocculated through a charge neutralization 88
mechanism.25–27 In the case of marine microalgae species, mixed results on chitosan efficiency have 89
been reported. Indeed, at the high ionic strengths of marine waters, it is believed that the positives 90
charges of chitosan are shielded, preventing further flocculation through charge neutralization. 91
However some studies reported successful flocculation of certain marine species by chitosan28–31, 92
which may suggest that chitosan-induced flocculation may rely on different interactions between 93
chitosan and cells than electrostatic interactions. In this view, an interesting paper from 2011 94
focused on the influence of the cell wall carbohydrate composition of C. vulgaris on the efficiency of 95
chitosan-induced flocculation.32 The results obtained in this study show that a higher polysaccharide 96
content (including neutral sugars, uronic acids and amino sugars) in the cell wall is associated with a 97
better efficiency of flocculation with chitosan at high pH (8.5), suggesting that non-electrostatic 98
absorption of chitosan on cells may be more important than electrostatic neutralization in C. 99
vulgaris. However, in all the reported cases of flocculation of C. vulgaris using chitosan as a
100
flocculant, no molecular evidences has been provided, so that the mechanism(s) underlying the 101
flocculation remains unclear. 102
In this study, we investigated the interactions between chitosan and C. vulgaris cells using an 103
advanced technique: atomic force microscopy (AFM). AFM, first developed in 198633, is a highly 104
sensitive force machine able to record forces as small as 20 pN, making it possible to gain insights 105
into the molecular interactions between single living cells and their environment. Our team recently 106
used AFM to understand the flocculation mechanism involved in the cases of three different 107
microalgae species, demonstrating the interest of using this technology to answer such questions.34–
108
36
Thanks to AFM force spectroscopy experiments, we show for the first time that at pH 6 below its 109
pKa, chitosan interacts with C. vulgaris cell wall through non-electrostatic interactions, i. e. through 110
specific interactions between chitosan and polymers at the surface of cells that are being unfolded 111
upon retraction. These observations were confirmed by comparing the data obtained with 112
cationically modified cellulose nanocrystals (CNCs), for which the flocculation mechanism, relying on 113
an electrostatic patch mechanisms, has been suggested in a previous study from our team on C. 114
vulgaris.37 Further AFM experiments, including force spectroscopy but also roughness analysis, 115
however showed that at higher pH, the mechanism at play is different, as chitosan is not able to 116
interact with cells at such high pH. Thus our AFM-based approach allows in this study to highlight the 117
complexity of chitosan-induced flocculation in the case of C. vulgaris, and enabled us to identify, at 118
pH 6, a new flocculation mechanism based on the biological binding of chitosan with the cell wall of 119
cells. Given the wide use of chitosan in microalgae harvesting processes, these new data provide 120
important information to optimize microalgae-based biofuel production. 121
RESULTS AND DISCUSSION 123
Macroscopic observations show that chitosan does not interact electrostatically with cells 124
In a previous work where we evaluated the efficiency of cationically-modified CNCs to 125
flocculate C. vulgaris cells, we showed that the number of positive charges present on the CNCs was 126
directly correlated with the flocculation efficiency.37 Indeed, CNCs bearing more positive charges 127
allowed more efficient flocculation compared to CNCs with less positive charges. This was explained 128
by the fact that positive CNCs interact with cells through electrostatic interactions, and thus the more 129
positive charges present, the more interactions can occur with cells, resulting in a higher flocculation 130
efficiency. Based on the literature, this situation should be similar for chitosan at a pH of 6, so below 131
the pKa value of the amine groups of chitosan. To test this hypothesis, we performed flocculation 132
experiments using different chitosan molecules with different degrees of deacetylation (DD), thus 133
bearing more or less positive charges. The DD of each chitosan was determined using 134
conductometric titration and established to be of 77.5 ± 0.8%, 80.5 ± 1.4% and 85.2 ± 0.2% (see 135
Figure S1 and Table S1). The dynamic viscosity of the chitosan stock solutions (5 g/L in 0.04 M HCl) 136
was measured under different shear stress (see Table S2). Chitosan in solution acts as a non-137
newtonian liquid: increasing shear stress reduces the dynamic viscosity. The results obtained for the 138
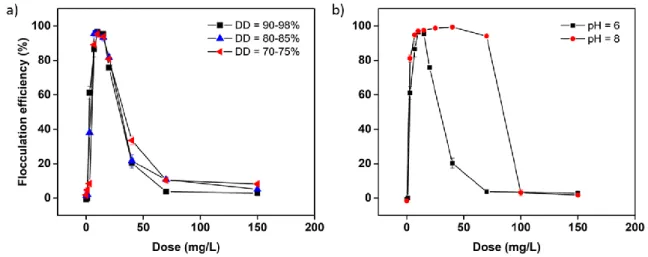
flocculation experiments are presented in figure 1a. They show that surprisingly, the flocculation 139
efficiency is similar for all chitosans tested, with a maximum efficiency reached for a dose of 10 mg/L, 140
thus showing that there is no influence of the DD of chitosan, and thus of its number of positive 141
charges on the flocculation of cells. This in line with the work of Chen et al., who also showed that 142
the DD of chitosan had indeed a limited impact on the flocculation of bentonite.38 Moreover, this 143
study also showed that the molecular weight of chitosan had a dominant influence on the 144
flocculation efficiency, with high molecular weights allowing to reach higher flocculation efficiencies. 145
In our case, the MW of the chitosan that was used is of 345.2 kDa, thus high, which explains perhaps 146
the high efficiencies reached in our flocculation experiments (˃ 95%). To verify this observation, we 147
compared the flocculation efficiencies with a pH of 8 where chitosan does not present positive 148
charges. In this case, if the flocculation efficiency of chitosan is based on electrostatic interactions, 149
then no flocculation should be observed at this higher pH environment. However, the results 150
obtained, presented in Figure 1b, show that a maximum flocculation efficiency can be reached for 151
the same chitosan dose both at pH 6 and 8. While this efficiency drops at higher doses for a pH of 6, 152
it remains maximum for doses up to 80 mg/L for a pH of 8. This result can be correlated to previous 153
data obtained in our team for the marine species Nannochloropsis occulata where it was shown that 154
chitosan was efficient even when used at higher pH conditions.31 It was showed that at higher pH, 155
the uncharged chitosan precipitates causing the flocculation of the cells through a sweeping 156
mechanism where cells are mechanically trapped in the massive structure of the precipitate39, 157
instead of charge neutralization as it is supposed to be the case at pH 6. Overall the flocculation 158
results presented here seem not to be in accordance with the literature, and comfort the idea, 159
previously raised in 2011 in the case of C. vulgaris32, that the interactions between cells and chitosan
160
may not rely on electrostatic interactions. 161
Figure 1: Flocculation experiments of C. vulgaris with chitosan. Flocculation efficiency of a) different 162
chitosan molecules with different deacetylation degree (DD) at pH 6 and b) chitosan molecules with 163
DD = 77.5 ± 0.8% at pH 6 and 8. 164
165
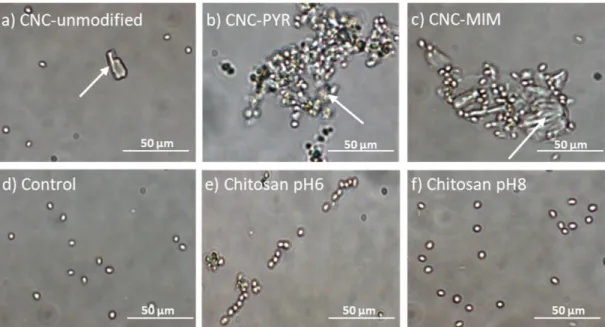
To understand this phenomena further, we performed an optical microscopy assay with cells 166
incubated with CNCs and chitosan used at concentrations for which the best flocculation efficiencies 167
were obtained (10 mg/mL for chitosan and 100 mg/L for CNCs37). For chitosan, we chose to work 168
with the chitosan with a degree of deacetylation of 77.5 ± 0.8% (4.2 mmol charges/g). Three types of 169
CNCs were used in this study: unmodified CNCs, CNCs modified with pyridinium grafts (CNC-PYR, DS = 170
0.20, 0.92 mmol charges/g) and CNCs modified with methylimidazolium grafts (CNC-MIM, DS = 0.23, 171
0.99 mmol charges/g). The used CNCs were fully characterized in a previous study by the authors.37 172
Both CNC-PYR and CNC-MIM have quaternary ammonium groups which carry a permanent positive 173
charge independent of pH, unlike chitosan, for which the charge carried by its primary amines are 174
only charged after protonation at low pH.37,40 The results are presented in Figure 2. When CNCs were 175
used, CNCs particles can directly be observed on the images (indicated by arrows): in the case of 176
unmodified CNCs (Figure 2a), no cells are attached to the particles, while for CNC-PYR and CNC-MIM, 177
cells aggregated around the particles could be observed (Figure 2b and c). This is then coherent with 178
the patch mechanism already described for C. vulgaris in our previous work where cells interact 179
electrostatically with CNC particles. Thus, in the case of unmodified CNCs that do not have positive 180
charges, no interactions with cells could be observed. However for chitosan, the situation is different: 181
at pH 6, small aggregates of cells were observed, with smaller size than the CNC aggregates (Figure 182
2e), suggesting that chitosan does interact with cells, but that perhaps the nature of the bond is 183
different, not as strong as in the case of CNCs. At pH 8, cells do not seem to be aggregated (Figure 184
2f). If we follow the hypothesis formulated in our previous work on N. occulata31, then this results 185
could be explained by the fact that at higher pH, the flocculation mechanism is based on sweeping, 186
and thus there are no direct interactions between chitosan and cells. This is also in line with what 187
was already demonstrated on another microalgae species, Dunaliella salina; when sweeping 188
mechanism is involved, there are no interactions between the flocculant and the cells.35 Thus, at this 189
stage, our macroscopic analysis seems to show that in contrast to the literature, chitosan-induced 190
flocculation in C. vulgaris may not rely on electrostatic interactions, even at pH 6 where chitosan is 191
positively charged. However, what is then the mechanism involved? 192
193 194
195 196 197 198 199 200
Figure 2. Optical imaging of C. vulgaris flocculation. Optical image of C. vulgaris cells after 201
resuspension in PBS containing a) 100 mg/L of CNC-unmodified at pH 8, b) 100 mg/L of CNC-PYR at 202
pH 8, c) 100 mg/L of CNC-MIM at pH 8, d) nothing at pH 6, e) 10 mg/L of chitosan at pH 6, and f) 10 203
mg/L of chitosan at pH 8. The arrows in a), b) and c) indicate the CNC particles. 204
205
AFM nanoscale scale experiments reveal the role of biological interactions between cells and 206
chitosan during flocculation 207
To answer this question, we used atomic force microscopy (AFM) in order to directly probe 208
the interactions between the flocculants and cells and to get a better insight into the flocculation 209
mechanisms involved in each case. We first performed force spectroscopy experiments to probe the 210
interactions between CNCs and single C. vulgaris cells. For that, a first method (method 1 described 211
in the Methods section, Figure S2a) has consisted in using tips directly modified with CNCs (Figure S3) 212
to probe the interactions with cells immobilized on a positive glass surface at a pH of 8. In the case of 213
CNCs, the charge present on the particles is not dependent on the pH because the modified CNCs 214
carry a quaternary ammonium group that is permanently positively charged. But because this first 215
method was difficult to implement for modified CNCs, as the forces recorded between the CNCs 216
particles and cells were stronger than the electrostatic forces between the cells and the surface on 217
which they were immobilized, only a small number of cells could be probed. Indeed, during force 218
spectroscopy, the cells would detach from the surface to adhere to the CNC particle on the probe, 219
therefore making the measurements impossible. To overcome this challenge, we also recorded data 220
using FluidFM technology (method 2 in the Methods section, Figure S2b). In this case, single cells 221
were aspirated at the aperture of microfluidic probes by exerting a negative pressure inside the 222
cantilever microchannel. This negative pressure was sufficient to keep the cells attached to the 223
cantilever, and thus more measurements could be performed. The data presented in Figure 3 224
combines data obtained with these two methods for modified CNCs (details of these data can be 225
found in Table S3); in the case of unmodified CNCs, only the first method was used. In this figure, the 226
adhesion forces, rupture distances and representative force curves recorded in PBS buffer are 227
presented. The adhesion force corresponds to the strongest adhesion event in each force curve, 228
while the rupture length is the distance of the last adhesion event recorded. The percentage of 229
adhesion indicated corresponds to the percentage of force curves presenting retract adhesions. In 230
each case, the results presented correspond to the interactions recorded with 10 cells coming from 231
at least 2 independent cultures. In the case of unmodified CNCs (Figure 3a and b), and in line with 232
our previous work, no interactions with cells can be observed, as retract force curves show no retract 233
peaks. In the case of CNC-PYR (Figure 3c and d), a single retract peak happening at the contact point 234
can be observed, with in this case an average force of 1.2 ± 0.7 nN (n = 9801 force curves). This force 235
signature is typical of non-specific interactions, most likely reflecting electrostatic interactions 236
between the negative surface of the cells and the positive surface of PYR-modified CNCs.34 Similar 237
force curves could be obtained for CNCs-MIM (Figure 3e and f), however, in this case the average 238
adhesion force recorded was of 3.5 ± 2.6 nN (n = 8845 force curves), so almost 3 times higher than 239
for CNCs-MIM. The adhesion force difference between CNC-MIM and PYR is significant at a p-value of 240
0.001 (unpaired t-test). This is an interesting point; indeed, CNC-MIM have a higher number of 241
positive charges compared to CNC-PYR, and our results indicate that this difference influence the 242
adhesion force recorded. Thus the more positive charges on the CNCs are present, the stronger the 243
electrostatic bond with the cell’s surface is. However, the difference in DS between both cationic 244
CNCs is small (CNCs-PYR, DS = 0.20 and CNCs-MIM, DS = 0.23), not fully explaining the big differences 245
in adhesion forces. An explanation for these differences might reside in the chemical structure of the 246
cationic grafts on the CNCs. In the CNC-PYR sample, the cationic charge is distributed over a 6-247
membered ring, while only over a 5-membered ring in the CNC-MIM sample, causing different charge 248
densities at the atomic level. Moreover methylimidazolium has two nitrogen atoms in its ring 249
structure, while pyridinium only contains one; this could also contribute to the difference recorded in 250
the adhesion forces. Regarding the rupture distance recorded, they were in average of 18.6 ± 26.1 251
nm for CNC-PYR, and of 18.6 ± 22.1 nm for CNC-MIM, indicating that no molecules were pulled away 252
from the surface of the cells. Thus, these results confirmed that the interactions between cationic 253
CNCs and cells are non-specific and electrostatic. Hence, this molecular data confirms that in the case 254
of CNCs-induced flocculation a charge neutralization mechanism is involved, and it explains why 255
better flocculation efficiencies are obtained using CNCs bearing a higher number of positive charges. 256
To further prove this point, and exclude possible contributions of other types of interactions 257
between CNCs and cells, additional experiments were carried out to measure the interactions 258
between beads bearing COOH functionalities, thus negatively charged at a pH of 8, and CNCs 259
immobilized on mica surfaces. These beads have a similar size to the cells, and thus are here used as 260
artificial non-living analogues of microalgae cells bearing only negative charges and no surface 261
polymers. The results (Figure S4) show the same tendency, i. e. single peak retract force curves and 262
lower adhesion values obtained with CNCs-PYR (5.3 ± 1.4 nN, n = 800 force curves obtained with 2 263
different beads), compared to CNCs-MIM (49.6 ± 10.6 nN, n = 800 force curves obtained with 2 264
different beads). In this case, the adhesion values are higher than the ones obtained with cells; this 265
can be explained by the fact that the beads were more negatively charged than cells. Indeed, zeta 266
potential measurements have shown that at a pH of 8, cells have a surface potential of –21.9 mV, 267
whereas the zeta potential of beads is of –43.2 mV. 268
269
Figure 3. Interactions between CNCs or chitosan and single C. vulgaris cells. a) Adhesion force 270
histogram between C. vulgaris cells and CNCs-unmodified at pH 8 and b) corresponding rupture 271
distance histogram. c) Adhesion force histogram between C. vulgaris cells and CNCs-MIM at pH 8 272
and d) corresponding rupture distance histogram. The light green distributions correspond to values 273
obtained with method 1 and the dark green distributions correspond to values obtained with method 274
2. e) Adhesion force histogram between C. vulgaris cells and CNCs-MIM at pH 8 and f) corresponding 275
rupture distance histogram. The light blue distributions correspond to values obtained with method 276
1 and the dark blue distributions correspond to values obtained with method 2. g) Adhesion force 277
histogram between C. vulgaris cells and chitosan spin-coated on a glass slide at pH 6 and h) 278
corresponding rupture distance histogram. Insets in b), d), f) and h) show representative force curves 279
obtained. Data were recorded using a set-point of 0.25 nN. 280
281
However, the interesting result from these force spectroscopy analysis concerns chitosan 282
(Figure 3g and h). In this case, the interactions between a single living C. vulgaris cell immobilized at 283
the edge of a tipless cantilever41, and a chitosan-functionalized surface by spin-coating42,43 were 284
probed at a pH of 6 (method 3 in the Methods section, Figure S2c). In this case, retraction force 285
profiles showed multiple binding events with an average adhesion force of 209.4 ± 307.9 pN (n = 286
5698 force curves), thus much lower than the forces recorded for cationic CNCs. In contrast, the 287
average rupture length for chitosan was 423.3 ± 466.2 nm, whereas in the case of cell interactions 288
with CNCs it was close to zero. Note that the large standard deviations come from the wide 289
distributions of the values visible on the histograms, caused by the heterogeneity inherent to living 290
cells. The extended ruptures, the low adhesion forces recorded, as well as the lack of defined force 291
patterns are consistent with the stretching of long molecules from the cell wall of cells.44–46 Given the 292
difference in the force signatures obtained, our results suggest that in the case of chitosan, even 293
when positively charged, no electrostatic interactions are involved in the bonding with cells, or at 294
least if electrostatic interactions are involved they are not predominant in the interactions and are 295
masked by the biological interactions. This inherently implies that chitosan is able to interact 296
specifically with polymers present at the surface of cells that are then unfolded upon retraction in 297
our force spectroscopy experiments, resulting in the long rupture distances observed. Taking into 298
account the work of Cheng and coworkers, who showed that the carbohydrate composition of the 299
cell wall of C. vulgaris has a direct influence on the efficiency of flocculation obtained with chitosan32, 300
we may suggest that chitosan is able to specifically interact with these polysaccharides. Moreover, 301
similar force patterns were already observed for microalgae by Higgins and coworkers who extended 302
mucilage (composed of polysaccharides) from the cell wall of Craspedostauros australis, a marine 303
diatom, and of Pinnularia viridis, a freshwater diatom47. This further supports that the unfolding 304
observed in our case may be due to the unfolding of polysaccharides from the C. vulgaris cell wall. 305
For the moment, such specific structural interactions between chitosan and polysaccharides, not 306
dependent on electrostatic interactions, have been described only in a few cases, for example with 307
cellulose48 or with alginate,49 for which interactions with chitosan have been observed at high or low 308
pH, where either the polysaccharides or the chitosan are uncharged. Moreover, previous studies 309
have also reported the possible interaction between chitosan and glycopolymers in the case of 310
microorganism flocculation: for example Barany et al. showed that Escherichia coli flocculation by 311
chitosan relied on chitosan absorption to polymers from the cells, rather than on electrostatic 312
factors.50 Thus, at this stage, the data obtained indicate that chitosan flocculation at pH 6 in the case 313
of C. vulgaris does not occur through electrostatic interactions, but rather through biological 314
interactions, meaning that chitosan interacts with biomolecules at the cell surface that are then 315
unfolded from the cell surface. These biomolecules might be polysaccharides present at the surface 316
of the cells. More questions can now be raised: can further data prove this? Is this mechanism also at 317
play at pH 8? 318
319
Chitosan induced-flocculation of C. vulgaris at higher pH does not occur through the same 320
mechanism 321
To further investigate the flocculation mechanism of chitosan, we decided to compare the 322
interactions between chitosan and cells at pH 6 and 8 at varying applied forces. When the applied 323
force is increased during force spectroscopy experiments, because the chitosan layers are 324
deformable (Ym of 15.6 ± 30.5 kPa at pH 6, n=1554 force curves, and of 19.2 ± 23.2 kPa at pH 8, 325
n=1349 force curves, values extracted from force curves at an indentation segment of 100 nm, data 326
not showed), the contact area between the cells and the chitosan surface increases as well. This 327
increase should lead to higher adhesion forces as more molecules from the cell wall are able to 328
interact with the chitosan surface; rupture lengths will also provide useful information on the nature 329
of the molecules unfolded. The results of these experiments are presented in Figure 4, they were 330
obtained in the case of a set point of 0.25 nN with 10 different cells, and in the case of higher set 331
points with 4 different cells coming from at least 2 independent cultures (details of the data can be 332
found in Table S3, S4 and S5). In each case, the differences between the adhesion forces recorded at 333
pH 6 and pH 8, for the different set-points, are significantly different at a p-value of 0.001 (unpaired 334
t-test). At pH 6, we can observe that the more the applied force was increased, the more the average 335
adhesion force increased, from 209.4 ± 307.9 pN at an applied force of 0.25 nN (Figure 4a, n = 5698 336
force curves), to 296.6 ± 327.1 pN at 1 nN (Figure 4c, n = 2050 force curves) and 444.9 ± 398.9 pN at 337
2 nN (Figure 4e, n = 2050 force curves), thus two times higher. As for the rupture distances, they also 338
increase with the applied force, from in average 423.6 ± 466.2 nm at 0.25 nN (Figure 4b) up to 679.7 339
± 523.3 nm at 2 nN (Figure 4f). This thus indicates that as the contact surface area increases between 340
the cell and the chitosan surface, the more molecules, probably polysaccharides, from the cell wall 341
involved in the interactions with chitosan were extended, resulting in higher adhesion forces and 342
rupture distances. When these experiments were performed at a pH of 8, a similar trend was 343
observed, with an increase in both the maximum adhesion force and rupture length when the 344
applied force is higher. However, an interesting point to note in this case is the difference in values 345
between the measurements performed at pH 6 and pH 8. Indeed, in the case of pH 8, the average 346
adhesion force recorded was 193.1 ± 182.8 pN at an applied force of 2 nN (Figure 4k, n = 2050 force 347
curves), thus almost equivalent to the adhesion force recorded at pH 6 for the smallest applied force 348
(0.25 nN). Regarding rupture lengths, although the average distances recorded were similar at a high 349
force applied, their difference is important at a low applied force (423.6 ± 466.2 nm at pH 6 and 350
320.9 ± 362.5 nm at pH 8). The differences in these values are surprising as one would expect that if 351
the interaction mechanism is indeed based on biological interactions, the same molecules would 352
unfold from the cell surface irrespective of the pH, resulting in similar unfoldings with similar rupture 353
distances. These results thus seem to indicate that it is not the case. 354
355
Figure 4. Interaction between chitosan and single C. vulgaris cells at pH 6 and 8 at varying applied forces. a) Adhesion force histogram and b) 356
corresponding rupture distance histogram betweens a C. vulgaris cell-functionalized cantilever and chitosan spin-coated on a glass slide at pH 6 using a set-357
point of 0.25 nN, c) and d) using a set-point of 1 nN, e) and f) using a set-point of 2 nN. g) Adhesion force histogram and h) rupture distance histogram 358
between a C. vulgaris cell-functionalized cantilever and chitosan spin-coated on a glass slide at pH 8 using a set-point of 0.25 nN, i) and j) using a set-point of 359
1 nN, k) and l) using a set-point of 2 nN. Insets in b), d), f), h), j) and l) show representative force curves obtained. 360
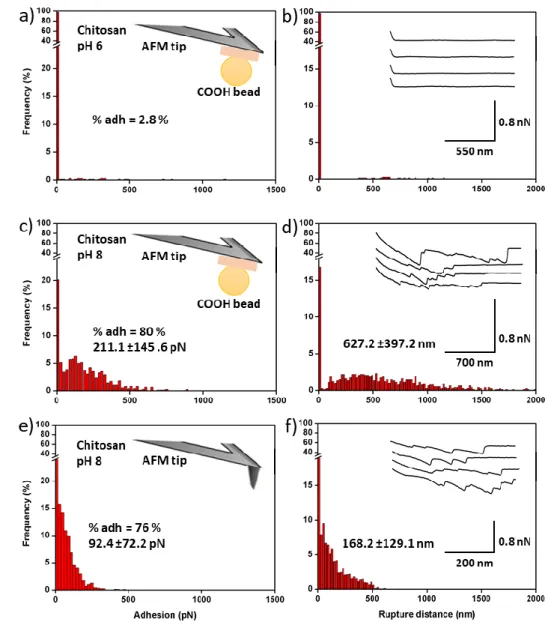
To understand this behavior, we performed experiments with negatively charged beads, and 361
probed the interactions with chitosan surfaces at pH 6 and 8. The results are presented in Figure 5. 362
At pH 6, few interactions were recorded between the beads and the chitosan surface (2.8 % of the 363
force curves), as most retract force curves present no retract peaks (Figure 5a and b). This thus 364
proves our first hypothesis that chitosan interactions with cells do not rely dominantly on 365
electrostatic interactions but on biological interactions. Indeed, COOH beads enables us to mimic the 366
cell surface by bearing negative charges, but have the advantage to exclude the molecules that are 367
present on the cell walls. In this case, it is clear that the biological polymers that are present on the 368
microalgal cell surface are essential for the interaction of chitosan with the cell, and that the charge 369
of chitosan is not dominant in the interaction with cells in our experimental conditions. Moreover, as 370
for experiments where the interactions between cells and chitosan were probed at pH 6 (Figure 4), 371
no electrostatic interactions were recorded. This further indicates that these interactions, either do 372
not take place or are smaller than the limit of detection of AFM (20 pN), and thus cannot be 373
captured. This is an interesting point because at pH 6 chitosan is positively charged, and should in 374
theory interact with negatively charged surfaces; thus perhaps these interactions are too weak to be 375
detected. The poor strength of electrostatic interactions between positively charged chitosan at low 376
pH and negative surfaces has already been described in other research fields. For example, chitosan 377
has been used to bind with negatively charged drugs in order to form drug loaded chitosan nano- and 378
microparticles.51 However it is showed in several studies that the release of the drugs from chitosan 379
particles is rapid, indicating that the binding properties of chitosan through electrostatic interactions 380 may be poor.51 381 382 383 384 385
Figure 5. Interaction between bare tips and negative beads-functionalized cantilevers with 386
chitosan surfaces. a) Adhesion force histogram between a COOHbead-functionalized cantilever and 387
chitosan spin-coated on a glass slide at pH 6 and b) corresponding rupture distance histogram. c) 388
Adhesion force histogram between a COOHbead-functionalized cantilever and chitosan spin-coated 389
on a glass slide at pH 8 and d) corresponding rupture distance histogram. e) Adhesion force 390
histogram between a bare AFM tip chitosan spin-coated on a glass slide at pH 8 and f) corresponding 391
rupture distance histogram. Insets in b) d) and f) show representative force curves obtained. Data 392
were recorded using a set-point of 0.25 nN. 393
394
When the same experiments are performed at a pH of 8 (Figure 5c and d), force curves show 395
multiple peaks that have a similar profile to the ones obtained using cells instead of beads, with 396
average adhesion forces and rupture lengths recorded values of 211.1 ± 145.6 pN and 627.2 ± 397.2 397
nm (n = 800 force curves, with 2 different beads), respectively. Using bare tips instead of beads 398
(Figure 5e and f), the same unfolding events were recorded, with similar adhesion and rupture 399
distances values as in the case of cells. This result is unexpected: indeed, the bare tips used, as for 400
the beads, carried no polymers, i.e. the multipeaks observed on the force curves must correspond to 401
the unfolding of chitosan picked up directly from the surface upon retraction by the tips or the 402
beads. This indicates that at this pH, the structure of chitosan must be different than at pH 6 where 403
bare tips do not allow the unfolding of chitosan. Moreover, this gives the explanation for the results 404
obtained using living cells at pH 8 (Figure 4g-l): in this case also, the chitosan must be unfolded from 405
the surface which explains why the adhesion forces and rupture lengths values obtained are different 406
from those obtained at pH 6. Given the fact that the same chitosan unfoldings were obtained with 407
cells, negative beads or bare tips, we can thus conclude that at pH 8 there is no biological nor 408
electrostatic interaction between the cells and chitosan, in agreement with the optical images 409
obtained (Figure 2e) where no cell aggregation could be visualized. The fact that higher adhesions 410
and rupture lengths values are recorded with beads compared to cells or bare AFM tips is explained 411
by the fact that the surface contact with beads is larger (6-7 µm of diameter compared to 3-4 µm of 412
diameter for cells), thus allowing the AFM tip to pull more chitosan from the surface. The 413
flocculation mechanism of cells at pH 8 is thus based on a different mechanism than at pH 6; our 414
hypothesis is that at this pH, the chitosan precipitates and flocculates the cells by sweeping, as we 415
have demonstrated in our previous study.31 We now need to verify this hypothesis. 416
417
Sweeping mechanism is involved in the flocculation of C. vulgaris at pH 8 418
The previous results have demonstrated that cells do not interact through biological or 419
electrostatic interactions with chitosan at pH 8. However, the question is now to understand if this is 420
due to changes in the cell wall properties of the cells, to changes in the chitosan structure, or to 421
both? It has been shown previously with the marine species Phaeodactylum tricornutum that the cell 422
wall rigidity changed with pH, which impacted on the deformability of the cells and thus on their 423
interactions with their environment.34 Moreover, AFM studies on microorganisms have shown that 424
under some conditions, the architecture and network of molecules at the surface of cells can change 425
depending on the external conditions, which thus impacts on the availability of molecules to interact 426
with their environment.45 To verify these two points in our study, we performed nanomechanical 427
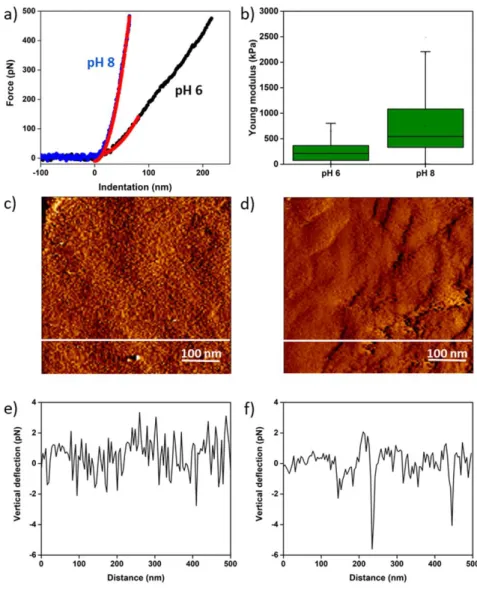
analysis of the cell wall of cells as well as surface roughness analysis. These results are presented in 428
Figure 6. To obtain quantitative information on the nanomechanical properties of the cells, we 429
determined the Young modulus (Ym) of the microalgae cells trough nanoindentation measurements, 430
in PBS at pH 6 and pH 8 (Figure 6a and b). In this type of measurements, the cantilever, for which 431
mechanical properties are known, is pressed against the cells at a given force. This enables us to 432
extract the Ym of the cell wall, a parameter that reflects its resistance to compression (the higher the 433
Young modulus value, the more rigid the cell wall). Nanoindentation measurements, which give 434
access to force vs distance curves, were performed on areas of 500 nm × 500 nm on top of cells, on 8 435
cells coming from at least 2 independent cultures. Ym values were then obtained first by converting 436
the force curves obtained into force vs indentation curves, shown in Figure 6a, and then by fitting 437
them with a theoretical model, in our case, the Hertz model52 (black empty circles on the curves in 438
Figure 6a). The results show that the indentation curves obtained on cells at pH 6 and 8 are different; 439
indeed, the AFM probe is able to indent deeper into cells at pH 6 than at pH 8, meaning that 440
increasing the pH also increases the rigidity of the cell wall. Quantitative analysis of the Ym extracted 441
from thousands of these curves on 8 cells in each case confirmed this finding, and showed that at pH 442
6, cells have an average Ym of 232.9 ± 175.6 kPa (n = 8192 force curves), whereas cells at pH 8 have a 443
Ym of 750.2 ± 589.0 kPa (n = 8182 curves, differences are significant at a p-value of 0.001, unpaired t-444
test, details can be found in table S6). While the nanomechanical properties of C. vulgaris have never 445
been determined using AFM before, these values are in the range of Ym values obtained on other 446
microorganisms such as yeasts, that have a cell wall composition comparable to microalgae.53 447
Moreover, this increase in the rigidity, due to the increase of pH, has already been shown in the case 448
of P. tricornutum.34 Hence, increasing the pH changes the nanomechanical properties of the cell wall 449
and thus its architecture, perhaps explaining in part the fact that cells are not able to interact with 450
chitosan at pH 8. Indeed, it could mean that the molecules involved in the interaction with chitosan 451
are not available anymore for interaction, or that their conformation at elevated pH prevents the 452
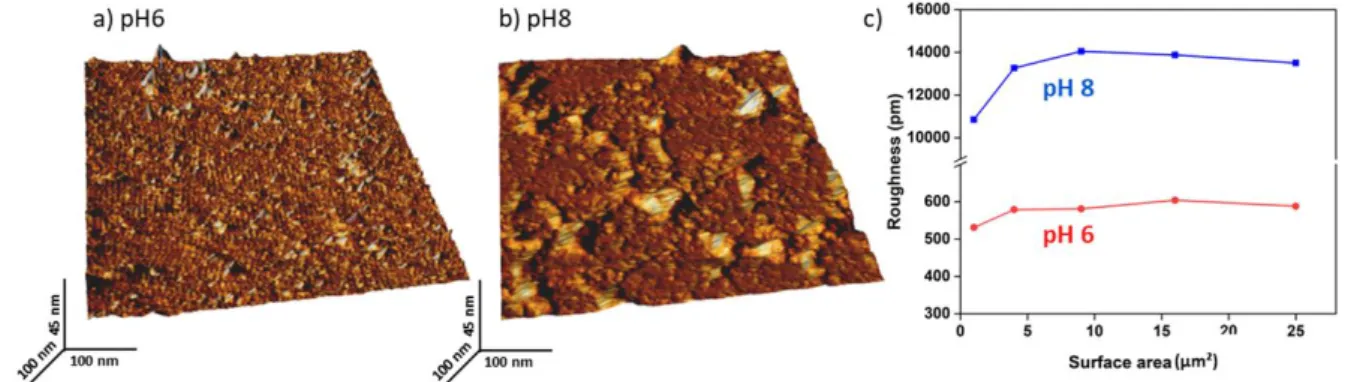
interaction with chitosan. Regarding the cell wall roughness, this parameter was directly extracted 453
from contact images of 500 nm × 500 nm obtained on top of 8 cells coming from at least 2 454
independent cultures. The results obtained (Figure 6c-f) show that the surface morphology is slightly 455
modified by the increase in pH, as shown by the vertical deflection images recorded on top of the 456
cells in Figure 6c and d. Cross-sections taken along the white lines in Figure 6c and d show this 457
difference, as the profile of this cross-section at pH 8 presents larger motives. The quantitative 458
analysis of the roughness measured on several cells showed that at pH 6, cells have an average 459
roughness of 0.9 ± 0.5 nm while it increased to 1.7 ± 0.9 nm at pH 8. While this difference is 460
significant, it remains low and indicates that at pH 8, more molecules protrude from the surface of 461
the cell, which might mask the molecules involved in the interaction with chitosan, or perhaps might 462
indicate that these molecules are coiled and not able to interact anymore.45 Overall this biophysical
463
analysis of the cell wall of C. vulgaris indicates that a pH increase from 6 to 8 clearly affects its rigidity 464
and its roughness. These changes, as discussed, may explain why cells do not interact with chitosan 465 anymore at pH 8. 466 467 468 469 470 471 472 473 474 475 476 477
478
479
Figure 6. Nanomechanics and cell wall roughness of the C. vulgaris cell wall. a) Indentation curves 480
(blue and black lines) fitted with the Hertz model at 80 nm of indentation (red lines) recorded on top 481
of C. vulgaris cells at pH 6 and 8. b) Boxplot of the Young’s modulus values measured on top of C. 482
vulgaris cells at pH 6 and 8. c) Vertical deflection AFM image of an area (500 × 500 nm) of the cell
483
surface at pH 6 and d) vertical deflection AFM image of an area (500 × 500 nm) of the cell surface at 484
pH 8. e) Cross-section taken along the white line in c) and f) cross-section taken along the white line 485
in d). 486
487
To determine if this lack of interactions is also due to the chitosan itself, we also performed 488
roughness measurement on the chitosan functionalized surfaces used in all the experiments. The 489
results, presented in Figure 7, showed an average roughness of chitosan of 0.6 ± 0.1 nm at a pH of 6, 490
which increased dramatically, to 13 ± 5 nm at a pH of 8. This result indicates that the pH has an 491
important effect on the structure of the chitosan, which, precipitates and gets detached from the 492
surface. This detachment from the surface creates aggregates of chitosan, as it can be seen on the 493
height image recorded (Figure 7b), which leads to an important roughness. This explains why 494
chitosan can be pulled out from the surface in force spectroscopy experiments, whatever the probe 495
used (cell, negatively charged bead, or bare AFM tip). This precipitation might lead to a decrease of 496
its specific surface available for interaction, which can also be a rational explanation to the fact that 497
cells do not interact with chitosan at pH 8. Thus, from these experiments, we can conclude that the 498
fact that chitosan does not interact with the cell wall of C. vulgaris at pH 8 results from the 499
combination of changes associated directly with the structure of the cell wall with changes in the 500
structure of chitosan itself caused by its precipitation. 501
Figure 7. Characterization of chitosan surfaces at two different pH. a) 3D AFM height image of 502
chitosan surface at pH 6. b) 3D AFM height image of chitosan surface at pH 8. c) Quantification of 503
chitosan surface roughness at pH 6 and 8. 504
505
CONCLUSION 506
Chitosan, given its many advantages, has been widely used as a flocculant to efficiently 507
harvest diverse species of microalgae. Since understanding the flocculation mechanisms is key to 508
control them and use them in larger-scale processes, the case of chitosan has generated a lot of 509
debate in the scientific community. Indeed, while for freshwater species that grow at pH below 6.5, 510
chitosan-induced flocculation is believed to rely on a charge neutralization mechanism, some studies 511
also show it becomes more efficient at higher pH, while in marine waters were the salts present 512
screen the charges of chitosan, chitosan can still flocculate microalgae. It is therefore of great 513
importance to provide new data, using original techniques, to finally shed light on the flocculation 514
mechanism at play. For that we have chosen the freshwater green species, C. vulgaris, and studied at 515
the nanoscale its interactions with chitosan using atomic force microscopy. Our results demonstrate 516
that depending on the pH, the interaction mechanism is different, which reveals the complexity of 517
chitosan flocculation. Indeed, preliminary macroscopic observations suggest that the charge of 518
chitosan is not involved in the interaction with cells, as different degrees of deacetylation result in 519
the same flocculation efficiency at pH 6. At increased pH, for the same degree of deacetylation, the 520
flocculation behavior is different as high doses of chitosan still allow an efficient separation, which is 521
not the case at pH 6. Based on these observations, our force spectroscopy experiments show that at 522
pH 6, chitosan interacts in a specific way with most probably polysaccharides present on the surface 523
of cells, and that the chitosan charge is not significantly involved in these interactions. This was 524
confirmed by comparing these data with those obtained for cationically modified CNCs, for which a 525
previous study has demonstrated the contribution of only of charge neutralization in the flocculation 526
mechanism.37 However, such biological interactions between chitosan and the surface of cells could 527
not be detected at pH 8. Indeed, biophysical analysis of the cell wall of C. vulgaris cells, as well as 528
roughness analysis of the chitosan used in this study suggest that at this pH, both the architecture of 529
the cell wall and the structure of chitosan are modified, resulting in an absence of interactions with 530
the cells. Based on a previous work published last year where we had found that a sweeping 531
mechanism is involved in the chitosan-induced flocculation of N. occulata at high pH, we thus suggest 532
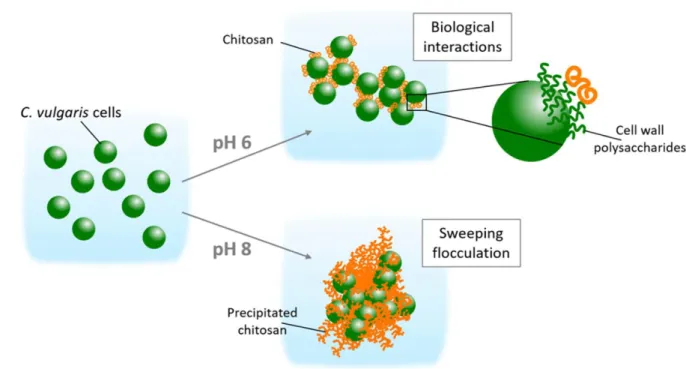
that this mechanism is also at play for the flocculation of C. vulgaris at high pH. These different 533
mechanisms of flocculation are depicted in Figure 8. This study thus represents an original 534
contribution to the field of microalgae harvesting as molecular-scale data allow in this case to 535
understand the flocculation mechanisms and to show the important influence of the culture medium 536
pH on these mechanisms. Therefore, this work brings important information that will help in 537
implementing chitosan-induced flocculation to harvest microalgae at large-scale. Further work is now 538
needed to identify the polymers from the cell surface that interact specifically with chitosan at pH 6. 539
Because a large amount of microalgae species share the same surface characteristics, in particular 540
the composition, this knowledge would make it then be possible to perform efficient chitosan 541
flocculation with a wide range of microalgae species. 542
543
544
Figure 8. Schematic representation of the flocculation mechanisms induced by chitosan at pH 6 and 545 8 for C. vulgaris. 546 547 548 METHODS 549
Microalgae cultivation. The green freshwater microalgae Chlorella vulgaris strain CCAP 211/11B 550
(Culture Collection of Algae and Protozoa) was cultivated in sterile conditions in Wright’s cryptophyte 551
(WC) medium prepared in deionized water, adjusted to a pH of 7.8.54 Cells were cultivated at 20°C, 552
under agitation (120 rpm), in 1L Erlenmeyer (300 mL of culture) flasks. The incubator was equipped 553
with white neon light tubes providing illumination of approximately 40 µmol photons m-2 s-1 with a 554
photoperiod of 18h light: 6h dark. All experiments were carried out with exponential phase batch 555
cultures (day 7). 556
Cationically-modified cellulose nanocrystals (CNCs) synthesis. N-Benzylmethylimidazolium Grafted 557
CNCs ([Br][BnIm]-g-CNCs, referred in the text as CNCs-MIM) and Benzylpyridinium Grafted CNCs 558
([Br][BnPy]-g-CNCs, referred in the text as CNCs-PYR), were synthesized and characterized in a 559
previous study and described in Blockx et al.37 For the CNCs-MIM, the sample with a degree of 560
substitution (DS) of 0.23 was used, whereas for the CNCs-PYR, the sample with a DS of 0.20 was used. 561
Chitosan. Three different types of chitosan were used in this study. Commercial chitosan was 562
purchased from Sigma Aldrich (from shrimp, practical grade, ≥75% degree of deacetilation (DD)). In 563
an earlier study it was determined that this chitosan has a Mn and Mw of 151.3 and 345.2 kDa
564
respectively, and a polydispersity of 2.2831. This chitosan was used throughout the paper for the 565
flocculation experiments and all AFM experiments. For flocculation experiments, two chitosan 566
samples with different DD (labelled as 70-75% and 80-85%) were prepared from shrimp shells and 567
kindly provided by Nha trang University, Vietnam. Chitosan stock solutions were produced by 568
dissolving 5 g/L of the three types of chitosan in 0.04 M of HCl, while stirring (1000 rpm) at ambient 569
conditions for 2 hours. A more exact degree of deacetylation was determined for the three chitosan 570
samples via conductometric titrations (Metrohm 856 Conductivity Module and 801 Stirrer with 571
TiamoTM software). For that, 2 mL stock solution was diluted 50 fold in MiliQ water and titrated with 572
5.75 mM NaOH under constant stirring. The results are shown in supplementary Figure S1 and Table 573
S1. The DD was determined from the volume of NaOH required to neutralize the chitosan (plateau 574
area of the curves), where each chitosan sample was measured three times. The DD of the 575
commercial Sigma Aldrich chitosan is of 77.5 ± 0.8%, and for the chitosan samples provided by the 576
Nha trang University of 80.5 ± 1.4% and 85.2 ± 0.2%. The dynamic viscosity of the three chitosan 577
samples was measured on a AR-G2 rheometer (TA Instruments) equipped with a steel double wall 578
couette cell. The experiment consisted of four steps. Step 1: 60 s at a shear rate of 100.0 /s to allow 579
the sample to set in the sample holder; Step 2: 180 s at a shear rate of 1.0 /s; Step 3: 180 s at a shear 580
rate of 10.0 /s; and Step 3: 180 s at a shear rate of 100.0 /s. All experiments were carried out at 25 °C 581
and 1 datapoint was collected per second. All samples were measured in triplicate. Data analysis was 582
performed with TA Instrument Trios Version 3.3.1.4364. The results are showed in Supplementary 583
Table S2. 584
Flocculation experiments. Flocculation of C. vulgaris was performed using standardized jar tests 585
experiments. The microalgae suspension was adjusted to a pH of 6 and the initial optical density (ODi,
586
750 nm) was set at 0.7 (corresponding to 0.28 g/L). 50 mL tests samples were taken and intensively
587
stirred at 550 rpm to mix the suspension. Different concentrations of chitosan were then added (0, 1, 588
3, 7, 10, 15, 20, 40, 70, 150 mg/L) from the 5 g/L stock solutions and the suspensions were stirred at 589
200 rpm for 20 min to induce flocculation. The suspensions were subsequently decanted in falcon 590
tubes and allowed to settle for 30 min before measuring the optical density after settling (ODf) of the
591
supernatant (at approximately 3 cm below the surface). The flocculation efficiency (ηa) was
592
calculated according to the following equation 1. For experiments at pH 8, the microalgae suspension 593
was adjusted to a pH of 8 priori to flocculation experiments and the chitosan concentrations used 594 were of 0, 3, 7, 10, 15, 25, 40, 70, 100, 150 mg/L. 595 (1) 596
Optical imaging experiments. Flocculation was directly observed after resuspension of the cells in 597
Phosphate Buffer Saline (PBS) at a pH of 6 or 8 containing chitosan at a concentration of 10 mg/L or 598
CNCs-PYR or CNCs-MIM, both at a concentration of 100 mg/L. Flocculation levels were observed 599
using an Axio Observer Z1 microscope (Zeiss, Germany) at a magnification of 50x. 600
Zeta potential experiments. The global electrical properties of C. vulgaris cell surface as well as of 601
negative beads (COOH functionalized polystyrene beads diameter of 6.83 µm, Spherotech, USA) were 602
assessed by measuring the electrophoretic mobility with an automated laser zetameter (Zetasizer 603
NanoZS, Malvern Instruments). To this end, microalgae were harvested by centrifugation (3000 rpm, 604
3 min), washed two times in PBS at a pH of 6 or 8, and resuspended in the same solution at a final 605
concentration of 1.5 × 10⁶ cell/mL. In the case of beads, they were first centrifuged (3 min, 13000 606
rpm) and washed two time in deionized water. For each condition, analysis was performed in 607
triplicate. 608
AFM cantilever functionalization. All AFM cantilever functionalizations were performed using a 609
Nanowizard III AFM (Bruker, USA), with triangular tipless NP-O10 probes (Bruker, USA, nominal 610
spring constant of 0.06 N/m and of 0.2 N/m). 611
Functionalization with CNCs: Colloidal probes were functionalized with cationic CNC particles. 612
Colloidal probes were obtained by attaching a single silica microsphere (5 μm of diameter, Bangs 613
Laboratories) with a thin layer of UV-curable glue (NOA 63, Norland Edmund Optics). These colloidal 614
probes were then put under UV-light for 10 min to allow the glue to cure. They were further dipped 615
into a thin layer of UV-curable glue, then into a thin layer CNCs particles deposited on a glass slide. 616
Functionalized cantilevers were then put under UV-light for 10 min to allow the glue to cure and 617
further characterized using scanning electron microscopy (Figure S3). The spring constant of the 618
colloidal probe was determined after attachment of the CNC particles using the thermal noise 619
method.55
620
Functionalization with single C. vulgaris cells: AFM cantilevers were also functionalized with single C. 621
vulgaris cells grown during 7 days in the conditions described previously. For that, cantilevers were
622
first activated using oxygen plasma (3 min, 0.5 mbar) and then incubated in a 0.2% polyethylenimine 623
solution (PEI, Sigma-Aldrich) overnight. The AFM cantilevers were then rinsed in PBS at a pH of 6 or 8, 624
brought into contact with an isolated cell and retracted to attach it. Proper attachment of the cell on 625
the colloidal probe was checked using optical microscopy. The spring constant of the AFM cantilever 626
was determined prior to cell immobilization using the thermal noise method.55 627
Functionalization with negatively charged beads: AFM cantilevers were functionalized using COOH 628
polystyrene beads (negatively charged at pH 6 and 8, diameter of 6.83 µm, Spherotech, USA). Beads 629
were first centrifuged (3 min, 13000 rpm) and washed two time in deionized water. A drop from this 630
solution was then deposited on a glass slide and allowed to dry at 37°C during 2 hours. Cantilevers 631
were first dipped into a thin layer of UV-curable glue (NOA 63, Norland Edmund Optics), and then 632
brought into contact a single isolated bead on the glass slide and retracted to attach it. 633
Functionalized cantilevers were then put under UV-light for 10 min to allow the glue to cure; proper 634
attachment of the COOH bead on the colloidal probe was checked using optical microscopy. The 635
spring constant of the COOH probe was determined after attachment of the COOH bead using the 636
thermal noise method.55 637
Force spectroscopy experiments. Force spectroscopy experiments were conducted either by 638
functionalizing the cantilever with CNCs and probing the interactions with immobilized cells on a 639
surface (method 1), using FluidFM technology to aspirate a single C. vulgaris cell at the aperture of a 640
microfluidic AFM probe to probe interactions with cationic CNCs functionalized on a surface (method 641
2), or by functionalizing the AFM cantilever with a single C. vulgaris cells and probing the interactions 642
with chitosan immobilized on a surface (method 3). In each case, experiments were performed in PBS 643
at a pH of 6 or 8, using a NanoWizard III AFM (Bruker, USA). These 3 methods are also depicted in 644
Figure S2. 645
Method 1: This method was used to probe the interactions between CNCs or negatively charged 646
beads, and single C. vulgaris cells. In this case, CNCs (unmodified, PYR and MIM) or negatively 647
charged beads functionalized cantilevers were directly used to probe the interactions with C. vulgaris 648
cells immobilized on polyethylenimine (PEI Sigma P3143) coated glass slides prepared as previously 649
described56. For that, cells were first harvested by centrifugation (3000 rpm, 3 min) and washed two 650
times in PBS at pH 6 or 8. Freshly oxygen activated glass slides were covered by a 0.2% PEI solution in 651
deionized water and left for incubation overnight. Then the glass slides were rinsed with deionized 652
water and dried under nitrogen. A total of 1 mL of the cell suspension was then deposited on the PEI 653
slides, allowed to stand for 30 min at room temperature, and rinsed with PBS at pH 6 or 8. 654
Method 2: This method was also used to probe the interactions between CNCs and single C. vulgaris 655
cells. As the forces recorded between CNCs and cells were stronger that the electrostatic forces 656
between PEI coated glass-slides and cells, this method was alternatively used to complete the data 657
sets. In this case, FluidFM technology was used (Cytosurge AG, Switzerland): this system connects the 658
AFM to a pressure pump unit and a pressure controller through a microfluidic tubing system. 659
Micropipette probes with an aperture of 4 µm (spring constant of 0.3 N/m) were used (Cytosurge AG, 660
Switzerland). First, PBS at a pH 8 was filled in the probe reservoir and was pressed through the 661
cantilever by applying an overpressure (100 mBar). The probe was then immersed in PBS and 662
calibrated using the thermal noise method prior to measurement. A single C. vulgaris cell was then 663
picked up from the surface of the Petri dish by approaching the FluidFM probe and applying a 664
negative pressure (−80 mBar). The transfer of the cell on the probe was verified by optical 665
microscopy. The cell probe was then used to probe the interactions with CNCs-functionalized mica 666
surfaces. For that, CNCs solutions at a concentration of 5 g/L were first sonicated for at least for 5 667
min, then deposited on mica surfaces and left for incubation overnight. After that the mica surfaces 668
were rinsed using PBS at pH 8 and taped at the bottom of the Petri dish used for the AFM 669
experiment. 670
Method 3: This method was used to probe the interactions between chitosan and single C. vulgaris 671
cells. In this case, AFM cantilevers functionalized with a single C. vulgaris cells were used to probe the 672
interactions with chitosan-functionalized surfaces, in PBS pH 6 or 8. Chitosan was functionalized at 673
the surface of glass-slide using spin-coating method, according to procedures described in 42,43. 674
Briefly, 50 mg of chitosan was first dissolved in 10 mL of deionized water containing 30-50 µL of 675
hydrochloric acid (HCl). This solution was then deposited on a clean glass slide and spin-coated at 676
1000 rpm for 3 min. The glass slides were then dried in an incubator at 50°C overnight, before use. 677
Roughness analyses. Roughness analyses were performed on cells immobilized on PEI-coated glass 678
slides and on chitosan-functionalized glass slides. In both cases, images were recorded in PBS at pH 6 679
or 8 using contact mode on a Nanowizard III AFM (Bruker, USA), with MSCT cantilevers (Bruker, 680
nominal spring constant of 0.01 N/m). Images were recorded using an applied force of < 0.5 nN. The 681
cantilevers spring constants were determined by the thermal noise method.55 682
Nanomechanical analysis. For nanoindentation experiments, the applied force was comprised 683
between 0.5 and 2 nN depending on the condition with MSCT cantilevers (Bruker, nominal spring 684
constant of 0.01 N/m). Young's moduli were then calculated from 80 nm indentation curves using the 685
Hertz model52 in which the force F, indentation (δ) and Young's modulus (Ym) follow equation 2, 686
where α is the tip opening angle (17.5°), and υ the Poisson ratio (arbitrarily assumed to be 0.5). The 687
cantilevers spring constants were determined by the thermal noise method.55 688
(2) 689
Scanning electron microscopy imaging of AFM cantilevers. AFM cantilevers functionalized or not 690
with CNCs or chitosan were first carbonated and then imaged using a Jeol 6400 electron microscope 691
(Jeol, Tokyo, Japan) equipped with an EDS Bruker SDD detector, at an acceleration voltage of 20kV. 692
693
ACKNOWLEDGEMENTS 694
C. F.-D. is a researcher at CNRS. C. F.-D. acknowledges financial support for this work from the 695
Agence Nationale de la Recherche, JCJC project FLOTALG (ANR-18-CE43-0001-01). J. B., W. T. and K. 696
M. acknowledge financial support for this work from Research Foundation Flanders (grant 697
G.0608.16N) and from the EU Interreg France-Wallonie-Vlaanderen program through the ALPO
698
project. W. T. further acknowledges the Provincie West-Vlaanderen for his Chair in Advance 699
Materials, Research Foundation Flanders for his Odysseus fellowship (grant G.0C60.13N), and the 700
European Union's European Fund for Regional Development, Flanders Innovation & 701
Entrepreneurship and the Province of West-Flanders for financial support in the Accelerate3 project 702
(Interreg Vlaanderen-Nederland program). The authors would like to thank Prof. Dries Vandamme 703
for his contribution in the flocculation experiments. 704
705
SUPPORTING INFORMATION 706
Supplementary Table S1. Conductometric titration results 707
Supplementary Table S2. Dynamic viscosity at different shear rates (1.0 1/s 10.0 1/s and 100.0 708
1/s). 709
Supplementary Table S3. Adhesion force values recorded between single C. vulgaris cells and 710
CNCs/chitosan coated surfaces. 711