L'expression des gènes cibles dans le modelage osseux
vertébral de la truite arc-en-ciel d’élevage:
effets de différents apports en phosphore
Thèse
Jérémy Le Luyer
Doctorat en sciences animales
Philosophiae doctor (Ph.D.)
Québec, Canada
Résumé
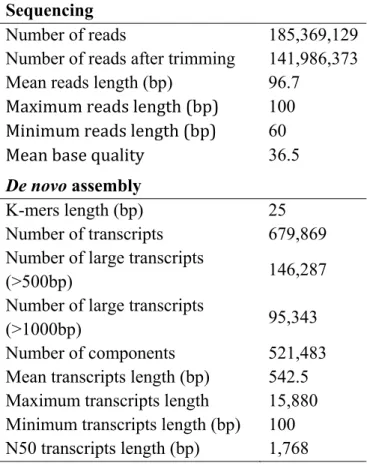
Les rejets phosphorés issus des productions aquacoles sont connus pour être, en partie, responsables de l’eutrophisation des eaux douces. En raison du manque de précision des outils actuellement disponibles pour l’estimation des besoins en phosphore (P) chez la truite arc-en-ciel (Oncorhynchus mykiss), il est encore distribué en excès dans la majorité des élevages. Par ailleurs, si l’on sait que le P joue un rôle prépondérant dans la formation du tissu osseux, des questions subsistent quant à son rôle sur l’apparition d’anomalies vertébrales. Pour suivre les réponses à court et à long terme d’une déficience en P sur l’organisme, des truites arc-en-ciel triploïdes ont été soumises à deux régimes alimentaires (riche ou carencé en P). Nos résultats indiquent, dans un premier temps, que dès la semaine 2, les poissons nourris avec une diète déficiente montrent des statuts en P, dans les écailles et les carcasses, inférieurs à ceux des poissons nourris avec une diète suffisante en P. À l’inverse, la minéralisation des vertèbres semble être préservée jusqu’à la semaine 4. Pourtant, à la semaine 5, les radiographies révèlent qu’environ 50% des individus déficients présentent des malformations vertébrales. Pour comprendre l’impact de cette déficience au niveau moléculaire, un séquençage haut-débit (RNA-seq Illumina) nous a permis de construire le premier transcriptome spécifique des vertèbres de truite arc-en-ciel. L’analyse fonctionnelle de ce transcriptome révèle une impressionnante conservation des gènes clefs impliqués dans la régulation du tissu osseux chez les vertébrés. Ainsi, à l’aide de cette référence, il a été possible de quantifier l’expression des gènes dans les vertèbres d’individus déficients déformés ou normaux, après 27 semaines d’expérience. Ces résultats, combinés à des observations histologiques et le suivi des indicateurs du statut en P, indiquent qu’une déficience a pour conséquence une diminution du degré de minéralisation de la vertèbre (sans affecter la matrice ou sa résorbtion ostéoclastique), possiblement dû à l’activité de protéines Gla impliquées dans le dépôt et la croissance des cristaux d’hydroxyapatite. Les connaissances recueillies seront primordiales pour la sélection de lignées de moindre impact pour l’environnement, ainsi que pour la formulation de diètes adaptées aux besoins nutritionnels réels des truites arc-en-ciel d’élevage.
Abstract
Dietary phosphorus (P) outputs from fish production can contribute to freshwater eutrophication. Due to the inaccuracy of the common tools used for estimating P requirement for rainbow trout (Oncorhynchus mykiss), P is still provided in excess in fish diets. Furthermore, we know that P plays a crucial role in regulating normal bone turnover; yet, questions have arisen regarding its role in the prevalence of vertebral deformities. To monitor both the short and long term response of the organism to a P-deficiency, rainbow trout were fed either a P-sufficient or a P-deficient diet over a 27 weeks period. Our results show that deficient fish displayed lower mineral status in scales and carcasses than P-sufficient fish as early as the second week of the experiment. Although during the first four weeks of feeding P-deficient diet, the mineralization status of the fish vertebrae was not significantly impaired,, at week 5, x-rays revealed that around 50% of P-deficient fish displayed abnormal vertebrae phenotypes. To understand the molecular mechanisms behind the appearance of vertebral malformations, we built the first transcriptome specific to bone tissue of rainbow trout. Sequencing was based on Illumina HiSeq-2000 technology. Functional analysis of this transcriptome revealed a remarkable conservation of key genes involved in bone regulation in vertebrates. Based on this reference, we could compare the gene expression in the vertebrae between deformed and normal fish at week 27. These results, combined with histological observations and common indicators of P status, suggest that P-deficiency in trout led to a reduced degree of mineralization of the vertebrae (without affecting matrix of resorption activity). The reduced degree of mineralization is possibly linked to higher expression of genes coding for Gla proteins, involved in the regulation of hydroxyapatite crystal fixation and growth. From an aquaculture perspective, these results might serve as a solid baseline for better management of P in production, opening to the possibility to strain selection as well as providing new tools for dietary-P level optimization for rainbow trout production.
Table des matières
Résumé ... III Abstract ... V Table des matières ... VII Liste des tableaux ... XI Liste des figures ... XIII Liste des abbréviations et sigles ... XV Remerciements ... XXI Avant‐propos ... XXIII 1 Chapter 1: Literature review ... 1 1.1 Fish production ... 1 1.1.1 Aquaculture in Canada ... 1 1.1.2 General problematic and management strategies for aquaculture farming ... 2 1.1.3 Phosphorus uses and problematic in aquaculture ... 2 1.2 Phosphorus ... 4 1.2.1 Phosphorus requirement... 4 1.2.2 Mineral homeostasis ... 5 1.3 Bone tissue ... 7 1.3.1 Bone components and vertebrae ... 7 1.3.2 Bone deformities with emphasis on P‐induced vertebral deformities ... 10 1.4 Cellular activity in bone formation and remodelling ... 17 1.4.1 Osteoblasts and osteocytes ... 17 1.4.2 Osteoclasts and bone resorption ... 19 1.4.3 Osteoclast‐osteoblast communication ... 21 1.4.4 Chondrocytes, cartilage matrix and endochondral bone formation ... 21 1.5 Hormonal regulation ... 231.5.2 Vitamins D3 and K ... 24 1.5.3 Stanniocalcin ... 25 1.5.4 Calcitonin ... 26 1.6 Transcriptional regulation of bone ... 26 1.6.1 Osteoblasts and osteocytes regulation ... 27 1.6.2 Osteoclasts and bone resorption ... 31 1.6.3 Chondrocytes and cartilage matrix ... 34 1.6.4 Extracellular matrix components ... 35 1.7 Rainbow trout for genomic studies ... 37 1.8 Hypothesis and objectives ... 39 1.9 References ... 41 2 Chapter 2: Responses of different body compartments to acute dietary phosphorus deficiency in juvenile triploid rainbow trout (Oncorhynchus mykiss, Walbaum) ... 71 2.1 Résumé ... 72 2.2 Abstract ... 74 2.3 Introduction ... 76 2.4 Materials and methods ... 77 2.4.1 Husbandry ... 77 2.4.2 Vertebral deformities ... 80 2.4.3 Growth performance and tissue sampling ... 80 2.4.4 Mineralization status ... 81 2.4.5 Statistical analysis ... 81 2.5 Results ... 82 2.6 Discussion ... 89 2.7 Conclusion ... 92 2.8 Acknowledgements ... 93 2.9 References ... 93
3 Chapter 3: Establishment of a comprehensive reference transcriptome for vertebral bone tissue to study the impacts of nutritional phosphorus deficiency in rainbow trout (Oncorhynchus mykiss, Walbaum) ... 101 3.1 Résumé ... 102 3.2 Abstract ... 103 3.3 Introduction ... 104 3.4 Data description ... 104 3.4.1 Husbandry ... 104 3.4.2 Sampling and tissue collection ... 105 3.4.3 RNA extraction and cDNA library preparation ... 105 3.4.4 Bioinformatics and transcriptome assembly ... 105 3.4.5 Functional annotation ... 106 3.5 Results and discussion ... 106 3.6 Acknowledgments ... 113 3.7 References ... 114
4 Chapter 4: RNA‐seq transcriptome analysis of pronounced biconcave vertebrae: a common abnormality in rainbow trout (Oncorhynchus mykiss, Walbaum) fed a low‐ phosphorus diet. ... 117 4.1 Résumé ... 118 4.2 Abstract ... 119 4.3 Introduction ... 120 4.4 Material and methods... 120 4.4.1 Husbandry ... 122 4.4.2 Deformities assessment and tissue sampling ... 122 4.4.3 Inorganic phosphorus in plasma ... 123 4.4.4 Bone histology ... 124 4.4.5 Bone profiling ... 124 4.4.6 Biomechanics ... 126 4.4.7 Mineralization status ... 126
4.4.8 Sequencing ... 126 4.4.9 Differentially expression study and annotation ... 127 4.4.10 RT‐qPCR ... 129 4.4.11 Statistical analysis ... 129 4.5 Results and discussion ... 129 4.6 Conclusion ... 145 4.7 Acknowledgements ... 145 4.8 References ... 146 5 General discussion and conclusion ... 159 5.1 Body responsiveness ... 160 5.2 Reference transcriptome ... 160 5.3 Quantitative study ... 162 5.4 Perspectives ... 164 5.5 References ... 168 Annexes ... 171
Liste des tableaux
Table 2.1: Ingredients and proximate composition of the P sufficient and P deficient diets ... 79 Table 2.2: Weight, length, condition factor (K), feed intake, deformities and mortality in
fish fed P-sufficient and P-deficient diets. ... 82 Table 2.3: Relative impact on ash and P content in scales, vertebrae and carcass for fish fed P-sufficient and P-deficient diets. ... 84 Table 2.4: Coefficient of variation (CV) of ash and P content in carcasses, scales and
vertebrae of fish fed deficient or sufficient P diets. ... 87 Table 3.1: Summary of RNA-seq sequencing and assembly results ... 108 Table 4.1: Primer sequences, product sizes and annealing temperature of selected genes for RT-qPCR ... 129 Table 4.2: Growth, condition factors, stiffness, P mineralization status (dry tissues)
calculated as ash or P content and results of histological observations by Sirius red and Von Kossa. ... 133 Table 4.3: Sequencing results of biconcave (Deformed, Def.) and normal (Norm.) vertebra..
... 134 Table 4.4: Selection of differentially expressed genes putatively related to bone
Liste des figures
Figure 1.1: Longitudinal section of normal vertebrae of rainbow trout, visualised by
Masson’s trichrome staining. ... 10
Figure 1.2: Illustrations and X-rays of the most reported vertebrae phenotypes associated with mineral deficiency in teleost. ... 13
Figure 1.3: Schematic representation of osteoblastogenesis leading to bone matrix production. ... 19
Figure 1.4: Schematic representation of osteoclastogenesis leading to bone resorption. ... 21
Figure 1.5: Schematic representation of chondrogenesis.. ... 23
Figure 1.6: Schema of the simplified BMP/TGFβ pathway.. ... 29
Figure 1.7: Schema of the Wnt/β-catenin canonical pathway. ... 30
Figure 1.8: RANKL/RANK signalling in osteoclasts.. ... 32
Figure 3.1: Functional annotation of the transcripts. ... 112
Figure 3.2: Schematic representation of the main actors involved in the regulation of bone and cartilage tissues. ... 112
Figure 4.1: Illustrations (left) and X-rays (right) of the reported vertebral phenotypes in this study (normal and pronounced biconcave, respectively) and associated with mineral deficiency in teleost. ... 122 Figure 4.2: Scheme of a longitudinal section of the mid-region of two adjacent vertebrae
Figure 4.3: Pipeline of bioinformatics and gene expression analyses. ... 128 Figure 4.4: RT-PCR results on selected bone related genes. ... 136 Figure 4.5: Vertebral bone profile for normal and deformed groups.. ... 138
Liste des abbréviations et sigles
ALP Alkaline phosphatase
APC Adenomatous polyposis coli
ATP Adenosine triphosphate
BGLAP Osteocalcin
BMC Bone mineral content
BMP Bone morphogenetic protein
BMPR Bone morphogenetic protein receptor
BMU Basic multicellular unit
Ca Calcium
CEBPB CCAAT/Enhancer binding protein (C/EBP) Β
CGrP Calcitonin gene-related peptide
c-Myc Proto-oncogène c-Myc
COL Collage type XI alpha 1
COL11a1 Collagen type XI alpha 1 COL12a1 Collagen type X2 alpha 1
COMP Cartilage oligomeric matrix protein
CREBBP CREB binding protein
CT Calcitonin CTR Calcitonin receptor CTSK Cathepsin K CV Coefficient of variation d° Day-degree DAPI 4',6'-diamidino-2-phénylindole DCHS1 Dachsous Cadherin-Related 1 DKK Dickkopf-related proteins DLX5 Distal-less homeobox 5 DM Dry matter
DNA Deoxyribonucleic acid
ECM Extracellular matrix
ERK Extracellular signal-regulated kinase
ESTs Expressed sequence tags
FAT4 FAT atypical cadherin 4
FBN2 Fibrillin
FC Fold change
FGF Fibroblast growth factor
FGFR4 Fibroblast growth factor receptor 4
FLNA Filamin A, alpha
FST Follistatin
FTIM Fourier transform infrared microspectroscopic
FZDs Frizzled receptor
GCG2 Glucagon-2
GPC1 Glypican 1
GSK3β Glycogen synthase kinase 3
HA Hydroxyapatite
HAPLN1 Hyaluronan and proteoglycan linked protein 1
HIVEP3 Human immunodeficient virus type 1 enhancer binding protein 3
HSCs Hematopoietic stem cells
HSPG2 Heparan sulfate proteoglycan 2
IHH Indian hedgehog
IKKs Protein kinases
IL-1 Interleukin-1 JNK c-Jun N-terminal kinase
JUNB Jun B proto-oncogene
JUND Jun D proto-oncogene
K Condition factor
LEF1 Lymphoid enhancer-binding factor 1
LRPs Lipoprotein receptor-related proteins receptor
M3K1 Mitogen-activated protein kinase kinase kinase 1
MCP-1 Monocyte chemoattractant protein-1
MEF2C Myocyte-specific enhancer factor 2C
MEK1 Mitogen-activated protein kinase kinase 1
MEKK1 Mitogen-activated protein kinase kinase kinase 1
MGP Matrix Gla protein
MKKs Matrix-activated protein kinases
MLK3 Mitogen-activated protein kinase kinase kinase 11
MMPs Matrix metalloproteases
MSCs Mesenchymal stem cells
MtPi Mitochondrial Pi Carrier
MYCB2 Myc binding protein 2
MYCPP C-myc promoter-binding protein
MYO10 Unconventional myosin-X
NaPi-II Sodium-phosphate co-transporter
NF1 Neurofibromin 1
NFIX Nuclear factor 1/X (CCAAT-binding transcription factor)
NGS Next-Generation Sequencing
NIK Mitogen-activated protein kinase kinase kinase kinase 4
NKFkB Nuclear factor-kappa B NKX3.2 Homeobox protein Nkx3.2 NOG Nogging OPG Osteoprotegerin OPN Osteopontin OSX Osterix P Phosphorus
p38 P38 mitogen-activated protein kinase
PHEX Phosphate-regulating neutral endopeptidase, X-linked Pi Phosphate
PPi Pyrophosphate
PTHR Parathyroid hormone receptors PTHrP Parathyroid hormone-related protein RANK Receptor activator of nuclear factor κ B
RANKL Receptor activator of nuclear factor kappa-B ligand
RNA Ribonucleic acid
RT-qPCR Reverse transcription polymerase chain reaction RUNX2 Runt-related transcription factor 2
SFrP Secreted frizzled-related proteins
SHH Sonic hedgehog
SOS1 Son of sevenless homolog 1
SOST Sclerostin
SOX9 Sex determining region Y-Box 9
SPARC Osteonectin
SPP1 Osteopontin
SRCAP Snf2-related CREBBP activator protein
STC Stanniocalcin
TAK1 Mitogen-activated protein kinase kinase kinase 7 TCF T-cell-Specific transcription factor
TGFR Transforming growth factor beta receptor
TGFβ Transforming growth factor beta
TMEFF1 Tomoregulin-1
TNR5 CD40 molecule TNF receptor family member 5
TRAF6 TNF receptor-associated factor 6, E3 ubiquitin protein ligase TRAP Tartrate-resistant acid phosphatase
TWIST2 Twist family BHLH transcription factor 2
USP9X Probable ubiquitin carboxyl-terminal hydrolase FAF-X
VDR Vitamin D receptor
VEGF Vascular endothelial growth factor
VGFR1 Vascular endothelial growth factor receptor 1
WGD Whole genome duplication
Remerciements
Je tiens en premier lieu à remercier les membres du jury qui ont eu la gentillesse d’examiner cette thèse. Merci tout d’abord à Madame Chantal Cahu pour avoir suivi l’avancée du projet du début à la fin avec toujours la même disponibilité et la même sympathie. Je tiens également à remercier Madame Kristen
Gorman pour avoir accepté, dans un délai très court, de participer à la correction de ce travail.
Parce que cette thèse n’aurait jamais été possible sans l’appui et le travail de toute une équipe, je tiens dans un premier temps à exprimer amicalement mes remerciements à Monsieur Grant Vandenberg pour avoir surpervisé cette thèse. Merci Grant pour ton soutien dans chacune des étapes du projet, pour ta confiance et ton humanité. Je tiens également à exprimer mes remerciements à Monsieur Claude Robert pour sa disponibilité. Claude, ton aide, tes conseils et ta confiance auront fait de ces années une expérience plus qu’enrichissante. Je vourais également remercier Monsieur Arnaud Droit pour sa précieuse collaboration. Merci Arnaud d’avoir accepté de m’encadrer en cours de projet, de t’être paré de patience et surtout d’avoir pris le temps d’initier au monde de la bioinformatique un biologiste. Finalement, Merci à Monsieur Jean-Yves Sire pour ses conversations riches en enseignement et sa participation active à la révision du manuscript.
Je tiens également à remercier très chaleureusement le laboratoire dans son entier. Tout d’abord Madame Marie-Hélène Deschamps pour le rôle clef qu’elle a joué dans ce projet. Marie-Hélène, tu auras été l’investigatrice et le moteur de ce beau projet. Un énorme merci pour tout le support et l’aide apportée tout au long de cette thèse. Ensuite, j’aimerais remercier Madame Émilie Proulx pour avoir parfaitement su jongler entre encadrement, logistique et support technique. Merci Émilie d’avoir fait en sorte que tout soit plus simple. Je tiens à exprimer également mes plus sincères remerciements à tous les étudiants présents et passés du laboratoire avec qui j’ai partagé de nombreux moments. Merci à Noémie Poirier-Stewart, Alexandre Pilote, Benjamin Bourdon, Benjamin Laramée, Albert Ntumba Tshinyama, Rodrigue Yossa ainsi qu’à l’ensemble des stagiaires qui nous auront grandement aidé aussi bien au Larsa qu’au laboratoire et parmi eux Audrey Piché, Marie-Ève Marin et David Grimard. Je tiens également à remercier toute l’équipe du Larsa Serge Higgins, Jean-Christophe Therrien, Jade Larivière, Isabelle Langlois-Parisé pour le travail exceptionnel dans le maintien des systèmes d’élevage, leur enthousiasme et leur disponibilité. Merci JC pour ta bonne énergie et ton enthousiasme ! Merci également à toute l’équipe de technicien et de professionnels de recherche au département, à commencer par Dominic Gagné, Isabelle Dufort, Isabelle Laflamme et Nancy Bolduc qui font tourner d’une si belle manière l’ensemble des laboratoires de recherche. Une merci tout particulier à Charles Joly-Beauparlant, Éric Normandeau et Éric Fournier pour leur aide précieuse dans l’analyse bioinformatique.
Je tiens également à remercier le Dr. François richard et Robert Chartrand pour m’avoir offert la possibilité de participer aux charges de labo.
Bien entendu, ces années auront été marquées par de belles rencontres. Je voudrai remercier toutes ces personnes qui, chacun à leur manière, auront donné de la couleur à ce travail et à ma vie au Québec. Je tiens particulièrement à remercier les amis: Léo, Stef, Seb, Oli, Ben, Aline, Jeanne, Max, Nico, Nadia, Annie, Farouk, Vianney, Hubert, Elsa, Dominic, Isabelle, JP, Anne, Alejandro, Simon, Bernard, Félix, Myriam, Emmanuelle, Marco, Andrée-Anne, Anne-So, Gwen, Vincent, Marick, Hélène, Laura, Charles, Juan, ‘tata’, Leo, Florence, Angus, Éric. Merci pour toutes les balades, les bons moments, les partys, les fous rires et surtout merci pour votre amitié. Je voudrais également avoir une pensée pour tous les amis en France et ailleurs qu’il me tarde de retrouver sur la route.
Je voudrais remercier profondément ma famille pour son soutien inconditionnel et on ne peut plus indispendable, aussi bien sur le plan matériel que moral. Bien que séparé d’un océan, j’ai toujours ressenti vos encouragements.
Je réserve mes derniers remerciements à Orphé, qui m’aura appuyé et n’aura jamais cessé de croire en moi tout au long de ce doctorat. Si ces dernières années ont été riches en enseignements, et resteront comme des souvenirs inoubliables, il me tarde maintenant d’embarquer pour de nouvelles aventures qui s’annoncent tout aussi palpitantes…
« La vie ne réside pas dans les molécules, mais dans les liens qui les unissent » Dr. L. Pauling
Avant-propos
Cette thèse se compose de cinq chapitres incluant une revue de littérature (chapitre 1), une discussion et conclusion générale (chapitre 5) et trois articles originaux (chapitre 2 à 4). Le premier article présenté dans cette thèse (chapitre 2) intitulé: Responses of different body compartments to acute dietary phosphorus deficiency in juvenile triploid rainbow trout (Oncorhynchus mykiss, Walbaum), a été publié dans Journal of Applied Ichtyology et j’en suis le premier auteur. Le Dr. M.-H. Deschamps ainsi que l’étudiante à la maîtrise N. Poirier Stewart et la professionnelle de recherche É. Proulx ont participé à l’échantillonnage des poissons, ont participé aux acidifications et à l’obtention des valeurs en cendres. É. Proulx a conduit les analyses de teneur en P sur Dionex. Tous les co-auteurs ont participé activement à la rédaction et à la correction du papier.
Auteurs : Le Luyer J., Deschamps M.-H., Proulx É., Poirier Stewart N., Robert C., Vandenberg G. W.
Le second article présenté dans cette thèse (chapitre 3) intitulé: Establishment of a comprehensive reference transcriptome for vertebral bone tissue to study the impacts of nutritional phosphorus deficiency in rainbow trout (Oncorhynchus mykiss, Walbaum), a été publié dans le journal Marine Genomics et j’en suis le premier auteur. Le Dr. M.-H. Deschamps ainsi que l’étudiante à la maîtrise N. Poirier Stewart et la professionnelle de recherche É. Proulx ont participé à l’échantillonnage des poissons. Le Dr. C. Robert, le Dr. A. Droit et l’étudiant au doctorat C. Joly Beauparlant m’ont appuyé pour l’analyse des données de RNA-seq. Tous les co-auteurs ont participé activement à la rédaction et à la correction du papier.
Auteurs : Le Luyer J., Deschamps M.-H., Proulx É., Poirier Stewart N., Joly Beauparlant C., Droit A., Robert C., Vandenberg G. W.
Le troisième article présenté dans cette these (chapitre 4) intitulé: RNA-seq transcriptome analysis of pronounced biconcave vertebrae: a common abnormality in rainbow trout (Oncorhynchus mykiss, Walbaum) fed a low-phosphorus diet, a été soumis au Journal of
H. Deschamps, l’étudiante à la maîtrise N. Poirier Stewart et la professionnelle de recherche É. Proulx ont participé à l’échantillonnage et ont mené les analyses morphométriques et histologiques. L’équipe du Dr. J.-Y. Sire a réalisé des mesures de μCTs. Tous les co-auteurs ont participé activement à la rédaction et à la correction du papier.
Auteurs : Le Luyer J., Deschamps M.-H., Proulx É., Poirier Stewart N., Droit A., Sire J.-Y., Robert C., G. W. Vandenberg
1 Chapter 1: Literature review
1.1 Fish production
1.1.1 Aquaculture in Canada
Aquaculture is one of the fastest growing animal production industries in the world and symbolically overtook fisheries as the major supplier of aquatic products. To date, grass carp (Ctenopharyngodon idella), silver carp (Hypophthalmichthys molitrix) and tilapia (Oreochromis niloticus) represent the largest quantity of finfish product globally reaching, in 2012, 5.0 Mt, 4.2 Mt and 3.8 Mt, respectively [1]. However, Atlantic salmon (Salmo
salar) remains the most valuable production totalling around 2.1 Mt for up to US$10.1
billion in 2012 [1] far beyond rainbow trout (Oncorhynchus mykiss). Yet, over the recent past, the global production of rainbow trout has increased 1.55-fold in volume (+55.7% from 549 kt in 2002 to 855 kt in 2012) and 2.43-fold in value (+143% from US$1.4 to US$3.6 billion in 2012) making it also one of the most valuable farmed finfish species [1, 2]. In Canada, salmon farming is by far the most important finfish production with a total volume of 101 kt valued at US$691 million in 2010, whereas trout production level is barely maintaining at 7 kt per year for a global value of US$35 million. If trout production in Quebec accounted for only 19% of the total Canadian trout production in 2010 [2], it still remains the most important finfish production sectors at the provincial level. In Quebec, trout aquaculture is mainly based on freshwater production with final product directed primarily to re-stocking (75%), but also for human consumption and recreational fishing. Trout production in Quebec represents 140 companies and more importantly, provides full-time employment in rural areas. Although its production yield is relatively low compared to other Canadian provinces such as New Brunswick, British Columbia or Nova Scotia, Quebec displays a tremendous potential regarding the technical knowledge and the natural resources available. Nevertheless, correctly developping the sector will require a strong support from multiple stakeholders and a focus on sustainable development through the reduction of the negative impact of production on receiving water bodies.
1.1.2 General problematic and management strategies for aquaculture farming
The rapid expansion of aquaculture industry worldwide over the past decades has raised concerns about its impacts on surrounding ecosystems. For instance, interactions between farmed and wild populations have been particularly studied with regard to competition for resources as well as transmission of diseases and genetic material (interbreeding) by mature and highly competitive farmed fish [3–6]. From a productivity point of view, sexual maturation is also detrimental mainly because of lower flesh quality and lower yield [3, 4]. In order to minimize both ecologic and economic impacts of farmed fish maturation, one management strategy is to produce sterile fish. Sterilisation by triploidisation (three sets of chromosomes) appears to be the only commercially-acceptable method [9], and has been widely studied particularly in salmonids [10]. However, triploid males are still hormonally competent and can display gonadal development [11]. To date, most of the global trout production is thus based on all-female triploids. The use of sterile fish is particularly relevant in the province of Quebec where rainbow trout has been imported and could significantly compete and/or hybridize with native trout populations. Another issue facing the growing aquaculture industry is the global impact of agricultural effluents and soil erosion on surface water [12] despite the implementation of management regulations to all agricultural sectors, including aquaculture, aiming to reduce environmental pollution and water contamination. Indeed, special environmental concerns with regard to fish farming excessive output water contamination strongly affected the expansion of Quebec freshwater aquaculture, partially explaining the stagnation of provincial rainbow trout production. As in some other agriculture systems, discharge of phosphorus (P) in particular has been a recurring problem in fish production over the past two decades.
1.1.3 Phosphorus uses and problematic in aquaculture
Phosphorus is limiting for primary production in freshwater environments. Phosphorus emanating from fish production arises uniquely from the feed. With regard to fish production, we know that P from faeces or uneaten feed is mainly liberated as soluble element directly available for algal growth [13, 14]. Bureau and Cho [15] demonstrated, for example, that P status in fish increased with increasing P dietary levels, and thus resulted in increasing P renal excretion. These wastes are known to negatively affect water quality and
to lead to eutrophication in freshwater ecosystems [16, 17]. Indeed, an abnormal net augmentation of P level causes rapid algal growth and the rapid accumulation of organic matter in streams and lakes bottoms. The resulting increased presence of heterotroph bacteria consuming these algae might induce severe oxygen deprivation in the water, leading to hypoxia and/or anoxia with fatal consequences for a wide range of aquatic species. Almost 40 years ago, field studies had already demonstrated that high P concentrations affect species diversity in a closed environment, as illustrated by the lake Memphremago case in the Quebec-Vermont region [18]. Consequently, to prevent the negative impact of P excess in watershed, several technologies have been investigated, involving capture or removal of uneaten feed and faeces, treatment of effluents or optimisation of P retention. Yet, to date, up-stream control of P provided to fish (using low-P diets) appears to be the most promising and tangible approach to minimize low-P output [19].
The dynamics of dietary P levels are, however, particularly challenging since P intake and bioavailability can significantly vary with the diet composition, the level of digestible energy, P origin, P chemical form/solubility and the fish species. For instance, studies reported that P originating from bone in fishmeal was moderately available to fish [19]. However, phosphorus hydrolyzed from animal-by-product is fairly digestible for the fish [20] whilst P from plant seeds is bound to phytate, which significantly reduced its availability. Yet, due to increased global demand and limited availability of marine-derived feedstuffs, several alternatives have been developed to increase the amount of plant-derived proteins in aquafeeds. The use of technologies to increase P availability from the sources has been explored [21–23]. For instance, Carter and Sajjadi [24] showed that Atlantic salmon fed low fishmeal (4.5%) and 60% soy protein concentrate, benefited from phytase (at least 1000 FTU/kg or 250 FTU/kg when pre-treated before making the diets) for final growth, mineral availability and fish body composition. However, in addition to the other anti-nutritional factors present in plant-derived feedstuff, determining optimum levels of phytase remains particularly challenging since it might be strongly dependent on temperature, plant ingredients or associated treatments during feed processing or may vary between species. Finally, independently of the source of P, providing P in optimum levels
relies primarily on a precise measurement of fish minimal P requirement, which still remains to be better defined.
1.2 Phosphorus
1.2.1 Phosphorus requirement
Phosphorous requirements for rainbow trout have been estimated between 0.54% and 0.61% total P in the dry matter basis (DM) [25, 26] with a digestible P to digestible protein ratio ranging from 0.19 to 0.27 MJ-1 [25, 27]. To date, total P levels in commercial diets available for salmonids range from 1.0% to 1.4% (DM) in accordance with Canadian fish feed legislation (set to a minimum of 1% and a maximum of 2.5% total P, DM). Over the past decades, a large number of studies have helped refine this requirement for several fish species. Yet, these studies also revealed that P requirement calculation is significantly affected by fish size, growth rate and life stage [26–33], species [25], fish digestive tract anatomy (e.g. fish with or without acid secreting stomach) [34], as well as feeding procedures [35] and rearing systems [36]. Comparing results from these studies is thus complex and further challenged by the use of a multiplicity of indicators to assess fish response to low-P diets. By order of occurrence, common indicators include somatic growth, P status (in ash or P) in vertebrae, whole-body and scale, non-faecal P excretion, plasma P concentration and retention and, more recently, genes expression in the kidneys and the intestines [31, 36, 37]. A meta-analysis conducted on up to 64 studies, reported that using a weight gain indicator could lead to significantly lower (up to 50%) estimation of P requirement compared to an estimation on whole-body P concentration [36]. Consequently, the weight gain would not be an efficient indicator for early detection of certain deficiency symptoms, even when total body P reserves are strongly depleted [38]. To date there is no consensus as to which indicator should be used, and basing minimum requirement calculation on certain P status assessment could be misleading. Indeed, analysis reported that minimal available P requirement could be estimated at 2.8%, 4.7% and 5.2% P available (DM), when calculated from the levels of P in the plasma, in the whole-body and in vertebrae, respectively [36]. Whilst P plasma levels could appear as the most early and stringent indicator of P depletion in rainbow trout, it is nonetheless largely dependent on
the time of sampling, the dietary status and tissues mobilization [36]. Basing minimum P requirement calculation on P plasma concentration could thus yield very dissimilar results.
With the development of molecular biology and transcriptome-wide tools, specific genes expression has also been observed to be influenced by P-dietary levels in rainbow trout [33, 37, 39, 40]. For instance, the expression of sodium-phosphate co-transporter (NaPi-II), vitamin D receptor (VDR) as well as 25-hydroxyvitamin D-24-hyroxylase (cyp24) were affected by P levels in the diet in rainbow trout kidney whilst NaPi-II expression was also affected in the small intestines and the pyloric caeca [33]. However, Sugiura et al. [37] showed that, in 1.5 years old rainbow trout, calculation of minimal P requirement using gene expression assessment was relatively variable within treatment and time of sampling, ranging from 0.33% to 0.71% (DM total P) according to mitochondrial Pi carrier (mtPi) and intestinal NaPi and renal NaPi cotransportors expression, respectively. Consequently, if the use of gene expression gives precious information of how Pi absorption is regulated, its utility for detecting clinical symptoms and for assessing minimum P requirements gave mitigated results due partially to its transient expression. From a production perspective, it is thus crucial to detect early P depletion in fish before the rise of P deficiency epidemics. Indeed, deficiency in early developmental stages can cause long-latency diseases such as the severe deformities reported in Atlantic salmon when transferred to seawater [41]. Reliable indicators for the detection of early effects of P-deficiency in fish are thus needed for timely remedial or for preventing action to be taken. 1.2.2 Mineral homeostasis
Accurately estimating P-requirements, to ensure fish health without arming the environment, requires a better understanding of P function and regulation, and mineral homeostasis in fish. All vertebrates, including teleosts, have to maintain a tight balance between intra and extracellular minerals levels. Minerals can be divided into two groups based on the quantity required in the diet: macro-minerals, such as sodium, chloride, potassium and P, and micro-minerals. P plays a large range of crucial biological functions in fish and intervenes in energy transfer (ATP), genetic material composition (DNA, RNA) and structural support and protection provided by membranes (phospholipids) and bones
[42]. As mentioned earlier, P concentration is limiting in water environment whilst calcium (Ca) is largely available, hence the hypothesis that P might be the driving force regulating mineral homeostasis in fish [43]. Vielma and Lall [44] have shown that absorption through the intestines, conservation in the kidneys and storage in the bones mainly control P homeostasis in Atlantic salmon. Like in mammals, rainbow trout P absorption mostly occurs in intestinal and renal components while also possibly in the skin and gills, through both paracellular passive diffusion and transcellular active transport [45]. Numerous studies have focused on identifying genes involved in P absorption and reabsorption in intestines, pyloric caeca and kidneys in rainbow trout [33, 39, 40]. These studies showed that regulation of Pi absorption, or at least of the NaPi-II action on Pi absorption, might vary between the intestines and pyloric caeca. Indeed, NaPi-II gene expression in the intestines increased from day 2 in fish under low-P diet, indicating that the intestines may be the first responsive tissue, yet the increase was relatively low after 20 days (fold change, FC = 3). In contrast, NaPi-II expression in pyloric caeca was higher in low-P fed fish from day 5 and strongly increased until day 20 (FC = 10.1) [33]. Identifying P-responsive genes in trout are relevant for further understanding of mammal physiology since P-homeostasis among monogastrics species display common characteristics [46]. However, differences in the digestive and the kidney systems (lack of vili and loop of Henle, respectively, in fish) suggest differences in Pi homeostasis among vertebrates. Furthermore, the exact proportion of P that fish uptake directly from the water through the gills is still to be quantified, but it could provide explanation for the differences observed between flow-through and recirculating systems in minimal P requirement calculation [36].
Another source of debate is about the ability of fish to mobilize their P reserve from the endoskeleton to supply other body compartments. For instance, studies based on the endoskeleton mineralization under varying level of Ca in the water reported evidence that Ca deprivation did not trigger acute bone resorption nor mineral redistribution in fish with acellular bone, except under drastic conditions [for review see 47]. However, in fish, P rather than Ca is considering as the main actor influencing mineral deposition/resorption [43, 47], hence these studies might not be conclusive on the role of bones in mineral homeostasis. Furthermore, beside the endoskeleton, fish have several other sources of P
such as scales [31, 48, 49] or dentition [50] that might be more readily available. Indeed, previous studies demonstrated that scales were preferentially resorbed under low P-diets [31, 48, 51]. However, is it true that, under very extreme conditions such as migration or sexual maturation (inducing elevated mineral requirement), salmonids can effectively mobilize P (and Ca) reserves from distinct skeletal compartments [52–54]. Similarly, rib shape has been identified as first signs of P deficiency in fish [48, 55]. Yet, P-deficiency might be limited to scales and ribs without affecting other skeletal compartments or dramatically affecting fish well being, at least during the initial period of deficiency. However, altered vertebral structure and associated defaults in fish performance are responsible for significantly reduced yield and are thus considered as major threats to aquaculture productivity. For this reason, this project focuses on specific vertebral responses to P deficiency.
1.3 Bone tissue
1.3.1 Bone components and vertebrae
The skeleton is involved in body scaffolding, muscle anchoring, organs and soft tissues protection (vertebrae, scales) as well as food acquisition and processing (teeth and tooth-like organs), along with primordial physiological roles [56, 57]. Bones of teleost fish, tooth-like those of mammals, are constituted of an extracellular matrix (osteoid or cartilage matrix) containing collagen fibers and other non-collagenous proteins that will eventually mineralize during fish development. As mentioned above, P absorbed in the organism is accumulated in several soft tissues (heart, liver, kidney, muscle and blood) but mostly in the skeletal tissue [58]. Indeed, the mineralized portion of the skeleton constitutes up to 85% of the total body P in fish [45, 59]. Bone mineralization or cartilage calcification results from the precipitation of Ca and P into crystals of hydroxyapatite (HA; Ca5(PO4)3(OH)) and its deposition on the matrix. Why and how minerals precipitate is not fully understood, yet the combination of a favourable environment (pH, Ca P saturation) and the removal of mineralization inhibitors (such as pyrophosphate, PPi) are known to be key factors of crystal formation [60]. A recent study on Atlantic salmon vertebrae revealed that mineralization is initiated with accretion of HA on the surface of the collagen matrix in
the notochord sheath [61]. After nucleation, the HA crystals fix themselves to the organic matrix, yet the mechanisms controlling their growth and expansion remain to be defined. However, it is known that matrix proteins, such as the most common non-collagenous proteins including bone Gla protein (osteocalcin, BGLAP), matrix Gla protein (MGP), osteopontin (OPN or SPP1) and osteonectin (SPARC), partially control the mineral deposition/expansion process [62, 63] together with the structure provided by the orientation and assembling of the collagen fibers. Mineral fixation to the matrix needs to be strong, as indicated by the relative stability of the mineral phase; yet, it must also allow the mobilization of minerals for later need by the organism. Mineral status is tightly correlated with the specific physical and physiological roles of each organ [60]. Consequently, it is not surprising that differences are observable regarding the fine composition (proportions of organic matter, minerals and water, and Ca:P ratio) of the different mineralized body parts. Interestingly, several descriptive studies have shown that vertebrae display differences in size or mineral status along the vertebral column depending on their role in the fish physiology [53, 64].
From an evolutionary perspective, teleost bones display the singularity to be divided in two different types: cellular and acellular. Typically, cellular bone (containing cells, osteocytes), resembling mammallian bone morphology, is present in some species belonging to lower order of teleost fish such as clupeiformes, scopeliformes and salmoniformes, including rainbow trout [43, 47, 65]. However, even if phylogenetic differentiation is clear, some exceptions occur within the Protacanthopterygii, Salmonidae and Thunnini families [66]. Inversely, acellular bone is characterized by the absence of osteocytes, where osteoblasts recede from the mineralization front and are not embedded in the matrix [67]. From a physiological perspective now, bone formation can follow two distinct patterns: intramembranous or endochondral ossification [68]. Intramembranous ossification is the process by which bone is produced without prior formation of a cartilage template. During endochondral ossification, on the contrary, mesenchymal cell condense and become cartilage-producing cells serving as template for later bone deposition. In contrast with mammals, fish vertebrae differentiate directly from the notochord sheath [69], except for a very localized section called the basalia, and thus are mainly formed through
intramembranous ossification (Figure 1.1). The basalias are cartilage-specific tissue responsible for the production of haemal and ventral arches in fish [70] and display a typical endochondral ossification [71]. According to the different compartments of the vertebrae, structures consist on either mineralized tissue from notochordal sheath or direct ossification. Development of the vertebrae and bone formation in Atlantic salmon has been well described [69]. Briefly, at approximately 680 day-degrees (d°), Atlantic salmon notochord first differentiates into chordocentra next to the dorsal fin to form complete acellular mineralized rings separated by non-mineralized intervertebral spaces. Collagen fibers are oriented perpendicularly to the cranio-caudal axis. Later, at 800 d°, a second layer of collagen, parallel to the cranio-caudal axis, is formed on vertebral and intervertebral spaces. In the thin outside layer of chordacentrum, osteoblasts deposit osteoid with collagen fibers oriented perpendicularly to the cranio-caudal axis. At this stage, the vertebrae acquire their amphicoel form. Direct deposition on new bone tissue is undertaken on the lateral sides of the vertebrae, at approximately 1000 d°. In this bone portion, collagen fibers appear as not identically oriented (woven bone) and in lower density than in the others layers, resulting in a vertebra with both compact and cancellous (or trabecular) bone tissue. A total of approximately 64 vertebrae interconnected by intervertebral tissue form the vertebral column in rainbow trout [53].
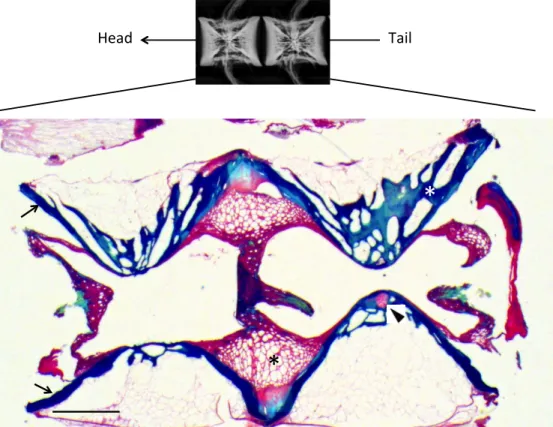
*
*
Tail Head
Figure 1.1: Longitudinal section of normal vertebrae of rainbow trout, visualised by Masson’s trichrome staining. Normal vertebrae bodies are jointed by notochordal tissue (red) characterized by large cells (black asterisk). Bone tissue (blue) consisted of trabecular bone (white asterisk) and a thinner layer of compact bone (black arrows). Basalias (black arrowhead), composed of chondrocytes cells, are responsible for the production of both hemal and dorsal arches. Bar = 1 mm.
1.3.2 Bone deformities with emphasis on P-induced vertebral deformities
The occurrence of deformities is a subject of importance that has been studied for several decades in various species of interest related to fish physiology. Indeed, we know that deformities might in fine affect fish growth or decrease their immunological capacities to face diseases or parasitological events, hence significantly affecting productivity. Deformities affect almost all mineralized tissues in fish although, here, we will focus on the vertebral deformities, a common problem in fish, especially salmonids, farming [64]. From
deformities. Indeed, environmental factors such as photoperiod [72, 73], water temperature [74–77], genetics [78–81], ploidy [7, 82–85] or rearing systems [86, 87] are major factors of deformity prevalence in farmed fish. Feed composition, such as vitamin levels, particularly vitamin C, D and K [88–93], is also a common source of deformity occurrence. Among other nutritional factors, the role of minerals, such as P, and of micronutrients levels have been particularly studied and remain, to date, one of the most explored factor of deformities occurrence [58, 94]. Studies on vertebrae body require an integrated approach to overview its complexity. Such approach, proposed by Ytteborg et al. [70], incorporates several levels of techniques ranging from a simple visual examination to molecular tools. A description of those tools with an emphasis of the observation of vertebrae under P-deficiency will be detailed below.
1.3.2.1 Visual examination
Rapid and frequent sampling/examination allows the detection of defaults in fish performance. Defects in growth, feed intake, feed conversion or higher condition factor are common indicators of abnormal fish development under P-deficiency [36, 58, 94]. Indeed, fish exposed to a P-deficiency period commonly display higher condition factor (K) resulting from a reduced growth, particularly correlated with fast-growing fish rather than large fish (for review see [94]). Yet, P deficiency in juveniles can induce long-term consequences appearing in specific conditions such as transfer from fresh to salt-water in salmonids [41]. Defaults in fish performance might also reflect more serious complications such as the apparition of severe malformations [95]. For instance, Fjelldal et al. [96] reported the common skeletal deformities observed in cultured Atlantic salmon such as abnormal jaws curvature, shorter operculum or default in the vertebral column. Vertebral deformities assessed by visual examination or palpation includes fish showing non-standard body shape (such as scoliosis, kyphosis and lordosis) [58, 97]. However, those observations are often associated with late and severe diseases and early detection should preferentially rely on more sensitive observations.
1.3.2.2 Radiographic analysis and mineralized structure
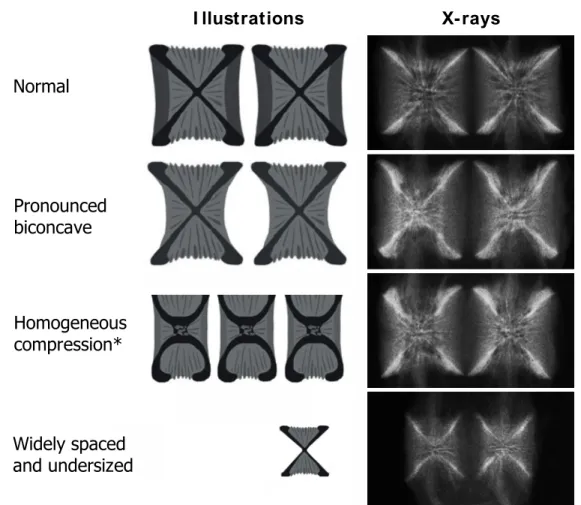
Radiographic analyses allow the detection of discreet (or internal) deformities associated with abnormal vertebral structures in cultured fish [96, 98–102]. Discreet vertebral deformities represent vertebral body showing no-standard structure. Based on x-rays, Witten et al. [103] compiled a list of 20 types of vertebral deformities observed in Atlantic salmon and reported that some of these deformities were primarily observed in fish under mineral deficiency. Indeed, previous work on salmonids reported that fish with lower levels of dietary P displayed increased internal malformations along the vertebral column compared to P-sufficient fish [30, 41, 104–106]. Based on Witten et al. [103] classification, Deschamps et al. [100] reported that malformations in P-deficient fish spread all along the column and mostly consisted in namely: homogenous compression, compression and reduced intervertebral space, compression without x-structure and pronounced biconcave phenotypes. Similarly, Poirier Stewart et al. [104] observed that the main deformities phenotypes in P-deficient rainbow trout were pronounced biconcave and homogenous compression, wilst they also noted a high representation of small and widely spaced vertebrae (Figure 1.2). Furthermore, the latter work provided a new tool for rapid and subjective discrimination of those common deformities by measuring angles, length and height of the vertebrae. Interestingly, the prevalence of deformities observed in fish might differ depending on the body regionalisation in accordance with previous observations reporting the variability in size and mineralization status of the vertebrae along the vertebral column [46, 65]. For instance in farmed rainbow trout, the majority of vertebrae affected by a deformity were localized in the post-cranial (V1-7) and caudal regions (V50-60), plus some within the middle region [98, 99]. Interestingly, vertebrae with altered structure, leading in some severe cases to fusion, might either be a starting point for a spread severe malformation or remain contained to these vertebrae bodies [107]. Besides, the pronounced biconcave phenotype, characterized by transparent vertebral body endplates, vertebral body with vertical apple core shape and an x-shaped centrum of the vertebrae displaying more acute angles [104], is considered as a transient phenotype toward a more severe compression type. Surprisingly, however, under specific conditions, pronounced biconcave vertebrae might return to a normal phenotype [104], hence the importance to understand the mechanisms behind the vertebra body structure regulation.
Radiographs are thus a potent and non-invasive tool for quick detection of vertebral deformities, yet they have their limits and only give an idea of the condition of the mineralized structure of the vertebrae.
Normal I llustrations X-rays Homogeneous compression* Pronounced biconcave Widely spaced and undersized
Figure 1.2: Illustrations and X-rays of the most reported vertebrae phenotypes associated with mineral deficiency in teleost. Illustrations were adapted from Witten et al. [103] and Poirier Stewart et al. [104]. * Despite the absence of endplate binding, associated x-rays correspond to the homogenous compression phenotype (Witten personal communication).
To explore in more deepth how the bone mineral structure is affected by low-P diets, several other tools are available. As mentioned above, P deficiency commonly results in a lower bone mineral content (BMC), expressed as ash or P content, of the mineralized tissue including scales and vertebrae [36, 108]. In production situations, mineralization default and lower BMC were also associated with abnormal vertebral morphology [90, 91, 98, 106], hence the use of BMC as early indicator of abnormal vertebrae development. However, BMC at late stages of deformity development like in already fused vertebrae, for
instance, might be similar to normal vertebrae BMC [82]. Thus, due to the complexity of mineral deposition in the vertebrae, understanding the processes involved in the mineralization of the extracellular matrix (ECM) should not be limited to the monitoring of BMC content. Several histological-based techniques such as Von Kossa staining or Fourier transform infrared microspectroscopic (FTIM) have allowed a sensitive description of the mineral deposit conformation and composition (Ca:P ratio). For instance, Boskey et al. [109] used FTIM to interpret the role of BGLAP in the regulation of HA crystals expansion in BGLAP-deficient mice. Furthermore, Deschamps et al. [110] developed a model based on transverse ground section (125 m) imaging to reveal a bone compactness of the vertebral profile. The bone compactness index was particularly useful in assessing resorption events in the trabecular bone region [110]. Finally, advances in imaging such as micro-computed tomography (CT) imaging also allowed reconstruction of a 3D structure of the vertebrae to quantify total mineral deposit in teleost [111]. To our knowledge, with the exception of BMC, other tools for fine description of the mineral structure have not been employed to assess the impact of low-P diets on vertebral development in fish but would certainly assist in further understanding the process of vertebral deformity appearance.
1.3.2.3 Biomechanics
Skeleton, and particularly vertebrae, serves as support for surrounding muscles to allow efficient locomotion. However, vertebral biomechanical behaviour may vary depending on a wide range of factors, hence modulating the risk of developing abnormal phenotypes. For instance, Fjelldal et al [112] reported that vertebrae from fish subject to a pinealectomy displayed significant lower bone stiffness. Similarly, underyearling smolts had a significantly lower stiffness of the vertebrae than the yearling smolts and wild post-smolts sampled after their first summer at sea [113]. Consistently with previous observations, P-deficient fish had a lower P status and lower BMC of mineralized tissue, also correlated with a lower stiffness of the vertebrae [111, 113, 114]. These observations echo the lower P status of the mineralized skeleton components as well as the delayed ossification observed in fish subject to P deficiency, together with their higher rate of deformities [30, 31, 48, 105]. Less-mineralized vertebrae are more flexible and thus may be more deformable under
compressive forces [103]. Indeed, a higher bone fracture rate was observed in fish deficient in vitamin C but not in P-deficient fish, suggesting that bone in P-deficient fish are softer, limber and more bendable [90]. Finally, as developed in the previous section, the extracellular matrix conformation strongly participates in the regulation of the mineral structure and needs to be further described.
1.3.2.4 Histology and immunohistology
X-rays and mineral structure monitoring are limited to the mineralized portion of the vertebrae and fail in determining if P-induced malformations either result from a lower bone deposition and/or a higher resorption activity. To fill this gap, histological staining is commonly used to assess cellular recruitment and tissue distribution within the vertebral and intervertebral regions. For instance, Masson’s trichrome staining was used to monitor tissue distribution in fused vertebrae of Atlantic salmon and highlighted the presence of ectopic mineralized cartilage replacing the notochord of the intervertebral space [107]. Remodelling of the notochord of fused vertebrae was further described by using immunohistochemistry (based on specific antibodies) to detect distribution of aggrecan, perlecan and substance P as well as DAPI and Nucleic Acid Staining to localize cell nuclei, in the intervertebral space [115]. Consistently, authors further demonstrated that the notochord in fused/hyperdense vertebrae was mineralized by the action of metaplastic notochordal cells [115]. Similarly, Fontagné et al. [30] used common alizarin red and alcacian blue staining for identification of calcified bone and cartilage tissues, respectively, in the entire rainbow trout fry. The authors thus observed that fry subjected to P deficiency displayed delayed ossification. Additionally, cellular distribution and activity have been monitored in teleost skeleton using histological techniques [116, 117]. However, to our knowledge, no work to date reported the histological observation based and tissue distribution and cellular activity of the common vertebrae deformities observed in P deficient fish.
1.3.2.5 Molecular studies
All the previous detailed tools give precious information allowing a refined characterisation and detection of vertebral abnormalities. Yet, by only detecting abnormalities when they
are already established, they fail in preventing the initial negative impacts of P-deficiency in fish. Molecular changes are known as the first sign of cellular metabolism response to stimuli and have therefore been particularly studied to possibly address the shortage of adequate “warning indicators”. For instance, the quantitative polymerase chain reaction (qPCR) has been largely used over the past years, together with in situ hybridization techniques, to quantify and localize gene expression for specific responsive-genes. For instance, Ytteborg et al [77] reported 20 temperature-responsive genes involved in bone mineralization, matrix formation, chondrocyte differentiation and bone resorption, correlated with higher risk to develop vertebral deformities in Atlantic salmon. Similarly, Darias et al. [118] showed that inadequate level of ascorbic acid in the diet induced appearance of vertebral deformities in sea bass (Dicentrarchus labrax) and impaired the expression of genes related to skeletogenesis and mineralization, such as the bone morphogenetic protein 4 (BMP4) and BGLAP. The latter led to the development of new technological tools such as micro-arrays, allowing quantifying thousands candidate genes. For instance, Ferrareso et al. [119] developed a DNA micro-array chip to study differential gene expression between control and sea bass showing jaw deformities, also allowing the selection of specific traits for particular strain selection. Similarly, microarray analysis was employed by Wargelius et al. [73] who identified the COL11a1 as an actor of vertebral plasticity potentially involved in the higher risk of vertebral deformity in salmon. To our knowledge however, while micro-arrays were used to detect intestinal-response to a P-deficiency [39, 40], quantitative gene expression was limited to a few markers of cellular activity in the study of vertebral response to P-deficiency. The lack of such data may partially be explained by the relatively limited genomic data available for rainbow trout bone-specific genes so far.
More recently, the development of next-generation sequencing (NGS) technologies has considerably expanded the possibilities to work on non-model species and to use genomics without prior references. Although implementing NGS tools in species with highly polymorphic and complex genomes remains a challenging task, the rapid evolution of bioinformatics for large dataset analyses provides novel opportunities to correctly assemble the transcriptome of non-model species [120, 121]. Recently, the first
transcriptomes for vertebrae and gill arches of sea bream (Sparus aurata) have been sequenced using 454 Roche technology [122]. However, in contrast with basal teleost such as trout and other salmonids, bones of advanced teleost lack osteocytes (acellular bone). Development and regulation of bone tissue might, therefore, differ considerably [47, 122]. Moreover, according to Vieira et al. [122], the limited depth of 454-sequencing was an issue for the detection of genes expressed at very low abundance. Indeed, genes known to control P and calcium homeostasis and/or bone mineralization (such as matrix proteins produced by cells specific to bone tissue) may show relative low expression; this demonstrates the need for tissue-specific experiments and high depth sequencing. To our knowledge, NGS technologies have been used for a broad range of biological studies in teleost, including rainbow trout, but these studies were mostly based on the response of soft tissue or of the whole organism without specific consideration to the skeleton [123–126].
The vertebral column being a complex tissue with remarkable cell diversity under tight-hormonal regulation, an intimate understanding of its response to P-deficiency remains challenging. Yet, such work, together with the use of common tools for mineralized structure description, histology and visual monitoring, would deeply benefit from a novel transcriptomic approach based on NGS technologies.
1.4 Cellular activity in bone formation and remodelling
Normal bone turnover is under a balanced control of bone formation and bone resorption [43, 47]. It is relevant to mention, however, that fish vertebrae are under constant growth throughout life, hence their putative lower need for bone remodelling in comparison to mammals [70]. Similarly to vertebrates, teleost skeletal structure is mainly under the control of four living cells types: osteoblasts, osteocytes, osteoclasts and chondrocytes. 1.4.1 Osteoblasts and osteocytes
Osteoblasts, derived from mesenchymal stem cells (MSCs), represent up to 6% of the total bone cells and are considered as the main actors of bone deposition [127]. Osteoblasts achieve secretion of the ECM throughout the life of the organism and play a significant role
osteoblast membranes [127–129]. However, recent work indicates that the role of osteoblasts was not limited to bone formation but also includes the regulation of osteoclastogenesis and of hematopoietic stem cells (HSCs) as well as a role in endocrine functions [127]. For instance, the production of circulatory BGLAP by osteoblasts also interferes with the whole organism energy metabolism by stimulating production of insulin in pancreatic islet and increasing insulin sensitivity in the adipose tissue [57, 127, 130]. Furthermore, proliferative osteoblast progenitors and mature osteoblasts express alkaline phosphatase (ALP) and collagen fibers such as COL1a1. Due to the relative simplicity to monitor ALP by either gene expression or histological methods and its specificity to osteoblast cell-lines, ALP is usually used as a marker for osteoblast detection and bone formation monitoring in mammals [131] as well as in teleosts [116]. According to Willems and al. [132], these cells could also have an important role in the mineralization of chordal centrae since conditional ablation of osteoblasts in medaka (Oryzias latipes) displayed a continuous mineralized notochordal sheath without intervertebral spaces. Fjelldal et al. [72] reported a lower ALP activity in vertebrae of Atlantic salmon fed low dietary-P levels, suggesting lower osteoblastic activity and lower bone formation. Finally, mature osteoblasts may enter apoptosis, become bone-lining cells (preventing bone remodelling) or become osteocytes (Figure 1.3).
Osteocytes are osteoblasts embedded in the matrix that they produce and represent by far, the more abundant cells in bone tissue, constituting up to 90% of the total cell number [127, 133]. Franz-Odendaal et al. [133] described different stages of differentiation from osteoblasts to osteocytes shedding light on the different stages/functions of osteocytes and their role in both bone formation and resorption. Indeed, work has shown that, at first, osteocytes display a large Golgi apparatus system suggesting a higher capacity of collagen production whilst, in later stages (when osteoid is fully mineralized), they undergo a reduction of both endoplasmatic reticula and Golgi apparatus, indicating their functional shift to bone resorption (for review see [127]). Similarly, a switch of expression from osteoblast specific markers to osteocytes-specific markers accompanies osteocyte-differentiation [127, 134]. In addition, osteocytes might play a role in the regulation of bone resorption by inducing osteoclast differentiation [135, 136] and promoting the formation of
multinucleated osteoclasts in fish [47]. Moreover, osteocyte-dentritric extensions create a web connection, comparable to neuronal networks, which might be incredibly efficient for signal transfer and physiological response. For instance, studies in mammals have shown that osteocyte activity is particularly responsive to mechanical load [137–139]. As mentioned earlier, vertebrae of P-deficient fish are more limber and more subject to compression forces, suggesting that osteocyte activity might also be strongly affected by a P-deficiency; no such information is available to date.
MSCs Commited pre-osteoblast I mmature pre-osteoblast Mature osteoblasts Apoptosis Osteocytes ALP COL type 1 OPN SPARC ALP BGLAP Cadherin-11 COL type 1 OPN SPARC ALP BGLAP Cadherin-11 COL type 1 M-CSF MGP OPG OPN SPARC OPN SOST KLOTHO
Figure 1.3: Schematic representation of osteoblastogenesis leading to bone matrix production. Gene symbol: ALP- Alkaline phosphatase; BGLAP – Osteocalcin; COL -. Collagen; MMPs – matrix metalloproteases; M-CSF – Macrophage colony stimulating factor; MGP – Matrix Gla protein; OPG – Osteoprotegerin; OPN – Osteopontin; PHEX - Phosphate-regulating neutral endopeptidase, X-linked; SOST – Sclerostin; SPARC - Osteonectin
1.4.2 Osteoclasts and bone resorption
As in mammals, bone resorption in teleost is an extraordinarily energy-demanding process that mainly results from osteoclast activity or osteoclasy [47, 140, 141]. Osteoclasts derive from monocyte/macrophage HSCs (Figure 1.4). However, since teleosts lack proper hematopoietic bone narrow, the equivalent tissue being located in the head kidney, the exact origin of fish osteoclasts is still unknown [43]. According to numerous studies focusing on osteoclasts, it has been shown that this cell type can display different morphologies and activities. For a long time, activated osteoclasts have been associated
with multinucleated cells with ruffled borders. Further observations have demonstrated that multinucleated osteoclasts are indeed associated with deeper bone resorption while mononucleated osteoclasts without ruffled borders exist and induce smooth, superficial resorption [47, 142–144]. Witten and Huysseune [39] suggested a link between acellular bone and the predominance of mononucleated osteoclasts in contrast to cellular bone and multinucleated osteoclasts. Indeed, in basal teleost such as salmonids, both mono- and multinucleated active osteoclasts have been observed [143] and intense resorption was observed during specific physiological conditions [39]. However, in advanced teleosts having acellular bone (e.g. sea bream), mononucleated osteoclasts seem to be predominant if not exclusive, suggesting a poor ability of rapid bone turnover [145]. The activity of osteoclasts in vertebrae results in the woven aspect of the trabecular bone. In mammals, active osteoclasts secrete cathepsin K (CTSK) and tartrate-resistant acid phosphatase (TRAP), acidifying the subcellular space locally to degrade bone matrix proteins and dissolve minerals [146]. The CTSK is considered as the main cathepsin involved in osteoclastic bone resorption [147]. Indeed, CTSK is a potent collagenase, able to cleave type 1 collagen, and further reported that a mutation of CTSK gene coding region induces bone diseases (such as pycnodysostosi) in mammals [147]. Both TRAP and CTSK are also found in various fish species and commonly used as markers of active osteoclast [144, 148]. Similarly, in Haddock (Melanogrammus aeglefinus), Roy and Lall [149] showed that higher recruitment of osteoclasts in P-deficient fish is responsible for higher bone resorption and results in lower vertebral mineralization. Inversely, Fjelldal et al. [72], showed a decrease in bone TRAP activity in low-P fed Atlantic salmon. Consequently, new insights are necessary to assess P impact on osteoclast activity.
Additionally, two osteoclast-independent patterns of resorption are also observable in teleosts. A first pattern consists of a halastic mineral loss, which refers to the demineralization process resulting of a diffusion-only component of mineral loss [47, 56]. The resorption under the halastic process would thus serve as a fine-tuning component for homeostasis regulation in teleosts [52, 54]. The second pattern is the osteocytic osteolysis, which in some cases, might act as osteoclasts to increase the size of the “bone capsule” in which they are trapped resorbing both the matrix and the mineralized structure [150, 151].
Interestingly, previous studies linked both halastatic and osteocytic resorption with Ca (and possibly P) higher requirement in salmon undertaking migration and consequently experiencing severe starvation prior reproduction [52–54].
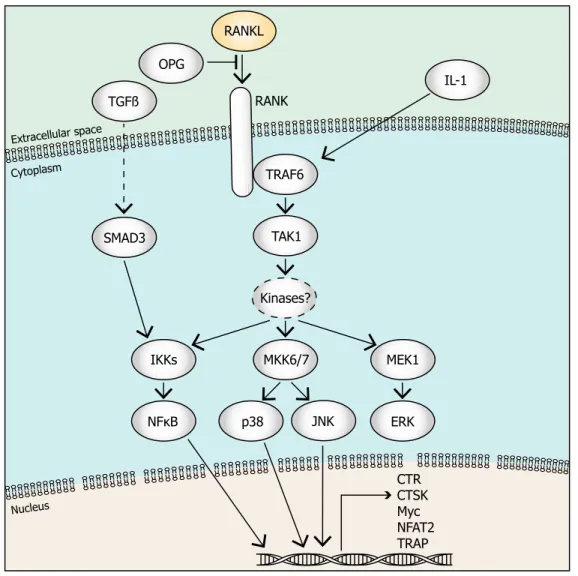
HSCs Commited pre-osteoclast Immature osteoclasts Active multinucleated osteoclasts CTSK H+ MMPs TRAP
Figure 1.4: Schematic representation of osteoclastogenesis leading to bone resorption. Gene symbols: CTSK – Cathepsin K; MMPs – matrix metalloproteases; TRAP - Tartrate-resistant acid phosphatase
1.4.3 Osteoclast-osteoblast communication
Bone formation is a much slower process than resorption [152] hence the need for a tight connection to precisely orchestrate bone cell activity and prevent important bone loss. If osteoblasts and osteoclasts display antagonist effects, they are in reality, highly orchestrated in a basic multicellular unit (BMU). As mentioned above, osteoblast functions also include modulation of osteoclast differentiation either by cell-to-cell contact, formation of gap junctions or through transmission of paracrine factors [135, 153]. In addition, actors produced by osteoblasts have been identified as putative osteoclast-product recruiters, such as monocyte chemoattractant protein-1 (MCP-1), stimulating osteoclast differentiation [153]. Similarly, osteoblastic resorption induces the liberation of factors stored in bone matrix or cellular products (also called clastokines) promoting osteoblast differentiation and maturation as well as osteoblast recruitment [154, 155].
1.4.4 Chondrocytes, cartilage matrix and endochondral bone formation
As described above, under normal conditions, teleost bone displays a wide spectrum of intermediate skeletal tissues (from cartilage-like to bone-like tissues), which is complex to