HAL Id: hal-02291017
https://hal-univ-bourgogne.archives-ouvertes.fr/hal-02291017
Submitted on 18 Sep 2019
HAL is a multi-disciplinary open access
archive for the deposit and dissemination of
sci-entific research documents, whether they are
pub-lished or not. The documents may come from
teaching and research institutions in France or
abroad, or from public or private research centers.
L’archive ouverte pluridisciplinaire HAL, est
destinée au dépôt et à la diffusion de documents
scientifiques de niveau recherche, publiés ou non,
émanant des établissements d’enseignement et de
recherche français ou étrangers, des laboratoires
publics ou privés.
2006 and 2009 as determined by EuroRotaNet, a
pan-European collaborative strain surveillance network
M. Iturriza-Gómara, T. Dallman, K. Bányai, B. Böttiger, J. Buesa, S.
Diedrich, L. Fiore, K. Johansen, M. Koopmans, N. Korsun, et al.
To cite this version:
M. Iturriza-Gómara, T. Dallman, K. Bányai, B. Böttiger, J. Buesa, et al.. Rotavirus genotypes
co-circulating in Europe between 2006 and 2009 as determined by EuroRotaNet, a pan-European
collaborative strain surveillance network. Epidemiology and Infection, Cambridge University Press
(CUP), 2011, 139 (6), pp.895-909. �10.1017/S0950268810001810�. �hal-02291017�
Rotavirus genotypes co-circulating in Europe between 2006
and 2009 as determined by EuroRotaNet, a pan-European
collaborative strain surveillance network
M. I T U R R I Z A - G O´ M A R A1*, T. D A L L M A N2, K. B A´ N Y A I3, B. B O¨ T T I G E R4,
J. B U E S A5, S. D I E D R I C H6, L. F I O R E7, K. J O H A N S E N8, M. K O O P M A N S11, N. K O R S U N10, D. K O U K O U9, A. K R O N E M A N11, B. L A´ S Z L O´12, M. L A P P A L A I N E N13, L. M A U N U L A14, A. M A S M A R Q U E S6, J. M A T T H I J N S S E N S15, S. M I D G L E Y4, Z. M L A D E N O V A10 , S. N A W A Z1 , M. P O L J S A K - P R I J A T E L J16 , P. P O T H I E R17 , F. M. R U G G E R I18, A. S A N C H E Z - F A U Q U I E R19, A. S T E Y E R16, I. S I D A R A V I C I U T E - I V A S K E V I C I E N E20 , V. S Y R I O P O U L O U9 , A. N. T R A N8 , V. U S O N I S20, M. V A N R A N S T15, A. D E R O U G E M O N T17 A N D J. G R A Y1 1
Enteric Virus Unit, Virus Reference Department, Centre for Infections, Health Protection Agency(HPA),
London, UK ;2Bioinformatics Unit : Statistics, Modelling & Bioinformatics, Centre for Infections, HPA,
London, UK ;3
Veterinary Medical Research Institute, Budapest, Hungary ;4
Virus Reference Laboratory,
Statens Serum Institute, Copenhagen, Denmark ;5University of Valencia, Valencia, Spain ;6Molecular Virology,
Robert-Koch Institut, Berlin, Germany ;7Centro Nazionale per la Ricerca e la Valutazione dei Prodotti
Immunobiologici, Istituto Superiore di Sanita`, Rome, Italy ;8Swedish Institute for Infectious Disease Control,
Solna, Sweden ;9First Department of Pediatrics, Athens University, Aghia Sophia Children’s Hospital, Athens,
Greece ;10National Reference Laboratory of Enteroviruses, Department of Virology, National Centre for
Infectious and Parasitic Diseases, Sofia, Bulgaria ;11National Institute for Public Health and the Environment, Bilthoven, The Netherlands ;12
Department of Medical Microbiology, University of Debrecen, Debrecen,
Hungary ;13Laboratory Services(HUSLAB), Helsinki University Hospital,14Department of Food and
Environmental Hygiene, University of Helsinki, Finland ;15
Department of Microbiology and Immunology, Rega Institute for Medical Research, University of Leuven, Belgium ;16University of Ljubljana, Faculty of Medicine, Institute of Microbiology and Immunology, Slovenia ;17Laboratoire de Virologie, CHI de Bocage, Dijon, France ; 18Dipartimento di Sanita` Pubblica Veterinaria e Sicurezza Alimentare, Istituto Superiore di Sanita`, Rome, Italy ;
19Centro National de Microbiologia, Instituto de Salud Carlos III, Madrid, Spain ;
20
Vilnius University Centre of Paediatrics, Vilnius, Lithuania (Accepted 30 June 2010)
S U M M A R Y
EuroRotaNet, a laboratory network, was established in order to determine the diversity of co-circulating rotavirus strains in Europe over three or more rotavirus seasons from 2006/2007 and currently includes 16 countries. This report highlights the tremendous diversity of rotavirus strains co-circulating in the European population during three years of surveillance since 2006/ 2007 and points to the possible origins of these strains including genetic reassortment and interspecies transmission. Furthermore, the ability of the network to identify strains circulating
with an incidence ofo1% allowed the identification of possible emerging strains such as G8 and
G12 since the beginning of the study ; analysis of recent data indicates their increased incidence. The introduction of universal rotavirus vaccination in at least two of the participating countries, and partial vaccine coverage in some others may provide data on diversity driven by vaccine introduction and possible strain replacement in Europe.
Key words: Rotavirus.
* Author for correspondence : Dr M. Iturriza-Go´mara, Enteric Virus Unit, Virus Reference Department, Centre for Infections, Health Protection Agency (HPA), London, UK. (Email : miren.iturriza@hpa.org.uk)
I N T R O D U C T I O N
Rotaviruses are a major cause of gastroenteritis in
children aged<5 years worldwide [1, 2] and of acute
diarrhoea in the young of many other mammalian species (calves, piglets, lambs, rabbits, etc.). They cause more than 600 000 deaths each year, mostly of infants and young children in developing countries [1], and are a significant cause of morbidity and hos-pitalizations in developed countries.
Rotaviruses are classified according to the sero-logical cross-reactivity of the inner capsid protein VP6 into five groups (A–E) and two more groups (F, G) are likely to exist. Within group A rotaviruses, there are subgroups (I, II, I+II, non-I, non-II) charac-terized by their reactivities with two VP6-specific monoclonal antibodies [3]. More recently, RT–PCR has been applied to the subgroup classification of human rotaviruses, and only two major subgroups have been identified [4].
In order to characterize strains on the basis of their surface proteins VP4 and VP7, a binary classification scheme distinguishing types has been established for group A rotaviruses. The system differentiates G-types (VP7-specific, G for glycoprotein) and P-types (VP4-specific, P for protease-sensitive protein). To date, 23 different G-types and 31 P-types have been described [5–9], indicating extensive genomic diversity within group A rotaviruses.
Rotaviruses possess a genome of 11 segments of dsRNA and VP4 and VP7 are coded for by different RNA segments (segments 4 and 7, 8 or 9 depending on strain, respectively). As rotaviruses were found to reassort readily in doubly infected cells in vitro and
in vivo [7, 10–12], various combinations of VP4 and
VP7 types have been observed in natural rotavirus isolates [13–16].
The European Rotavirus Network (EuroRotaNet), was established in January 2007 [17], and has conduc-ted rotavirus strain surveillance in Europe for three consecutive years. Participation in EuroRotaNet is voluntary, and the network activities are funded be-tween the collaborating institutes and GlaxoSmith-Kline Biologicals (GSK) and Sanofi Pasteur-MSD (SPMSD). The participating institutes provide expert-ise, laboratory space, equipment and supervision, and funding for labour and consumable costs associated with strain characterization is provided in the form of an unrestricted collaborative grant in equal parts from GSK and SPMSD, and administered through the Centre for Infections, Health Protection Agency, London, UK.
The study was undertaken in order to gather com-prehensive information of the rotavirus types co-circulating throughout Europe, including both urban and rural settings, and encompassing at least three consecutive rotavirus seasons. The aims of the study were (i) to develop methods and algorithms for effec-tive rotavirus typing (G and P) and characterization (including VP6 and NSP4 genotypes) and to monitor the effectiveness of current genotyping methods and respond to changes associated with genetic drift and shift ; (ii) to describe in detail the molecular epidemi-ology of rotavirus infections in Europe, during con-secutive rotavirus seasons, through genotyping of rotavirus-positive samples collected throughout each country ; and (iii) to monitor the emergence and spread of common and novel rotavirus strains within Europe and develop the infrastructure that may serve as a platform for future surveillance activities and nested studies. These studies will be used to monitor the effectiveness of a rotavirus vaccine in the general population, through monitoring the reduction in dis-ease associated with common rotavirus types ; to detect the possible vaccine-induced emergence of anti-body escape mutants and the possible emergence in the general population of genotypes other than those included in the vaccine and reassortants between vaccine and naturally circulating wild-type strains.
M A T E R I A L S A N D M E T H O D S Samples
Hospitals, paediatricians and general medical practi-tioners that were willing to participate in the study over several years were identified in each of the participating countries in order to allow valid com-parisons to be made between each rotavirus season and within each member country. Faecal samples submitted for the routine laboratory investigation of infantile gastroenteritis and positive for group A rotavirus antigen were collected for genotyping. A total of 19 140 rotavirus-positive samples were genotyped between September 2006 and August 2009 in 15 European countries (Table 1).
Rotavirus genotyping
Rotavirus strains were characterized through geno-typing using standardized methods to identify their G- and P-types [Manual of rotavirus detection and characterization methods, WHO (http://www.who.int/ nuvi/rotavirus/WHO_IVB_08.17_eng.pdf); European
rotavirus detection and characterization methods v4 (http://www.eurorota.net/docs.php)] and following the algorithm described in Figure 1. Rotavirus sub-groups (VP6) and NSP4 genotypes were determined for uncommon or novel strains identified through G-and P-typing in order to identify possible zoonotic transmission [18, 19] (European rotavirus detection and characterization methods v4).
Epidemiological data
Epidemiological data including age, sex, geographical location, including postcode in some countries, setting (hospital or community, urban or rural), symptoms (diarrhoea, vomiting, or diarrhoea and vomiting, or other) and date of onset and date of sample collection were entered into a web-accessible database and linked to the genotyping data (http:// www.eurorota.net/).
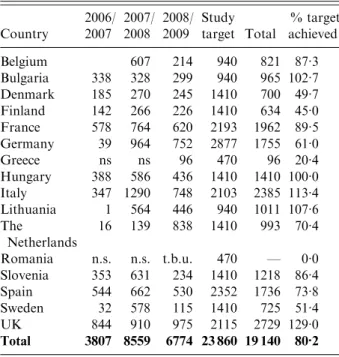
Table 1. Number of rotavirus strains in the EuroRotaNet database per country and rotavirus
season(includes data for September to August in each
of the three season from 2006 to 2009 ; entries for which date of sample collection was incomplete were
excluded) Country 2006/ 2007 2007/ 2008 2008/ 2009 Study target Total % target achieved Belgium 607 214 940 821 87.3 Bulgaria 338 328 299 940 965 102.7 Denmark 185 270 245 1410 700 49.7 Finland 142 266 226 1410 634 45.0 France 578 764 620 2193 1962 89.5 Germany 39 964 752 2877 1755 61.0 Greece ns ns 96 470 96 20.4 Hungary 388 586 436 1410 1410 100.0 Italy 347 1290 748 2103 2385 113.4 Lithuania 1 564 446 940 1011 107.6 The Netherlands 16 139 838 1410 993 70.4 Romania n.s. n.s. t.b.u. 470 — 0.0 Slovenia 353 631 234 1410 1218 86.4 Spain 544 662 530 2352 1736 73.8 Sweden 32 578 115 1410 725 51.4 UK 844 910 975 2115 2729 129.0 Total 3807 8559 6774 23 860 19 140 80.2
n.s., No sampling ; t.b.u., to be uploaded.
Belgium, Bulgaria and Lithuania joined the network in 2008, Greece and Romania in 2009. Only data uploaded up to 31 December 2009 is included in the analysis.
Faecal samples Epidemiology: Age, sex, geographical location, setting, date of collection
Group A rotavirus antigen detection
Negative Rotavirus positive
Nucleic acid extraction
Reverse transcription
G-typing PCR P-typing PCR
Common Uncommon Uncommon Common
VP7, VP4, sequencing
Results to database
Fig. 1. Algorithm describing the testing and reporting of rotavirus-positive samples. (b) (a) P erc ent 2000 1800 1600 1400 1200 1000 800 600 400 200 0 Number September October November December
January February March
April May June July
August
0·0
September
October
November December
January February March
April May June July
August 2006/07 2007/08 2008/09 2006/07 2007/08 2008/09 25·0 20·0 15·0 10·0 5·0
Fig. 2. Temporal distribution of rotavirus infections in the EuroRotaNet database in three consecutive seasons, 2006/2007, 2007/2008 and 2008/2009. (a) Numbers of strains each month in three consecutive seasons. (b) Percent of the total rotavirus strains in a season each month showing the moving-average trend analysis.
R E S U L T S
Temporal distribution
Rotavirus infections peak in the winter months in temperate climates, and the analysis of the
data in EuroRotaNet reflects this seasonality. The peak of rotavirus infections in Europe occurred in March in all three seasons between 2006 and 2009 (Fig. 2). The moving-average trend analysis in-dicated that rotavirus infections peaked in April in Table 2. Possible origins of rotavirus strains circulating within Europe. Common and reassortant human rotavirus strains, zoonotic strains and animal-human hybrid rotavirus strains are identified
2006/2007 2007/2008 2008/2009 Total
No. % No. % No. % No. %
Common human rotavirus genotypes
G1P[8] 1637 43.00 4532 52.95 3101 45.78 9270 48.43
G2P[4] 584 15.34 747 8.73 597 8.81 1928 10.07
G3P[8] 113 2.97 324 3.79 381 5.62 818 4.27
G4P[8] 282 7.41 1282 14.98 1318 19.46 2882 15.06
G9P[8] 768 20.17 900 10.52 544 8.03 2212 11.56
Reassortment among common human rotavirus genotypes
G1P[4] 11 0.29 30 0.35 15 0.22 56 0.29
G2P[8] 21 0.55 46 0.54 23 0.34 90 0.47
G3P[4] 1 0.03 1 0.01 5 0.07 7 0.04
G4P[4] 1 0.03 6 0.07 17 0.25 24 0.13
G9P[4] 4 0.11 16 0.19 16 0.24 36 0.19
Potential zoonotic rotavirus genotypes
G3P[3] 1 0.03 0 0.00 0 0.00 1 0.01 G3P[6] 0 0.00 0 0.00 9 0.13 9 0.05 G3P[9] 0 0.00 2 0.02 3 0.04 5 0.03 G6P[9] 4 0.11 3 0.04 1 0.01 8 0.04 G6P[14] 1 0.03 3 0.04 0 0.00 4 0.02 G8P[6] 4 0.11 1 0.01 1 0.01 6 0.03 G8P[14] 0 0.00 1 0.01 2 0.01 3 0.01 G9P[6] 5 0.13 0 0.00 4 0.06 9 0.05 G9P[9] 2 0.05 3 0.04 1 0.01 6 0.03 G9P[10] 0 0.00 1 0.01 1 0.01 2 0.01 G10P[14] 5 0.13 1 0.01 0 0.00 6 0.03 G12P[9] 0 0.00 4 0.05 4 0.06 8 0.04
Possible human-animal hybrid rotavirus genotypes
G1P[6] 0 0.00 0 0.00 4 0.06 4 0.02 G2P[6] 5 0.13 17 0.20 2 0.03 24 0.13 G2P[9] 1 0.03 1 0.01 0 0.00 2 0.01 G2P[10] 1 0.03 0 0.00 0 0.00 1 0.01 G4P[6] 5 0.13 0 0.00 3 0.04 8 0.04 G4P[9] 0 0.00 1 0.01 1 0.01 2 0.01 G4P[10] 0 0.00 0 0.00 1 0.01 1 0.01 G6P[4] 0 0.00 1 0.01 0 0.00 1 0.01 G6P[8] 0 0.00 2 0.02 0 0.00 2 0.01 G6P[11] 1 0.03 0 0.00 0 0.00 1 0.01 G8P[4] 0 0.00 3 0.04 63 0.93 66 0.34 G8P[8] 2 0.05 2 0.02 6 0.09 10 0.05 G10P[4] 1 0.03 2 0.02 0 0.00 3 0.02 G10P[6] 0 0.00 1 0.01 0 0.00 1 0.01 G10P[8] 0 0.00 6 0.07 15 0.22 21 0.11 G10P[10] 0 0.00 1 0.01 0 0.00 1 0.01 G12P[4] 0 0.00 0 0.00 3 0.04 3 0.02 G12P[6] 1 0.03 4 0.05 41 0.61 46 0.24 G12P[8] 21 0.55 46 0.54 52 0.77 119 0.62 Total 3482 91.46 7990 93.35 6234 92.03 17 706 92.51
2006/2007 and in March in 2007/2008 and 2008/2009 (Fig. 2).
Differences were observed across EuroRotaNet participating countries in the month in which rota-virus infections peaked. The earliest peaks of infection were detected in Spain in 2006/2007 and 2008/2009, in January and December, respectively, and in 2007/ 2008 infection peaked in February. Late season peaks were associated with countries in the East or North of Europe with infection peaking in Hungary in May 2007 and in Finland in May 2008 and 2009.
Genotype distribution Total dataset
The total number of rotavirus-positive samples in-cluded were 19 140 for the 3 years and inin-cluded 3807 in 2006/2007, 8559 in 2007/2008, and 6774 in 2008/ 2009. These numbers were used as denominators for calculating percentages. A total of 141 different com-binations of G- and P-types were found between 2006 and 2009 and included those with combinations either singly or as multiple infections of G1, G2, G3, G4,
G6, G8, G9, G10, G12 and P[3], P[4], P[6], P[8], P[9], P[10], P[11], P[14] genotypes (Table 2).
Common rotavirus strains
G1P[8] rotavirus strains were predominant in all three seasons between 2006 and 2009. Strains circulating
with a prevalence of>1% included G1P[8] (48.43%),
G4P[8] (15.06 %), G9P[8] (11.56 %), G2P[4] (10.07 %) and G3P[8] (4.27 %) (Table 2).
Possible origins of rotavirus strains
Rotavirus strains found circulating within the
European population between 2006 and 2009 can be stratified according to their possible origins. Human rotavirus strains are the most prevalent, making up 89.4 % of circulating strains. Strains whose derivation may be associated with reassortment between animal and human strains make up 1.7 % and reassortants of the common human strains make up 1.1 %. Infection with rotavirus strains of animal origin may represent 0.3 % of strains found (Table 2).
Table 3 (a). Co-infections with multiple rotavirus strains (single G-type with two or more P-types)
2006/2007 2007/2008 2008/2009 Total
No. % No. % No. % No. %
G1P[4]+P[8] 10 0.26 19 0.22 22 0.32 51 0.27 G2P[4]+P[8] 6 0.16 6 0.07 12 0.18 24 0.13 G9P[4]+P[8] 6 0.16 10 0.12 8 0.12 24 0.13 G9P[6]+P[8] 1 0.03 6 0.07 2 0.03 9 0.05 G4P[4]+P[8] 1 0.03 2 0.02 3 0.04 6 0.03 G3P[4]+P[8] 3 0.08 1 0.01 1 0.01 5 0.03 G8P[4]+P[6] 0 0.00 0 0.00 5 0.07 5 0.03 G1P[6]+P[8] 1 0.03 1 0.01 1 0.01 3 0.02 G10P[4]+P[8] 0 0.00 1 0.01 1 0.01 2 0.01 G12P[4]+P[8] 0 0.00 1 0.01 1 0.01 2 0.01 G1P[8]+P[10] 0 0.00 1 0.01 1 0.01 2 0.01 G2P[4]+P[6] 1 0.03 0 0.00 1 0.01 2 0.01 G2P[6]+P[8] 2 0.05 0 0.00 0 0.00 2 0.01 G8P[6]+P[8] 0 0.00 0 0.00 2 0.03 2 0.01 G12P[8]+P[9] 0 0.00 0 0.00 1 0.01 1 0.01 G12P[9]+P[11] 0 0.00 0 0.00 1 0.01 1 0.01 G1P[4]+P[6]+P[8] 0 0.00 1 0.01 0 0.00 1 0.01 G1P[8]+P[9] 0 0.00 1 0.01 0 0.00 1 0.01 G2P[4]+P[9] 1 0.03 0 0.00 0 0.00 1 0.01 G3P[4]+P[6] 0 0.00 0 0.00 1 0.01 1 0.01 G4P[4]+P[6] 0 0.00 0 0.00 1 0.01 1 0.01 G8P[4]+P[8] 0 0.00 0 0.00 1 0.01 1 0.01 G9P[8]+P[9] 1 0.03 0 0.00 0 0.00 1 0.01 Total 33 0.87 50 0.58 65 0.96 148 0.77
Mixed rotavirus infections
A total of 809 mixed rotavirus infections were detected between 2006 and 2009. These could be
classified as single G-type with two or more P-types (148, 0.8 %), multiple G-types with a single P-type (534, 2.8 %) or multiple G- and P-types (127, 0.7 %). These strains are representative of those genotypes Table 3 (b). Co-infections with multiple rotavirus strains (multiple G-types with a single P-type)
2006/2007 2007/2008 2008/2009 Total
No. % No. % No. % No. %
G1+G9P[8] 70 1.84 103 1.20 34 0.50 207 1.08 G1+G4P[8] 5 0.13 36 0.42 36 0.53 77 0.40 G1+G2P[4] 5 0.13 22 0.26 9 0.13 36 0.19 G4+G9P[8] 1 0.03 12 0.14 19 0.28 32 0.17 G3+G9P[8] 8 0.21 12 0.14 10 0.15 30 0.16 G1+G3P[8] 5 0.13 10 0.12 7 0.10 22 0.11 G1+G2P[8] 9 0.24 4 0.05 2 0.03 15 0.08 G1+G10P[8] 0 0.00 9 0.11 2 0.03 11 0.06 G1+G12P[8] 2 0.05 2 0.02 5 0.07 9 0.05 G2+G4P[8] 4 0.11 0 0.00 5 0.07 9 0.05 G1+G2+G9P[8] 8 0.21 0 0.00 0 0.00 8 0.04 G2+G4P[4] 0 0.00 3 0.04 5 0.07 8 0.04 G2+G9P[4] 4 0.11 2 0.02 2 0.03 8 0.04 G3+G8P[8] 0 0.00 0 0.00 6 0.09 6 0.03 G9+G12P[8] 0 0.00 1 0.01 4 0.06 5 0.03 G2+G9P[8] 3 0.08 0 0.00 1 0.01 4 0.02 G3+G4P[8] 1 0.03 0 0.00 3 0.04 4 0.02 G1+G3+G9P[8] 3 0.08 0 0.00 0 0.00 3 0.02 G1+G9P[4] 2 0.05 1 0.01 0 0.00 3 0.02 G4+G12P[8] 0 0.00 2 0.02 1 0.01 3 0.02 G1+G4+G9P[8] 1 0.03 1 0.01 0 0.00 2 0.01 G1+G9P[6] 1 0.03 0 0.00 1 0.01 2 0.01 G2+G12P[4] 0 0.00 0 0.00 2 0.03 2 0.01 G2+G3P[4] 0 0.00 0 0.00 2 0.03 2 0.01 G3+G9+G12P[8] 0 0.00 2 0.02 0 0.00 2 0.01 G4+G8P[4] 0 0.00 0 0.00 2 0.03 2 0.01 G9+G10P[8] 0 0.00 0 0.00 2 0.03 2 0.01 G1+G12P[4] 0 0.00 0 0.00 1 0.01 1 0.01 G1+G12P[6] 1 0.03 0 0.00 0 0.00 1 0.01 G1+G2+G3P[8] 1 0.03 0 0.00 0 0.00 1 0.01 G1+G2+G4P[8] 0 0.00 0 0.00 1 0.01 1 0.01 G1+G2+G9P[4] 1 0.03 0 0.00 0 0.00 1 0.01 G1+G6P[9] 0 0.00 1 0.01 0 0.00 1 0.01 G1+G8+G12P[8] 0 0.00 0 0.00 1 0.01 1 0.01 G1+G8P[4] 0 0.00 0 0.00 1 0.01 1 0.01 G1+G8P[8] 0 0.00 0 0.00 1 0.01 1 0.01 G10+G12P[6] 0 0.00 0 0.00 1 0.01 1 0.01 G2+G10P[4] 0 0.00 1 0.01 0 0.00 1 0.01 G2+G9P[6] 0 0.00 1 0.01 0 0.00 1 0.01 G3+G10P[8] 0 0.00 1 0.01 0 0.00 1 0.01 G3+G8P[8] 0 0.00 1 0.01 0 0.00 1 0.01 G3+G9P[4] 0 0.00 1 0.01 0 0.00 1 0.01 G3+G9P[6] 0 0.00 1 0.01 0 0.00 1 0.01 G3+G9P[9] 1 0.03 0 0.00 0 0.00 1 0.01 G4+G10P[8] 0 0.00 0 0.00 1 0.01 1 0.01 G8+G12P[4] 0 0.00 0 0.00 1 0.01 1 0.01 G9+G3P[6] 0 0.00 1 0.01 0 0.00 1 0.01 Total 136 3.57 230 2.69 168 2.48 534 2.79
seen in single infections and include mixtures of human and of animal rotavirus strains (Table 3 a–c).
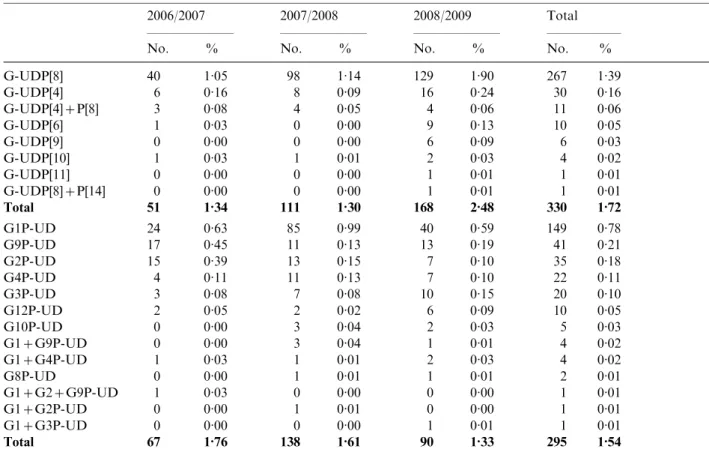
Partially typed rotavirus strains
A total of 625 strains were partially typed, in 330 (1.72 %) and 295 (1.54 %) strains, only the P-type or G-type, respectively, was obtained (Table 4).
Emerging rotavirus strains
Rotavirus strains emerging in Europe between 2006 and 2009 included G12 and G8 strains (Table 5). These genotypes were found circulating in each of the
three seasons and both G12 (x2=22.83, P<0.0001)
and G8 (x2=69.66, P<0.0001) showed significant
increases in the third season.
Changing molecular epidemiology
G1P[8] strains were most prevalent in the 2007/2008 season with the exception of Lithuania where only 5.5 % of strains were of this genotype. Over the three seasons, and in the majority of countries, the number of G1P[8] strains rose in the second season and fell in the third. The highest incidences of infection with G2P[4] strains in any season were in Belgium, Bulgaria and Greece where this genotype was found
in >30% of the strains. In season 1, G2P[4] was
the most prevalent strain in Bulgaria and in seasons 1 and 2 in Belgium. In the majority of countries, this
genotype accounted for <20% of strains in any
season. G3P[8] accounted for <20% of strains in
all countries in any season. This strain was not found in the first season in Bulgaria, Italy or Hungary, in the second in Slovenia and in the third in Bulgaria Table 3 (c). Co-infections with multiple rotavirus strains (multiple G- and P-types)
2006/2007 2007/2008 2008/2009 Total
No. % No. % No. % No. %
G1+G2P[4]+P[8] 14 0.37 18 0.21 10 0.15 42 0.22 G2+G9P[4]+P[8] 7 0.18 9 0.11 6 0.09 22 0.11 G2+G4P[4]+P[8] 0 0.00 2 0.02 6 0.09 8 0.04 G1+G2+G9P[4]+P[8] 5 0.13 1 0.01 1 0.01 7 0.04 G1+G9P[4]+P[8] 3 0.08 3 0.04 1 0.01 7 0.04 G2+G3P[4]+P[8] 2 0.05 0 0.00 4 0.06 6 0.03 G1+G4P[4]+P[8] 0 0.00 0 0.00 5 0.07 5 0.03 G1+G9P[6]+P[8] 3 0.08 0 0.00 0 0.00 3 0.02 G4+G9P[4]+P[8] 0 0.00 0 0.00 3 0.04 3 0.02 G1+G2P[4]+P[6] 0 0.00 1 0.01 1 0.01 2 0.01 G1+G3P[4]+P[8] 0 0.00 1 0.01 1 0.01 2 0.01 G2+G12P[4]+P[8] 1 0.03 1 0.01 0 0.00 2 0.01 G8+G12P[6]+P[8] 0 0.00 0 0.00 2 0.03 2 0.01 G1+G2+G12P[4]+P[8] 0 0.00 0 0.00 1 0.01 1 0.01 G1+G2+G3P[4]+P[8] 1 0.03 0 0.00 0 0.00 1 0.01 G1+G2+G4P[4]+P[8] 0 0.00 0 0.00 1 0.01 1 0.01 G1+G2+G4P[8]+P[10] 0 0.00 0 0.00 1 0.01 1 0.01 G1+G3P[6]+P[8] 0 0.00 1 0.01 0 0.00 1 0.01 G1+G9P[8]+P[9] 0 0.00 0 0.00 1 0.01 1 0.01 G2+G12P[6]+P[8] 0 0.00 0 0.00 1 0.01 1 0.01 G2+G4P[6]+P[8] 0 0.00 0 0.00 1 0.01 1 0.01 G2+G9P[4]+P[6] 0 0.00 0 0.00 1 0.01 1 0.01 G3+G4+G9P[8]+P[9] 0 0.00 1 0.01 0 0.00 1 0.01 G3+G4P[4]+P[8] 0 0.00 1 0.01 0 0.00 1 0.01 G3+G9P[4]+P[8] 1 0.03 0 0.00 0 0.00 1 0.01 G4+G12P[4]+P[8] 0 0.00 0 0.00 1 0.01 1 0.01 G8+G12P[4]+P[6] 0 0.00 0 0.00 1 0.01 1 0.01 G9+G12P[4]+P[8] 0 0.00 1 0.01 0 0.00 1 0.01 G9+G12P[8]+P[9] 1 0.03 0 0.00 0 0.00 1 0.01 Total 38 1.00 40 0.47 49 0.72 127 0.66
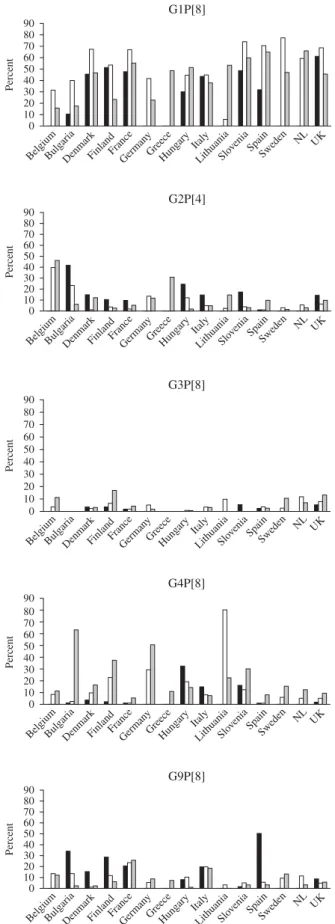
and Greece. The prevalence of G4P[8] strains was
80 % in Lithuania in 2007/2008 and >40% in
Bulgaria and Germany in 2008/2009, and was found in all countries in the third season (2008/2009). G9P[8] strains were the most common strain found in Spain in the first season (2006/2007), and the second most common in Bulgaria, France, Italy and Finland (Fig. 3).
G12 rotavirus strains were found to be circulating
with an incidence of>1% in nine countries including
Finland (6.8 %), Denmark (3.2 %), Lithuania (2.4 %), Hungary (2.3 %), Greece (1.6 %), The Netherlands (1.8 %), Germany (1.7 %), UK (1.5 %) and Bulgaria (1.2 %). With the exception of Sweden, G12 strains were found in all other countries. G12 strains were found in each of the three seasons in Denmark, Hungary, UK, Bulgaria, Italy and France.
G8 strains were found in two countries in the 2006/2007 season, in seven countries in the 2007/ 2008 season and in nine countries in the 2008/2009 season, with the highest incidence overall seen in
UK (2.1 %). The incidence was <1% in all other
countries (Belgium, Bulgaria, Denmark, France, Germany, Greece, Italy, Lithuania, Spain, Sweden, The Netherlands).
Demographic data Age distribution
Infection peaked in children aged 1–2 years, but was seen in all age groups (Fig. 4 a). Minor peaks, possibly associated with contact with infected children or grandchildren and waning immunity in the elderly population could also be seen (Fig. 4 b).
Distribution according to hospital or community setting For those cases for whom the setting was provided, 62.4 % of samples were collected from hospitalized patients and 37.6 % from patients in the community. With the exception of G2P[4] strains there were no significant differences in the distribution of common or emerging genotypes between hospital patients and those in the community (Table 6 a). G2P[4] was
significantly associated (x2=22.98, P<0.0001) with
hospitalized patients and may be associated with the periodic upsurge of G2P[4] strains, possibly associ-ated with the selection of an antibody escape mutant. Infection can often require hospitalization as symp-toms may be severe in the absence of cross-reactive antibodies associated with previous infections (see Age distribution section above).
Table 4. Partially typed rotavirus strains
2006/2007 2007/2008 2008/2009 Total
No. % No. % No. % No. %
G-UDP[8] 40 1.05 98 1.14 129 1.90 267 1.39 G-UDP[4] 6 0.16 8 0.09 16 0.24 30 0.16 G-UDP[4]+P[8] 3 0.08 4 0.05 4 0.06 11 0.06 G-UDP[6] 1 0.03 0 0.00 9 0.13 10 0.05 G-UDP[9] 0 0.00 0 0.00 6 0.09 6 0.03 G-UDP[10] 1 0.03 1 0.01 2 0.03 4 0.02 G-UDP[11] 0 0.00 0 0.00 1 0.01 1 0.01 G-UDP[8]+P[14] 0 0.00 0 0.00 1 0.01 1 0.01 Total 51 1.34 111 1.30 168 2.48 330 1.72 G1P-UD 24 0.63 85 0.99 40 0.59 149 0.78 G9P-UD 17 0.45 11 0.13 13 0.19 41 0.21 G2P-UD 15 0.39 13 0.15 7 0.10 35 0.18 G4P-UD 4 0.11 11 0.13 7 0.10 22 0.11 G3P-UD 3 0.08 7 0.08 10 0.15 20 0.10 G12P-UD 2 0.05 2 0.02 6 0.09 10 0.05 G10P-UD 0 0.00 3 0.04 2 0.03 5 0.03 G1+G9P-UD 0 0.00 3 0.04 1 0.01 4 0.02 G1+G4P-UD 1 0.03 1 0.01 2 0.03 4 0.02 G8P-UD 0 0.00 1 0.01 1 0.01 2 0.01 G1+G2+G9P-UD 1 0.03 0 0.00 0 0.00 1 0.01 G1+G2P-UD 0 0.00 1 0.01 0 0.00 1 0.01 G1+G3P-UD 0 0.00 0 0.00 1 0.01 1 0.01 Total 67 1.76 138 1.61 90 1.33 295 1.54
Distribution according to rural or urban setting For those patients for whom the setting was pro-vided, 89.7 % samples were collected from urban populations and 10.2 % from rural populations.
The percentages of the European population living in urban and rural areas are estimated to be 73.1% and 26.9%, respectively (www.cap-lmu.de/fgz/
statistics/urban_pop.php). G1P[8] strains (x2=19.88,
P<0.0001) were found significantly more often in Table 5. Distribution of possible emerging strains between 2006 and 2009 as single strain infections or contributing to multiple strain infections
2006/2007 2007/2008 2008/2009 Total
No. % No. % No. % No. %
G12P[8] 21 0.55 46 0.54 52 0.77 119 0.62 G12P[6] 1 0.03 4 0.05 41 0.61 46 0.24 G12P-UD 2 0.05 2 0.02 6 0.09 10 0.05 G1+G12P[8] 2 0.05 2 0.02 5 0.07 9 0.05 G12P[9] 0 0.00 4 0.05 4 0.06 8 0.04 G9+G12P[8] 0 0.00 1 0.01 4 0.06 5 0.03 G12P[4] 0 0.00 0 0.00 3 0.04 3 0.02 G4+G12P[8] 0 0.00 2 0.02 1 0.01 3 0.02 G3+G9+G12P[8] 0 0.00 2 0.02 0 0.00 2 0.01 G2+G12P[4] 0 0.00 0 0.00 2 0.03 2 0.01 G12P[4]+P[8] 0 0.00 1 0.01 1 0.01 2 0.01 G2+G12P[4]+P[8] 1 0.03 1 0.01 0 0.00 2 0.01 G8+G12P[6]+P[8] 0 0.00 0 0.00 2 0.03 2 0.01 G1+G12P[6] 1 0.03 0 0.00 0 0.00 1 0.01 G1+G12P[4] 0 0.00 0 0.00 1 0.01 1 0.01 G1+G8+G12P[8] 0 0.00 0 0.00 1 0.01 1 0.01 G8+G12P[4] 0 0.00 0 0.00 1 0.01 1 0.01 G12P[8]+P[9] 0 0.00 0 0.00 1 0.01 1 0.01 G12P[9]+P[11] 0 0.00 0 0.00 1 0.01 1 0.01 G1+G2+G12P[4]+P[8] 0 0.00 0 0.00 1 0.01 1 0.01 G2+G12P[6]+P[8] 0 0.00 0 0.00 1 0.01 1 0.01 G4+G12P[4]+P[8] 0 0.00 0 0.00 1 0.01 1 0.01 G9+G12P[4]+P[8] 0 0.00 1 0.01 0 0.00 1 0.01 G8+G12P[4]+P[6] 0 0.00 0 0.00 1 0.01 1 0.01 G9+G12P[8]+P[9] 1 0.03 0 0.00 0 0.00 1 0.01 G10+G12P[6] 0 0.00 0 0.00 1 0.01 1 0.01 Total G12 29 0.76 66 0.77 132 1.95 227 1.19 G8P[4] 0 0.00 3 0.04 63 0.93 66 0.34 G8P[8] 2 0.05 2 0.02 6 0.09 10 0.05 G8P[6] 4 0.11 1 0.01 1 0.01 6 0.03 G8P[14] 0 0.00 1 0.01 2 0.01 3 0.01 G3+G8P[8] 0 0.00 0 0.00 6 0.09 6 0.03 G4+G8P[4] 0 0.00 0 0.00 2 0.03 2 0.01 G1+G8+G12P[8] 0 0.00 0 0.00 1 0.01 1 0.01 G1+G8P[4] 0 0.00 0 0.00 1 0.01 1 0.01 G1+G8P[8] 0 0.00 0 0.00 1 0.01 1 0.01 G3+G8P[8] 0 0.00 1 0.01 0 0.00 1 0.01 G8+G12P[4] 0 0.00 0 0.00 1 0.01 1 0.01 G8P[4]+P[6] 0 0.00 0 0.00 5 0.07 5 0.03 G8P[6]+P[8] 0 0.00 0 0.00 2 0.03 2 0.01 G8P[4]+P[8] 0 0.00 0 0.00 1 0.01 1 0.01 G8+G12P[6]+P[8] 0 0.00 0 0.00 2 0.03 2 0.01 G8+G12P[4]+P[6] 0 0.00 0 0.00 1 0.01 1 0.01 G8P-UD 0 0.00 1 0.01 1 0.01 2 0.01 Total G8 6 0.16 9 0.11 95 1.40 110 0.57
rural populations, whereas G2P[4] (x2=8.07, P<
0.005) and G9P[8] (x2=19.62, P<0.0001) were found
more commonly in urban populations (Table 6 b). The increased incidence of G9P[8] and G2P[4] strains in the urban population may reflect the recent intro-duction of either an antibody escape mutant, such as seen previously with G2P[4], or an animal human re-assortant, such as G9P[8]. The decreased incidence of G1P[8] in the urban population may be a result of the increased activity of G2P[4] and G9P[8] resulting in fewer susceptible individuals.
Distribution according to gender
For those subjects for whom gender was provided, 54.7 % were male and 45.3 % were female, which re-flects the European birth cohort male : female ratio of 1.21 : 1. No significant differences in the distribution of common or emerging rotavirus strains were found between males and females (Table 6 c).
D I S C U S S I O N
EuroRotaNet, was established in order to determine the diversity of co-circulating rotavirus strains in Europe over three or more rotavirus seasons from 2006/2007. Initially, 11 countries participated in the network and this had expanded to 16 countries by the 2008/2009 season. For analytical purposes, limited epidemiological data including age, sex, symptoms, date of onset, date of sample collection, country, re-gion and settings, including hospital or community and rural or urban were collected.
The data on seasonality confirm the previously re-ported trend that rotavirus infections spread in Europe from South to North and West to East. This is similar to that observed in North America [20].
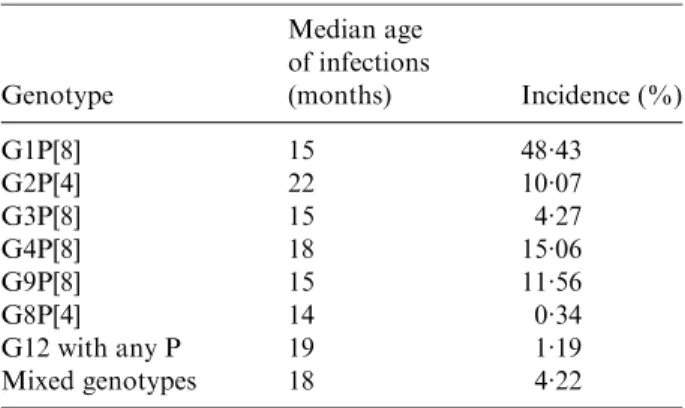
It might be expected that genotypes with a rela-tively low incidence are at a disadvantage in terms of transmission opportunities, and this is likely to be reflected by an increase in infections in older children. Data from Table 7, with the exception of G2P[4], do not support this, and the rationale for common strains such as G1P[8] and uncommon strains such as G8P[4] to significantly infect children between ages 14 and 15 months, is unexplained. The significant peak of infection in older children associated with G2P[4] may reflect poor cross-protection generated through previous infections with other common human rota-virus strains. Interestingly, this may reflect a repli-cative disadvantage of this strain in a mixture of 90 80 70 60 50 40 30 20 10 0 Percent
BelgiumBulgariaDenmarkFinlandFranceGerman y
Greece Hungary
Italy
LithuaniaSlovenia SpainSweden NL UK G1P[8] 90 80 70 60 50 40 30 20 10 0 Percent
BelgiumBulgariaDenmarkFinlandFranceGerman y Greece Hungary Italy LithuaniaSlo venia Spain Sweden NL UK G2P[4] 90 80 70 60 50 40 30 20 10 0 Percent
BelgiumBulgariaDenmarkFinlandFranceGerman y Greece Hungary Italy LithuaniaSlo venia Spain Sweden NL UK G4P[8] 90 80 70 60 50 40 30 20 10 0 Percent
BelgiumBulgariaDenmarkFinlandFranceGerman y
Greece Hungary
Italy
LithuaniaSlovenia SpainSweden NL UK G9P[8] 90 80 70 60 50 40 30 20 10 0 Percent
BelgiumBulgariaDenmarkFinlandFranceGerman
y Greece Hungary Italy LithuaniaSlo venia Spain Sweden NL UK G3P[8]
Fig. 3. Changing strain distribution in seasons and countries
between 2006 and 2009. &, 2006/2007 ; %, 2007/2008 ; ,
predominantly fit viruses infecting an immuno-logically naive child. This taken with the development of immunological protection against the commonly circulating strains at a young age increases the prob-ability that any new infection in an older child is likely to be with a less common, possibly less fit strain, such as G2P[4].
This report highlights the tremendous diversity of rotavirus strains co-circulating in the European population and points to the many origins of these strains including genetic reassortment and inter-species transmission. Mixed infections and zoonotic introductions are common, but many will lead to evolutionary dead-ends with only those virus strains demonstrating fitness for transmission within the human population emerging to become significant human pathogens.
The G- or P-types associated with partially typed strains were representative of those genotypes seen in fully characterized strains. Therefore, failure to type
is most likely to be associated with technical issues and/or low viral load, although occasionally they may represent usual genotypes, particularly in those associated with an animal rotavirus G- or P- types [21–26]. The failure to identify G-types associated with P[6], P[9], P[10], P[11] and P[14] may be associ-ated with the presence of unusual G-types for which G genotype-specific primers were not included in the study protocol. Similarly, the inability to determine the P-type of strains with G12 or G10 may be due to a lack of P genotype-specific primers. Interestingly, other strains associated with these G- or P-types were fully characterized during the study.
With the ability of the network to identify strains circulating with an incidence of 1 %, possible emerg-ing strains such as G8 and G12 have been identified during the first 3 years of the study and the analysis of recent data indicates their increased incidence.
G12P[6] and G12P[14] are likely to represent zoo-notic spread into the human population, whereas,
40·00 35·00 30·00 25·00 20·00 15·00 10·00 5·00 0·00 16·0 14·0 12·0 10·0 8·0 6·0 4·0 2·0 0·0 Percent Percent 6 10 14 18 22 26 30 34 38 42 46 50 54 58 62 66 70 74 78 82 86 90 94 98102 1 0–5 mo. 3 5 11–15 21–25 31–35 41–45 51–55 61–65 71–75 81–85 91–95 >100
Age goup (years)
Age (years) (a)
(b)
Fig. 4. Age distribution. (a) Rotavirus infections by age group in all countries (n=17 510). (b) Rotavirus infections from ages 6 to>100 years (n=1283).
G12P[4] and G12P[8] are more likely to be the result of reassortment in human and animal strains. The plethora of mixtures of rotaviruses containing G12 strains may suggest environmental or food-/water-borne transmission events. Mixtures can also be seen to contain potential zoonotic strains other than
G12 such as G8, G10, P[6], P[9] and P[11] and so may represent an environmental reservoir of rota-virus strains associated with a mixture of potentially contaminating human and animal faeces. Similarly, G8P[14] and G8P[6] may be zoonotic, whereas, G8P[4] and G8P[8] may result from reassortment of an animal strain carrying G8, with human strains. Twenty-four mixtures made up of 12 different com-binations of G- and/or P-types were found, suggesting infection in some instances through contact with a mixture of human and animal strains.
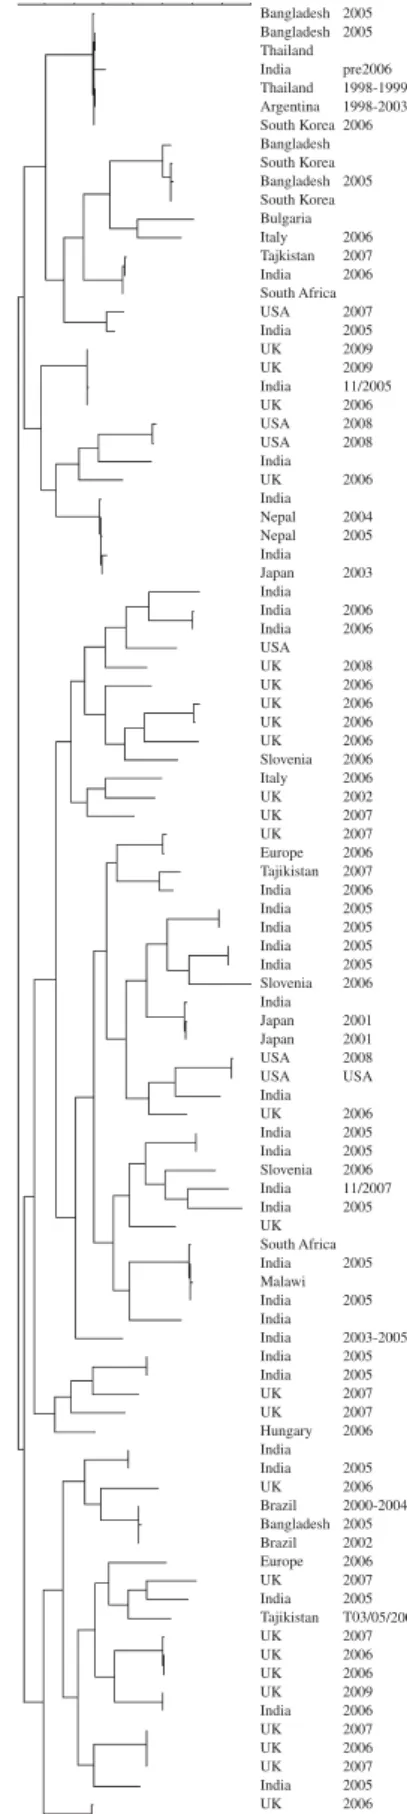
The genes encoding VP7 of the G8 strains from the UK were sequenced. The temporal and geographical distribution and diversity of G8 strains seen before 2009 may suggest multiple zoonotic introductions [13, 27–33] whereas the similarity of the strains de-scribed in the current paper is likely to be the result of sustained person-to-person transmission of a strain adapted to the human host (Fig. 5). Interestingly, when G12 strains from UK, Hungary and Bulgaria were sequenced, detailed phylogenetic analysis in-dicated multiple, unrelated, introductions and may represent a series of evolutionary dead-ends associ-ated with an inability of these strains to sustain human-to-human transmission (Fig. 6). It is reason-able to suggest that because of the frequent intro-ductions of G12 strains into the human population it may be only a matter of time before a reassortment event provides a G12 animal/human hybrid strain of comparable fitness to those current stains circulating commonly in the human population.
The introduction of universal rotavirus vaccination in at least two of the participating countries, and partial vaccine coverage in some others may provide data on diversity driven by vaccine introduction and possible strain replacement. Discussions on changes to the current EuroRotaNet surveillance protocols in Table 6. Distribution of common and emerging
rotavirus genotypes. The total number of strains shown refers to the total number of rotavirus strains in each of the settings/gender groups, and includes mixed infections and human rotavirus reassortant
strains(not shown in the table breakdown)
(a) Hospitalized and community cases
Genotype Hospital Community
No. % No. % G1P[8] 5008 48.24 2900 46.27 G2P[4] 1106 10.65 524 8.36 G3P[8] 383 3.69 336 5.36 G4P[8] 1673 16.11 924 14.74 G9P[8] 1228 11.83 801 12.78 G12 with any 137 1.32 77 1.23 G8 with any 66 0.64 42 0.67 Total typed 10 382 6267
(b) Urban and rural settings
Genotype Urban Rural
No. % No. % G1P[8] 2677 39.13 371 47.44 G2P[4] 976 14.26 82 10.49 G3P[8] 231 3.38 29 3.71 G4P[8] 1258 18.39 168 21.48 G9P[8] 792 11.58 49 6.27 G12 with any 101 1.48 11 1.41 G8 with any 24 0.35 5 0.64 Total typed 6842 782
(c) Males and females
Genotype Male Female
No. % No. % G1P[8] 4529 47.63 3710 47.17 G2P[4] 953 10.02 809 10.29 G3P[8] 412 4.33 336 4.27 G4P[8] 1473 15.49 1286 16.35 G9P[8] 1142 12.01 933 11.86 G12 with any 95 1.00 107 1.36 G8 with any 56 0.59 44 0.56 Total typed 9508 7865
Table 7. Median age of infection compared with overall incidence by genotype
Genotype Median age of infections (months) Incidence (%) G1P[8] 15 48.43 G2P[4] 22 10.07 G3P[8] 15 4.27 G4P[8] 18 15.06 G9P[8] 15 11.56 G8P[4] 14 0.34 G12 with any P 19 1.19 Mixed genotypes 18 4.22
light of rotavirus vaccine introduction will be held during the course of the next two seasons and will involve participants, funders and the European Centre for Diseases Control (ECDC). In light of these developments, it should now be possible for
Conservati on am on g recent G8 st rains from 2008/09 Di versity demons trated by mu lti p le zoonoti c introduct ions 84 86 88 90 92 94 96 93 100 VP7 Bovine Bovine Bovine Bovine Bovine Bovine Simian Simian Porcine Human Human Human Human Human Human Human Human Human Human Human Human Human Human Human Human Human Human Human Human Human Human Human Human Human Human Human Human Human Human Human Human Human Human Human Human Human Human Human Human Human Human Human Human Human Human Human Human Human Human Human Human Human Human Human Human Human Human Human Human Human USA Japan Japan USA UK Thailand USA Kenya Argentina Switzerland Italy UK Indonesia Australia Australia Australia Australia Finland India Tajikistan Egypt Vellore Egypt South Africa South Africa Malawi Congo Malawi Nigeria Cameroon Cameroon Cameroon Cameroon Slovenia Ethiopia Tunisia Cameroon Cameroon Ivory Coast Tunisia UK UK UK UK UK UK UK UK UK UK UK UK UK UK UK UK UK UK UK UK UK UK UK UK UK UK UK UK UK UK 1993 1995 1998 1993 1994 1990 2004 1999 2007 1996 2004 1990 1980 1989 1999 1999 1996 1993 1998 2007 1998 1998 1993 1987 1998 2005 1998 1995 2000 2000 2000 2000 2006 2004 2002 2000 2000 2004 2000 2009 2009 2009 2009 2009 2009 2009 2009 2009 2009 2009 2009 2009 2009 2009 2009 2009 2009 2009 2009 2009 2009 2009 2009 2009 2009 2009 2009 2009 2009
Fig. 5. Dendrogram (Neighbour Joining) of sequences of the gene encoding VP7 of G8 strains. Host, country and year of identification are indicated after each strain.
Bangladesh Bangladesh Bangladesh Bangladesh Thailand Thailand Argentina South Korea South Korea South Africa South Africa USA USA USA Bulgaria Italy Tajkistan India India India India India India India India India USA UK UK UK UK UK Slovenia Italy UK UK UK Europe Tajikistan India India India India India Slovenia Slovenia India India India India India India India India India India India India India India India India India Tajikistan UK UK UK UK UK UK UK UK UK UK UK UK UK Brazil Brazil Europe Bangladesh Hungary Malawi UK UK Japan Japan USA USA Japan Nepal Nepal UK UK UK UK South Korea India 2005 2005 2005 1998-1999 1998-2003 2006 2007 2008 2008 2006 2007 2006 2005 11/2005 2006 2006 2008 2006 2006 2006 2006 2006 2006 2002 2007 2007 2006 2007 2006 2005 2005 2005 2005 2006 2006 2005 2005 11/2007 2005 2005 2005 2003-2005 2005 2005 2005 2005 2006 2005 T03/05/2007 2007 2007 2006 2007 2007 2006 2006 2009 2007 2006 2007 2006 2000-2004 2002 2006 2005 2006 2006 2001 2001 2008 USA 2003 2004 2005 2006 2009 2006 2009 pre2006 VP7
Fig. 6. Dendrogram (Maximum Parsimony) of sequences of the gene encoding VP7 of G12 strains. Strains included are global and represent introductions between 1991 and 2009.
EuroRotaNet, with others, to evolve into a network capable of performing detailed rotavirus surveillance activities. These activities would provide data on the effectiveness of rotavirus vaccination programmes and the impact of these programmes on the virus popu-lations co-circulating in Europe, and the changing patterns of infections by age, season, setting, etc.
D E C L A R A T I O N O F I N T E R E S T
EuroRotaNet receives funding from GSK and SPMSD in equal parts through a non-restrictive col-laborative grant.
R E F E R E N C E S
1. Parashar UD, et al. Rotavirus and severe childhood diarrhea. Emerging Infectious Diseases 2006 ; 12 : 304– 306.
2. Parashar UD, et al. Global illness and deaths caused by rotavirus disease in children. Emerging Infectious Diseases2003 ; 9 : 565–572.
3. Greenberg HB, et al. Serological analysis of the sub-group protein of rotavirus, using monoclonal anti-bodies. Infection and Immunity 1983 ; 39 : 91–99. 4. Iturriza Gomara M, et al. Molecular characterization
of VP6 genes of human rotavirus isolates : correlation of genogroups with subgroups and evidence of inde-pendent segregation. Journal of Virology 2002 ; 76 : 6596–6601.
5. Abe M, et al. Molecular epidemiology of rotaviruses among healthy calves in Japan : isolation of a novel bovine rotavirus bearing new P and G genotypes. Virus
Research2009 ; 144 : 250–257.
6. Matthijnssens J, et al. Recommendations for the classification of group A rotaviruses using all 11 geno-mic RNA segments. Archives of Virology 2008 ; 153 : 1621–1629.
7. Schumann T, et al. Evidence of interspecies transmission and reassortment among avian group A rotaviruses. Virology2009 ; 386 : 334–343.
8. Solberg OD, et al. Characterization of novel VP7, VP4, and VP6 genotypes of a previously untypeable group A rotavirus. Virology 2009 ; 385 : 58–67.
9. Ursu K, et al. Molecular analysis of the VP7 gene of pheasant rotaviruses identifies a new genotype, desig-nated G23. Archives of Virology 2009 ; 154 : 1365–1369. 10. Garbarg-Chenon A, Bricout F, Nicolas J. Study of gen-etic reassortment between two human rotaviruses. Virology1984 ; 139 : 358–365.
11. Gombold JL, Ramig RF. Analysis of reassortment of genome segments in mice mixedly infected with rota-viruses SA11 and RRV. Journal of Virology 1986 ; 57 : 110–116.
12. Unicomb LE, et al. Evidence of high-frequency genomic reassortment of group A rotavirus strains in
Bangladesh : emergence of type G9 in 1995. Jounal of
Clinical Microbiology1999 ; 37 : 1885–1891.
13. Esona MD, et al. Genomic characterization of hu-man rotavirus G8 strains from the African rotavirus network : relationship to animal rotaviruses. Journal of
Medical Virology2009 ; 81 : 937–951.
14. Iturriza-Gomara M, Desselberger U, Gray J. Molecular epidemiology of rotaviruses : genetic mechanisms as-sociated with diversity. In : Desselberger U, Gray J, eds. Viral Gastroenteritis. Amsterdam : Elsevier, 2003, pp. 317–344.
15. McDonald SM, et al. Evolutionary dynamics of human rotaviruses : balancing reassortment with preferred genome constellations. PLoS Pathogogy 2009 ; 5 : e1000634.
16. Matthijnssens J, et al. Simian rotaviruses possess divergent gene constellations that originated from in-terspecies transmission and reassortment. Journal of
Virology2010 ; 84 : 2013–2026.
17. Iturriza-Gomara M, et al. Rotavirus surveillance in europe, 2005–2008 : web-enabled reporting and real-time analysis of genotyping and epidemiological data.
Journal of Infectious Diseases 2009 ; 200 (Suppl. 1) :
S215–221.
18. Iturriza-Gomara M, et al. Evidence for genetic linkage between the gene segments encoding NSP4 and VP6 proteins in common and reassortant human rotavirus strains. Journal of Clinical Microbiology 2003 ; 41 : 3566–3573.
19. Iturriza-Go´mara M, et al. Reassortment in vivo : driving force for diversity of human rotavirus strains isolated in the United Kingdom between 1995 and 1999. Journal of
Virology2001 ; 75 : 3696–3705.
20. Turcios RM, et al. Temporal and geographic trends of rotavirus activity in the United States, 1997–2004. Pediatric Infectious Diseases Journal2006 ; 25 : 451–454. 21. Iturriza Gomara M, et al. Characterization of G10P[11] rotaviruses causing acute gastroenteritis in neonates and infants in Vellore, India. Journal of Clinical
Microbiology2004 ; 42 : 2541–2547.
22. Iturriza-Go´mara M, et al. Diversity within the VP4 gene of rotavirus P[8] strains : implications for reverse transcription-PCR genotyping. Journal of Clinical
Microbiology2000 ; 38 : 898–901.
23. Iturriza-Gomara M, Kang G, Gray JJ. Rotavirus genotyping : keeping up with an evolving population of human rotaviruses. Journal of Medical Virology 2004 ; 31 : 259–265.
24. Simmonds MK, et al. New oligonucleotide primers for P-typing of rotavirus strains : Strategies for typing pre-viously untypeable strains. Journal of Clinical Virology 2008 ; 42 : 368–373.
25. Adah MI RA, Olaleyle, Werchau H. Nigerian rotavirus serotypoe G8 could not be typed by PCR due to
nu-cleotide mutation at the 3k end of the primer site.
Archives of Virology1997 ; 142 : 1881–1887.
26. Iturriza Go´mara M, et al. Amino acid substitution within the VP7 protein of G2 rotavirus strains as-sociated with failure to serotype. Journal of Clinical
27. Alfieri AF, et al. G and P genotypes of group A rota-virus strains circulating in calves in Brazil, 1996–1999.
Veterinary Microbiology2004 ; 99 : 167–173.
28. Browning GF, et al. Human and bovine serotype G8 rotaviruses may be derived by reassortment. Archives of Virology1992 ; 125 : 121–128.
29. Cunliffe NA, et al. Molecular and serologic character-ization of novel serotype G8 human rotavirus strains detected in Blantyre, Malawi. Virology 2000 ; 274 : 309–320.
30. Fischer TK, et al. Characterization of
incom-pletely typed rotavirus strains from Guinea-Bissau :
identification of G8 and G9 types and a high frequency of mixed infections. Virology 2003 ; 311 : 125–133. 31. Holmes JL, et al. Characterization of unusual G8
rotavirus strains isolated from Egyptian children. Epidemiology and Infection1999 ; 123 : 9–16.
32. Salu OB, et al. Molecular epidemiology of rotaviruses in Nigeria : detection of unusual strains with G2P[6] and G8P[1] specificities. Journal of Clinical Microbiology 2003 ; 41 : 913–914.
33. Santos N, et al. Detection of rotavirus types G8 and G10 among Brazilian children with diarrhea. Journal of