Innovation diffusion under budget constraints
Microeconometric evidence on heart attack in France
Brigitte Dormont
yand Carine Milcent
z.
6 novembre 2005
We are grateful to François Bourguignon and two anonymous referees for their comments. All remaining errors are ours.
yUniversity of Paris Dauphine (LEGOS), France and Institute of Health Economics and Management, Lausanne,
Switzerland. E-mail : [email protected]
zPSE (CNRS-EHESS-ENPC-ENS), Paris, France and Institute of Health Economics and Management, Lausanne,
Abstract
This paper studies the relationship between the di¤usion of innovative procedures for the
treat-ment of heart attack and distributions of the cost and length of hospital stays. Using a sample
of 5,681 stays observed in French public hospitals, we use microsimulation techniques to highlight
various e¤ects on the shifts in the overall distribution of the costs and length of stays : (i) the
e¤ect of the adoption of new techniques by hospitals (between hospital di¤usion) ; (ii) the e¤ect
of the di¤usion of technological progress within hospitals ; (iii) the e¤ect of changes in patients’
characteristics (age, comorbidities). This decomposition approach is used in the studies on the
rela-tionship between education and income distribution where observed distributions are compared to
counterfactual distributions built by replacing some estimated parameters with their counterparts
estimated from another country or time period. Our work shows that between 1994 and 1997
hospi-tals faced two main causes of rises in costs : …rstly, di¤usion of technological progress, with increasing
use of costly innovative procedures such as angioplasty ; secondly, patients’ epidemiological state
worsened, since they became older and had more secondary diagnoses. These two factors induced
sizeable shocks in cost distribution. Over this period, French public hospitals were …nanced by a
global budget, and their budgets increased very slowly. However, international comparison shows
that di¤usion of technological progress for AMI treatment was similar in France and in comparable
countries. How did French hospitals deal with their …nancial constraints ? Our study shows that
they greatly reduced the length of stays for patients at the bottom of the distribution. This
reduc-tion in the length of stays appears to have enabled hospitals to …nance the di¤usion of angioplasty.
Obviously, such a strategy cannot be sustained in the long run without jeopardizing the quality of
1
Introduction
This paper studies the relationship between the di¤usion of innovative procedures and changes in
costs and lengths of hospital stays. In contrast with macroeconomic analyses, where the in‡uence
of technological progress is often reduced to a trend, microeconomic empirical evidence is used
here. Data relative to individual hospital stays provide direct information about the di¤usion of
technological progress which makes it possible to evaluate the e¤ects of technological progress on
costs at di¤erent points in the cost distribution.
In the case of health care, direct information on technological progress di¤usion can be gathered
by observing changes in the use of innovative treatments and substitution between treatments.
We focus on patients hospitalized with acute myocardial infarction. For these patients, the use of
innovative procedures such as angioplasty is growing rapidly in all developed countries (TECH,
(2001)). These procedures are less costly than traditional ones such as bypass surgery. They are
less invasive and more respectful of patients’quality of life. Innovative procedures can replace more
traditional procedures. However, their use is spreading above and beyond this type of substitution.
Cutler and McClellan (1996) have studied the impact of technological progress on the treatment
of heart attack in the U.S. After showing that the prices paid for a given level of technology are fairly
constant over time, they conclude that growth in treatment costs results entirely from di¤usion of
innovative procedures.
This di¤usion a¤ects treatment costs in several ways. The implementation of innovative
proce-dures induces a direct increase in cost for each stay. In addition, there may be an indirect increase
if the procedure lengthens stay duration. Furthermore, di¤usion of innovative procedures leads to
more frequent use and thus ampli…es the increase in the average cost of heart attack treatment.
Performing innovative procedures requires investment in speci…c training and high-tech
equip-ment. The process of di¤usion of technological progress in heart attack treament is thus composed
of two steps : …rstly, adoption of new techniques by hospitals ; secondly, an increase in the use of
innovative procedures by hospitals which are able to perform them.
Our data covers public and private not-for-pro…t hospitals in France. We have at our disposal a
database with three dimensions (stays-hospitals-years) relative to 11,573 stays for acute myocardial
relative to years 1994 and 1997, we …nally retained a sample of 5,681 stays.
The study is carried out in four stages.
We …rstly use a descriptive approach to characterize the pace and patterns of di¤usion of
inno-vative procedures for treating heart attacks, as well as the main features of AMI patients.
In the second stage, we estimate a four equation model that explains, for a given AMI-patient in a
given year, the cost and the length of stay, the probability of being assigned to an innovative hospital
(which has adopted the new techniques), and - conditional on the assignment to an innovative
hospital- the probability of use of an innovative procedure. This model is estimated for 1994 and
1997, the …rst and last years of our observation period. The results show a rise in the use of
innovative procedures beween 1994 and 1997. The estimates allow us to evaluate the extra cost
attributable to the use of an innovative procedure.
In the third stage, we use the estimates of our four-equation model to compute decompositions
on means of the overall changes observed between 1994 and 1997, in the spirit of the Oaxaca (1973)
decomposition.
In the fourth stage we focus on changes in the distributions of treatment costs and length of
stays. The principle of our analysis is the following : we use the probability of implementation of an
innovative procedure, estimated on the basis of the 1997 data, to simulate the cost and length of stays
for patients observed in 1994. Comparison of the result with actually observed costs for 1994 allows
us to assess the impact of technological progress di¤usion on the distributions of costs and lengths
of stays. In other words, we perform microsimulation techniques where observed distributions are
compared to counterfactual distributions built by replacing some estimated parameters with their
counterparts estimated from another year. This approach highlights various causes of shifts in the
overall distributions : (i) the e¤ect of adoption of new techniques by hospitals (between hospital
di¤usion) ; (ii) the e¤ect of di¤usion of technological progress within hospitals ; (iii) the e¤ect of
changes in patient characteristics (age, gender, comorbidities).
One important feature in our analysis is that we go beyond the traditional Oaxaca decomposition
on means and consider distributions. Indeed, not all patients are treated by an angioplasty. Therefore
us to examine whether the estimated shocks occurred at di¤erent places of the distributions under
study. This allows us to draw conclusions about how an increasing use of innovative procedures was
possible within the context of a rather severe budget constraint.
This article is organized as follows. In section 2, we describe the pace and patterns of
techno-logical progress di¤usion in France in the treatment of heart attacks. Section 3 is devoted to the
speci…cation and estimation of a four-equation model explaining length and cost of AMI stays. In
section 4, we use the estimates of the model to analyse the average changes that occurred between
1994 and 1997. Methods and results of our microsimulations are presented in section 5, where we
analyse the changes in distributions. Section 6 concludes.
2
Pace and patterns of innovative procedure di¤usion
We have at our disposal a sample of 11,538 stays for acute myocardial infarction (AMI) observed
in 44 French public hospitals over the period 1994-1997. In France and in the present study, the
term ”public hospitals”refers to government hospitals and to private-not-for-pro…t hospitals which
are regulated by the global budget system (i.e. most of private-not-for-pro…t hospitals). Our sample
does not record admissions in private-for-pro…t hospitals.
In France, public hospitals account for the majority of admissions (2/3 of admissions for AMI).
While in the U.S. public hospitals serve a large proportion of indigent people, this is not particularly
the case in France, where the clientele of public hospitals is varied. In France, all teaching hospitals
are public and large public hospitals generally provide a high quality of care.
Our sample has been extracted from the PMSI1 cost database. Classi…cation of stays by
Diag-nosis Related Group (DRG) is performed on the basis of diagnoses and procedures implemented
during the stay. In order to obtain a high degree of homogeneity in patient pathologies, we
selec-ted patients aged at least 40 years with acute myocardial infraction (AMI) as the main diagnosis,
grouped in DRGs 178 (complicated AMI) and 179 (uncomplicated AMI). For our empirical work,
we restricted the sample to two cross-sections : 2,269 and 3,412 stays observed in 1994 and 1997.
1PMSI stands for the Programme de médicalisation des systèmes d’informations, which collects information about
hospital activity. Information about the cost of stays is available from a hospital sub-sample called ”Base nationale de coûts”.
2.1
Treatment for AMI
Together with drug therapy (aspirin, beta blockers, etc.), AMI patients can receive various
treatments such as thrombolytic drugs, cardiac catheterization (hereafter denoted as CATH) and
percutaneous transluminal coronary angioplasty (PTCA). Catheterization is a procedure used to
view the blood ‡ow to the heart in order to improve the diagnosis. Angioplasty appeared more
recently than bypass surgery. It is an alternative, less invasive procedure for improving blood ‡ow
in a blocked artery by in‡ating a balloon to create a channel through the blockage2. This procedure
is costly : its implementation induces for one stay an increase in cost which ranges between 30 %
and 60 %.
Statistics computed from the total sample of all AMI patients show that most angioplasties
are grouped in DRGs 179 and 178. Bypass surgery is implemented for a very small proportion
of AMI patients, less than 3 %. Angioplasty may reduce AMI treatment cost when it replaces a
more costly procedure such as bypass surgery. However, the savings arising from this substitution
are rather marginal, given the low frequency of bypass surgery. This paper does not study this
substitution e¤ect. Therefore, we have restricted our sample to non surgical DRGs, (DRG 178 and
179), excluding AMI patients treated by bypass surgery.
2.2
Incentives to use innovative procedures within the French regulatory
system
In France, public hospital budgets have been based on a global budget system for more than ten
years, including the years 1994-1997 that we study. A complete information system which classi…es
inpatient stays by DRG has been set up, but a prospective payment system (PPS) with …xed
payment per stay in a given DRG has not been implemented yet. A gradual introduction of a PPS
is planned for 2004-2005. Budgets have no direct link to actual hospitals’activity. In practice, the
actual budget depends on annual negotiations between the hospital manager and the regulator,
who is a regional representative of the Ministry of Health. The outcome of these negociations is
in‡uenced by the number of stays recorded in all DRGs and by the hospital’s reputation. There
2More recently, angioplasty has increasingly been performed with implantation of one or more stents (a kind of
is no real incentive to improve e¢ ciency. Hospitals are managed by salaried administrators and do
not keep the gains resulting from cost reduction e¤orts. The budget constraint is soft in the sense
that hospitals are almost never forced to close solely on the basis of a …nancial de…cit. However,
a hospital which overspends its budget may incur severe shortages. These shortages may prevent
the hospital from buying supplies for angioplasties, for instance, and force it to stop this kind of
activity for several months at the end of the year.
In France, …nancial incentives to use innovative procedures are quite di¤erent in the private and
public sectors (Jacobzone and alii (2002) and Milcent (2003)). While doctors in public hospitals
are salaried, physicians working in the private sector are paid on the basis of fee-for-service and
receive additional fees for performing angioplasties. As concerns investment in angioplasty, in public
hospitals, there is, for the period under study, no regulation requiring prior approval of technology
acquisition. A deterrent to public sector use of innovative procedures is the …nancing of supplies
from a global budget, which may limit the purchase of expensive devices. In addition, the use of
angioplasty does not lead to classi…cation of a stay into a speci…c DRG in France during the years
1994 to 19973. Therefore, even when the global budget takes hospital’s activity into account, it does
not take angioplasty into account and the public hospitals which use it are penalized. On the other
hand, private hospitals are …nanced on the basis of a fee-for-service system : supplies such as stents
are reimbursed ex-post in addition to the fee-for-service payment.
These features seem to have limited the pace of angioplasty di¤usion in the French public sector.
A comparative analysis between our data and data on AMI stays in Medicare hospitals has shown
that the growth in the use of angioplasty is slower in French public hospitals, in comparison to what
is observed in the US for Medicare hospitals (Delattre et al.,2002)4.
However, we will see below that angioplasty di¤usion in French public hospitals is far from
negligible. Its pace is comparable to what is observed in other developed countries. Obviously, for
physicians working in the public sector, there are many indirect …nancial incentives, as well as non
…nancial incentives for the acquisition and development of innovative procedures. A career in public
3In the US classi…cation, stays with angioplasty are grouped in a speci…c DRG (DRG 112).
4As regards the French private sector, it was possible for us to carry out only a static comparison for year
1997 because of data limitations. This comparison shows that French private hospitals use angioplasty much more frequently than French public hospitals. (The rate of angioplasty in Medicare hospitals lies between the two.) This might be due to spillover from the public sector, where there might be waiting lists. Alternatively, it might be the case that angioplasty is used too intensively in the French private sector because of the fee-for-service payment system.
hopsitals is rather prestigious in France. In teaching hospitals, physicians are involved in
interna-tional research competition and their careers depend on their success in scienti…c publications. In
addition, as we have seen, the level of the global budget depends partly on the hospital’s reputation,
which can be enhanced if it is innovative.
2.3
Basic features of the data
As stated above, our sample concerns stays in French public hospitals which are regulated by
a global budget system. The period 1994-1997 that we study is characterised by very slow budget
growth. In fact, the increase in budgets was close to zero in real terms.
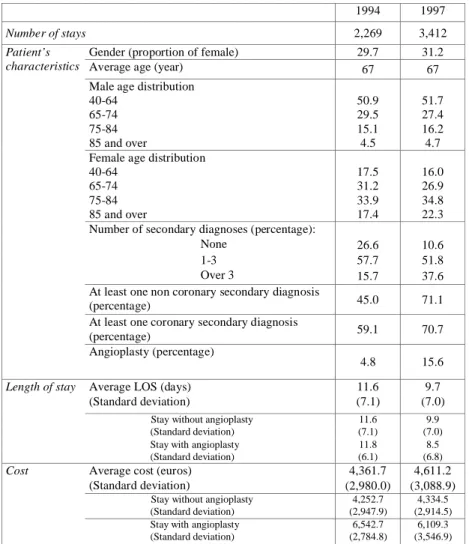
Table 1 reports statistics computed for the …rst (1994) and last (1997) year of our observation
period. Our empirical study focuses on changes between these two years.
Most of the patients are men. The average age of the patients, both in 1994 and in 1997 is 67
years. A characteristic of heart disease appears in table 1 : male AMI patients are rather young
(in the age group 40-64) and female AMI patients are much older. The proportions of males and
females in age category are rather similar in the years 1994 and 1997. Patients are slightly older in
1997, especially women.
The epidemiological state of AMI patients is worse in 1997 : the number of secondary diagnosis
is much greater (table 1). The proportion of patients with at least one non coronary secondary
diagnosis is greater, as well as the proportion of patients with at least one coronary secondary
diagnosis. Other statistics5 we have computed show an increase in the frequency of secondary
diagnoses such as arrhythmia, hypertension, heart failure, cerebrovascular disease and peripheral
arterial disease6.
Our indicator of the use of innovative procedures is the proportion of patients treated by
angio-plasty. The table shows that the overall rate of use of this procedure is growing rapidly in France :
it went from 4.8 % of stays in 1994 to 15.6 % in 1997.
5Unpublished here but available on request.
6This increase in secondary diagnoses might be due to a worsening of patients’ states. It could also be the result
of more systematic registration of diagnoses by physicians. Changes in registration behavior could be encouraged by the prospect of a reform in the hospital payment system. It is possible for a hospital manager to create incentives for physicians to register diagnoses more systematically by allocating the budget between units in relation to their contribution to the hospital’s activity.
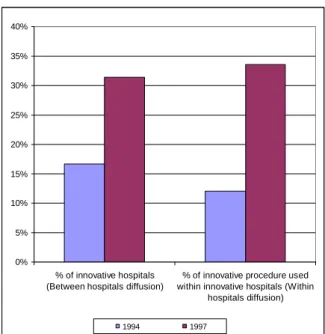
Performing innovative procedures requires investment in speci…c training and high-tech
equip-ment. The process of di¤usion of technological progress is thus composed of two steps : …rst, the
adoption of new techniques by hospitals ; second, the increase in the use of innovative procedures
by hospitals which are able to perform them. We call the …rst step between hospital di¤ usion. The
second step is linked to a process of learning by doing (Ho (2002)) : we call it within hospital
dif-fusion. Cutler and McClellan (1996) stress the importance of distinguishing between acquisition
and use of technology, when analysing incentives for technology development. Between and within
di¤usion7 are illustrated by …gure 1. The proportion of hospitals able to perform innovative
proce-dures is increasing rapidly. The proportion of angioplasty implemented within innovative hospitals
is growing even more rapidly. These patterns in France are comparable to the pace of technological
progress di¤usion observed in comparable developed countries (TECH, 2001, Cutler and McClellan,
1996, Cutler et al.,1998).
Table 1 also gives some information about the average length (LOS) and cost (C) of stays. The
average length of stay decreases sharply between 1994 and 1997. It does not seem to be in‡uenced
by the performance of angioplasty. On the other hand, a stay is much more costly when angioplasty
has been implemented. The average cost per stay increased slightly, from 4,361.7 Euros in 1994 to
4,611.2 Euros in 1997, i.e. an increase in nominal terms of 5.7 %.
This rather limited cost increase illustrates the strength of the global budget. Between 1994
and 1997, growth in the average hospital budget was close to zero in real terms. During the same
period, the pace of technological progress di¤usion was rapid (…gure 1). How did hospitals manage
to increase the use of innovative procedure in the context of such a …nancial constraint ? What is
the link between the decrease in the length of stays and technological progress di¤usion ?
3
Designing a four-equation model to explain length and
cost of AMI stays
To answer these questions, we use microsimulation techniques to examine the in‡uence of various
e¤ects on the shifts in the distributions of the cost and length of stays. The …rst step of this approach
is speci…cation and estimation of a four-equation model explaining assignment to an innovative
hospital, treatment by an angioplasty, length and costs of stays.
3.1
Econometric speci…cation
For patient i and year ; we consider the following model :
IHi = IIHi >0 with IHi = x
0
i B + i (1)
proci = IPr oci >0 with proci = x0i D + i if IHi > 0 (2)
Log(LOSi ) = x0i d + IHi a + proci p + c + i (3)
Log(Ci ) = x0i + LOSi + IHi + proci + + ui (4)
This model has a recursive structure8 and entails two assignment equations and two equations
explaining respectively the length and the cost of the stay.
The …rst assignment equation (1) explains assignment to an innovative hospital, given a patient’s
demographical and epidemiological characteristics x0. IH is a dichotomic variable equal to 1 if the
patient is assigned to a hospital that is able to perform angioplasty. The second assignment equation
(2) explains, conditional on assignment to an innovative hospital, the probability of being treated
by angioplasty. proc is a dichotomic variable equal to 1 if the patient is treated by angioplasty.
Equation (3) explains the logarithm of the length of the stay by patient characteristics x0, potential
assignment to an innovative hospital and potential treatment by angioplasty. Equation (4) explains
the logarithm of the cost of the stay using the same explanatory variables and the length of stay.
We aim to analyse changes in the distributions of the lengths of stays and costs that occurred
between 1994 and 1997. For that purpose, we estimate this four-equation model on the cross-sections
relative to years 1994 and 1997. Owing to the rather limited number of observations provided by
our sample (5,681), we adopt a parametric approach.
3.2
Econometric estimates
The recursive model de…ned by (1) to (4) has been estimated equation by equation for years 1994
and 1997. A simple probit estimator has been used for equation (1), which explains assignment to an
innovative hospital. Conditional on this assignment, equation (2) explains the probability of being
treated by angioplasty. It has been estimated by a probit estimator with selection9. For identi…cation
purposes, the selection equation entails other regressors10 in addition to the explanatory variables
of (2). Denoting the correlation coe¢ cient between the disturbances of the probit equation and
the selection equation of (2), the LR test leads us not to reject = 0 for the year 1994, but to reject
= 0 in 1997 (5%).
The estimates11 of (1) and (2) reveal that age has a signi…cant negative in‡uence on the
proba-bility of being assigned to an innovative hospital and on the probaproba-bility of being treated with an
innovative procedure. The constants of the two equations rise sharply between 1994 and 1997. In
addition, the in‡uence of a non coronary secondary diagnosis on the assignment to an innovative
hospital increases signi…cantly between these two years. These results illustrate the rapid between
and within hospital di¤usion of technological progress.
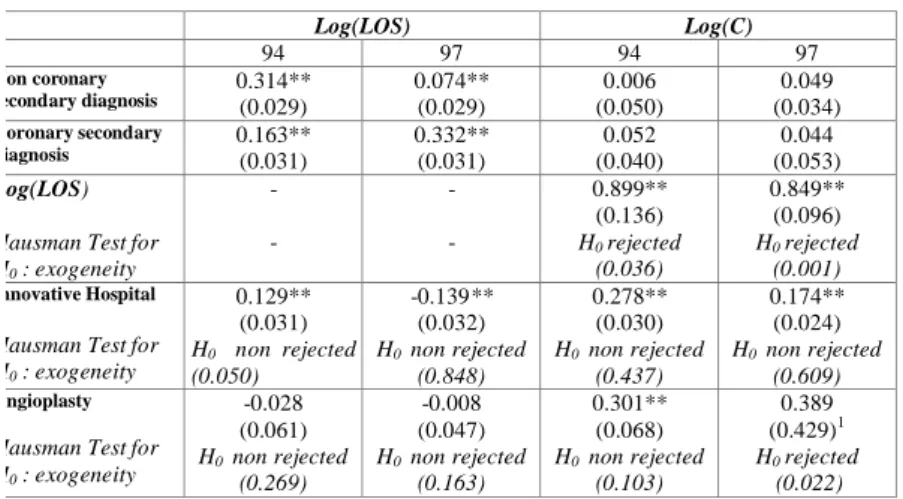
Table 2 displays the estimates of (3) and (4). We performed Hausman’s tests to check for
exogeneity of the length of stay and of the dichotomous variables IH and proc describing assignment
to an innovative hospital and treatment by angioplasty. We have used an intrumental variable
estimator12 when exogeneity was rejected. This was the case for the length of stay in the cost
equation for both years 1994 and 1997 and for proc in 1997.
A decrease in the length of the stay is indicated by the change in the constant of equation (3) :
-22.5 % for the reference patient, i.e. a male aged 40-65 with no secondary diagnosis, who is not in an
innovative hospital and has not been treated by angioplasty. The explanatory variables of (3) and
(4) relative to patient characteristics x0 include cross e¤ects of patient gender and age (four levels)
and two dichotomic variables indicating whether the patient has at least one non coronary secondary
diagnosis and/or at least one coronary secondary diagnosis. We do not report the estimates of the
9First considered by Van de Ven and Van Pragg (1981).
1 0Additional indicators of secondary diagnoses, hospital size, cross e¤ects of patient’s age and gender. 1 1Not reported here, available on request.
1 2For identi…cation purposes, we had to consider instruments in addition to the explanatory variables of (3) in the
structural model : we thus included age squared, age raised to the third power and detailed indicators of secondary diagnosis, such as arrhythmia, hypertension, heart failure, cerebrovascular disease and peripheral arterial disease. These instruments are used for the estimation of (4) and to perform the exogeneity test.
coe¢ cients relative to the cross e¤ects of gender and age : they are all signi…cant in equation (3) and
show that the length of stay increases with age and is higher for women at all ages. These e¤ects
all increase between 1994 and 1997, indicating that the decrease in the length of stays revealed by
the change in the constant is not homogenous for all patients.
Being assigned to an innovative hospital has a signi…cant e¤ect on the length of stay (Table 2).
This in‡uence is positive in 1994, but becomes negative in 1997. This result is understandable in
the French context of the global budget system. From 1994 to 1997, budgets stagnated and had no
direct link to hospitals’actual production. In that context, one way to expand the use of innovative
and costly procedures was for an establishment to reduce the length of stays. We observe that this
behavior concerns all patients treated in an innovative hospital : for a given stay, the performance
of an angioplasty does not signi…cantly in‡uence the length of the stay.
Secondary diagnoses have a positive and signi…cant in‡uence on the length of the stay. On the
other hand, their direct in‡uence on the cost of the stay is not signi…cant (see the two last columns
of table 2). Yet they have an indirect in‡uence on cost through their impact on the length of stays.
Indeed, LOS has a signi…cant in‡uence on cost with a coe¢ cient close to 0.9 in 1994 and 1997.
Costs are signi…cantly higher in innovative hospitals. In 1994, they are 27.8 % higher. The
estimated di¤erence drops to 17.4 % in 1997. In addition, performing angioplasty signi…cantly
increases the cost of a stay : + 30.1 % in 1994. The corresponding coe¢ cient is 38.9 % in 199713.
This increase may be linked to changes in the technology of angioplasty (introduction of stents)
and changes in supply prices.
To sum up, age and secondary diagnoses have a positive e¤ect on the length of stay, which, in
turn, in‡uences positively the cost of a stay. Costs are signi…cantly higher in innovative hospitals
and when an angioplasty has been performed. Our descriptive analysis has shown that the patients’
state is worsening and that the use of innovative procedures, as well as the proportion of innovative
hospitals, are increasing rapidly. Therefore, the cost of stays is likely to be subject to strong positive
shocks. Our purpose is to study, within this context, the e¤ect of the cost-containment induced by
the global budget constraint on the distributions of the cost and the length of stays.
1 3This last coe¢ cient appears to be not signi…cant. However, we lost much of the variability of proc since we had
4
Average changes between 1994 and 1997
In this section we use the estimates of our four-equation model to compute decompositions
on means of the overall changes observed between 1994 and 1997. Average changes are split into
changes due to shifts in coe¢ cients and changes due to shifts in patients’observable characteristics.
This allows us to check the robustness of our results and to raise questions which are adressed in
the analysis of distributions in the last section.
4.1
Decomposition of average changes
We consider decompositions on means of the overall changes between 1994 and 1997, in the
spirit of the Oaxaca (1973) decomposition. For the sake of simplicity, we refer to the notation of a
linear model (such as equations (3) and (4)). One has :
Yi0= Xi0 0+ ui0 and Yj1= Xj1 1+ uj1;
where i and j are relative to patients observed, respectively, in years 0 and 1: In general, there is
no reason for the same patient to be observed in the two years: Xi0 and Xj1are horizontal vectors
of explanatory variables for patients i and j. Denoting by Y:0; Y:1; X:0; X:1the sample means of the
corresponding variables, and by^0and^1the estimated coe¢ cients, we can compute the following
decomposition : Y:1 Y:0= X:0( ^ 1 ^ 0) + (X:1 X:0) ^ 1 (5)
The …rst part of the right-hand side is the average change in Y due to shifts in the coe¢ cients :
The second part is the change in Y due to the average shift in patients’observable characteristics
X:
This decomposition takes year 0 as the reference for variables X: Choosing year 1 as the reference
for X leads to another decomposition :
Y:1 Y:0= X:1( ^ 1 ^ 0) + (X:1 X:0) ^ 0: (6)
We use the estimates of equations (1) to (4) to compute the decompositions de…ned on means by
(5) and (6). Notice that our approach is not limited to decompositions which would be implemented
equation by equation. In a rigorous approach, we take the full information arising from our recursive
four-equation model into account. For example, changes in the coe¢ cients of (1) and (2) induce
changes in the length of stay which is an explanatory variable of cost in (4). Altogether, the use
of this full-information approach imply that changes due to shifts in explanatory variables are
entirely attributable to changes in patients’observable characteristics, i.e. age, gender and secondary
diagnoses. The other variables are endogeneously set by the equations of the model.
Our results are reported in table 3. They show that the rise in the average probability of being
assigned to an innovative hospital (+ 6.8 %) is due to shifts in coe¢ cients (+ 2.8 %) and to changes
in patient characteristics (+ 4.0 %). By constrast, the dramatic increase (+ 32 %) in the use of
angioplasty within innovative hospitals is entirely due to changes in practices.
Changes in coe¢ cients induce a very sharp decrease in the length of stays (- 31.2 %), which is
only slightly compensated by shifts in the explanatory variables (+ 6.55 %). The changes in the
explanatory variables which induce a lengthening of stays are linked to patient ageing, especially
for women, and to secondary diagnoses : they have a positive in‡uence on the length of stays and
their frequency rises between 1994 and 1997. Nevertheless, the overall change in the length of the
stays is strongly negative (-24.7 %) since the impact of changes in behavior, which tend to shorten
stays, is predominant.
Finally, the average increase in cost per stay is rather small : + 5 % only, for nominal cost.
This illustrates the strength of the global budget constraint during this period. How did hospitals
deal with this …nancial constraint ? The decomposition of table 3 shows that changes due to shifts
in explanatory variables are positive (+ 7.9 %) whereas changes dues to shifts in coe¢ cients are
negative (- 2.9 %). This negative e¤ect of changes in behavior stems from the tendency to shorten
stays which is only partly o¤set by the extra costs arising from the increasing use of angioplasty.
To sum up, changes in cost determinants follow very di¤erent patterns : the length of stays
decreases sharply ; the probability of being assigned to an innovative hospital rises ; the probability
of being treated by an angioplasty rises. Taken together, these behavior changes result in a negative
distributions and identify the respective impacts of technological progress di¤usion, changes in
patient characteristics and shifts in LOS behavior.
4.2
Robustness of the results
Before turning to the analysis of changes in distributions, it is important to check the robustness
of our results.
One weakness of our estimates is that few good instruments are available. To allow for the
non-exogeneity of the length of stay, we have considered intruments such as higher order power of age
and detailed indicators of secondary diagnosis. These instruments are used for the estimation of (4)
and to perform the exogeneity tests. Given that they are di¤erent from the regressors of equations
(3) and (4), the model is identi…able. However, there is no reason to think that there is a valid
exclusion restriction here. We cannot draw strong causal statements from our instrumental variable
estimates. To examine whether our estimates of (4) depend strongly on the method used, we have
estimated this equation by OLS and then computed again the decomposition of average changes
between 1994 and 1997. Results are displayed in table 4 (appendix A), line (4). They show that
changes due to shifts in explanatory variables are equal to +9.6 % whereas changes dues to shifts
in coe¢ cients are equal to - 4.6 %. These evaluations are very close to what was obtained with the
instrumental variable estimates (respectively, + 7.9 % and - 2.9 %).
Another di¢ culty stems from the fact that the increase in secondary diagnoses might be due
to more intensive coding in 1997 in reaction to the prospect of a reform of the hospital payment
system. If this is the case, our severity adjustment uses overstated changes in patient characteristics.
Accordingly, severity-adjusted length of stay would appear to fall more than in reality. One
impor-tant result of our study is that changes in the length of stay behavior make it possible for hospitals
to …nance a more intensive use of angioplasty. Therefore, it is crucial for us to examine whether
the changes estimated for LOS behavior are robust to a potential coding bias. For this purpose,
we have re-estimated the four-equation model while excluding secondary diagnoses from the list of
regressors. With this approach, secondary diagnoses are treated equally in 1994 and 1997 : they
are part of unobserved patient heterogeneity in the disturbance. Then we have computed again the
are displayed in table 4 (appendix A), line (3)’. As anticipated, changes due to shifts in explanatory
variables are now much smaller (+1.5 % instead of +7.9 %). However, we observe that changes
dues to shifts in coe¢ cients are only sligthly reduced and still quite sizeable : -26.1 % (instead of
-31.2 %). Thus, the result relative to strong changes in the LOS behavior seems to be robust to
the treatment of secondary diagnoses.
5
Analysing changes in the distributions of treatment costs
and length of stays
We now consider LOS and cost distributions instead of means. Denote by the overall
distri-bution of Log(LOS) at time and by the overall distribution of Log(C) at time : Given that
patient characteristics are the only exogenous explanatory variables in our recursive four-equation
model, these distributions can be expressed as vector functions of observable and unobservable
patient characteristics and of the parameters at date . In our study, is equal to 1994 or 1997,
denoted by 0 or 1 for the sake of simplicity. One has : = fx0
i ; "i ; (B ; D ; d ; a ; p ; c )g ;
where "i = ( i ; i ; i ) and = fx0i ; i ; (B ; D ; d ; a ; p ; c ; ; ; ; ; )g ; where i = ( i ; i ; i ; ui ) : These expressions correspond to the reduced form of our model. They
include the exogeneous explanatory variables x0i ; as well as the disturbances and parameters of
equations (1) to (4).
These distributions are represented in graphs14 1 and 2. Changes in the distributions between
1994 and 1997, 1 0 and 1 0; are displayed in graphs 1a and 2a. They are explained by
several factors :
- increasing adoption of new techniques by hospitals. This between hospital di¤usion is linked
to a change from B0to B1 in the coe¢ cients of (1). With given demographical and epidemiological
characteristics, a patient has a higher probability of being assigned to an innovative hospital in year
1 than in year 0.
- within hospital di¤usion linked to a change from D0 to D1 in the coe¢ cients of (2). With
1 4The distributions reported in this paper are kernel density estimates displayed by Stata software . We used the
Epanechnikov as the kernel function and the default value chosen by the software for the bandwidth. The di¤erences in densities displayed in this paper have been smoothed using a program provided by Stata.
given characteristics, a patient assigned to an innovative hospital has a higher probability of being
treated by an angioplasty in year 1 than in year 0.
- changes in patients’ demographical (age, gender) and epidemiological (secondary diagnoses)
characteristics. This population e¤ect is related to changes in observable (x0
i ) and unobservable
("i ; i ) patient characteristics.
The e¤ects of between and within hospital di¤usion on the cost and length of stays can be
ampli…ed by indirect e¤ects. These are captured through the coe¢ cients a ; p ; ; and in
equations (3) and (4). For instance, changes from 0to 1can be linked to changes in supply prices.
Shifts in the overall distributions depend on the three e¤ects mentioned above and on changes in
all other coe¢ cients.
5.1
Simulating counterfactual distributions : the methodology
Consider the overall distributions 0and 0 of the logarithms of the length of stays and of costs
at time 0 :
0= fx0i0; "i0; (B0; D0; d0; a0; p0; c0)g (7)
0= fx0i0; i0; (B0; D0; d0; a0; p0; c0; 0; 0; 0; 0; 0)g (8)
The e¤ects de…ned above can be evaluated as follows :
1) Between hospital di¤ usion
The between hospital di¤usion is linked to the change from B0 to B1 in the coe¢ cients of (1).
The results of our estimates reveal that this change if far from negligible. With given characteristics,
a patient has a higher probability of being assigned to an innovative hospital in 1997 than in 1994.
Using the estimates, we can simulate the counterfactual distribution :
0:1(B) = fx0i0; "i0; (B1; D0; d0; a0; p0; c0)g (9)
This counterfactual distribution is the distribution of the length of stay that would be observed
if the patients observed in 1994 were assigned to innovative hospitals with probabilities of 1997,
all other behaviors being equal to those estimated for 1994 as regards equations (2) to (4). The
di¤erence between the counterfactual distribution of the length of stay 0:1(B)and the distribution
observed in 1994, i.e. 0:
d 0:1(B) = 0:1(B) 0 (10)
2) Within and between hospital di¤ usion
Within hospital di¤usion is linked to the change from D0 to D1 in the coe¢ cients of (2). We
have seen that the spread in the use of angioplasty is very rapid and entirely due to a change in the
coe¢ cients of (2) : with given characteristics, the probability of being treated by angioplasty is much
higher in 1997 than in 1994. To evaluate the e¤ects of between and within hospital di¤usion on the
distribution of the length of stays, we use the estimates to simulate the counterfactual distribution
0:1(B:D)= fx0i0; "i0; (B1; D1; d0; a0; p0; c0)g, that gives the distribution of the length of stays that
would be observed if the patients observed in 1994 were assigned to innovative hospitals and treated
by angioplasties with the probabilities of 1997, all other behaviors being equal to those estimated
for 1994.
The cumulated e¤ects of between and within hospital di¤usion on the distribution of the length
of stays is then evaluated by the di¤erence between the counterfactual distribution of the length of
stay 0:1(B:D) and the distribution observed in 1994, i.e. 0:
d 0:1(B:D)= 0:1(B:D) 0 (11)
The same reasoning applies to the analysis of the impact of between and within di¤usion on the
distribution of the logarithms of the costs of the stays. The distribution in year 1994, denoted 0; is
de…ned by (8). The e¤ects mentioned above can be de…ned in the same way for costs by computing
di¤erences between counterfactual distributions and the distribution observed in 1994. As concerns
the cumulated e¤ects of between and within hospital di¤usion, one has :
d 0:1(B:D)= 0:1(B:D) 0 (12)
what what is due to unobservable heterogeneity. As stated by Bourguignon et al. (2001), it is
possible to simulate a change in the distribution of unobservable characteristics through a
rank-preserving transformation. When this distribution is assumed to be normal with a zero mean, this
transformation is equivalent to :
"i;0:1= "i0 1 0
; (13)
where "i;0:1 is the rank-preserving transformation15 of the distribution of "i0 in the distribution
observed at time 1: More exactly, it is the simulation of the unobserved heterogeneity of patient i ,
observed in year 0; if he or she were ill in year 1.
To evaluate the e¤ects of changes in patients’unobserved heterogeneity, one can compute :
d 0:1(") = 0:1(") 0; (14)
where 0:1(")is the counterfactual distribution de…ned by : 0:1(") = fx0i0; "i;0:1; (B0; D0; d0; a0; p0; c0)g.
To evaluate the cumulated e¤ects of changes in unobservable and observable characteristics, we
have to consider the individuals observed in year 1 :
d 0:1(x:")= 0:1(x:") 0 ; (15)
where 0:1(x:") is de…ned by : 0:1(x:") = x0j1; "j;1; (B0; D0; d0; a0; p0; c0) : This latter
ex-pression is the counterfactual distribution that would prevail if the patients observed in 1997 were
assigned and treated with the behaviors of 1994.
The same reasoning is applied to evaluate the e¤ects on the cost distribution of changes in
observable patient characteristics and unobservable heterogeneity.
Let us brie‡y comment on the principle underlying our computations. As concerns for instance
between and within di¤usion e¤ects, we compare the observed distribution at date 0 with a
hypo-thetical (counterfactual) distribution obtained by simulating on the patients observed at date 0 , the
behaviors at date 1. This change in behaviors due to technological progress di¤usion is re‡ected by
changes in coe¢ cients from B0to B1 and from D0to D1: We evaluate the impact of these changes
1 5More generally, a rank-preserving transformation of the distribution of "
i0observed in 0 in the distribution "i1
on the costs and length of stays distributions. Given the number of parameters of our four-equation
model, it would be possible to simulate a very high number of combinations for the various possible
e¤ects. Considering them exhaustively seemed to us of low interest. We preferred to focus on the
e¤ects detailed above and to try to answer questions of speci…c interest.
As stated by DiNardo et alii (1996) and Bourguignon et alii (2002), this approach can be seen
as an extension of the Oaxaca methodology for decomposing the e¤ects of discrimination between
two groups of individuals into di¤erences in mean income due to di¤erent mean characteristics
of individuals in the two groups (here, our patients’ characteristics) and di¤erences in how these
characteristics are remunerated within each group (here, the changes in parameters : how the same
epidemiological characteristics can lead to more frequent use of innovative procedures in year 1 than
in year 0). The main change in our approach is that the decomposition is performed on the full
distribution rather than on means. Indeed, since innovative procedures are not used to treat every
AMI patient, this di¤usion of technological progress is likely not to a¤ect the cost in the same way
at each point of the distribution16.
5.2
Results
Graphs 3a-d and 4a-d display the main results of our microsimulation . All these graphs represent
di¤erences between distributions. Graph 3a (respectively, 4a) gives the overall change 1 0that
is observed for the distribution of the log of the length of stays (respectively, the log of the costs,
1 0) between 1994 and 1997. The other graphs (3b-d and 4b-d) give di¤erences between our
simulated counterfactual distributions and the distributions observed in 1994. They show the main
shocks that a¤ected the distributions of LOS and costs between 1994 and 199717. We have used
the same scale for all graphs in order to compare the magnitudes of the various e¤ects. Additional
graphs provide detailed results in appendix B.
1 6This kind of decomposition may depend on the year taken as reference. Therefore, we have computed, for the
di¤erent e¤ects, the evolutions d 1:0(:) and d 1:0(:), in order to check for the robustness of the results. The results are available on request.
1 7In this paper, we present the mains shocks that have a¤ected the distributions. There is of course a "residual"
5.2.1 The impact of technological progress di¤usion
The cumulated e¤ect of between and within di¤usion on the distribution of Log(LOS) is shown
in graph 3b. It appears to be rather small. As concerns the within e¤ect, this is not surprising : the
performance of angioplasty has no signi…cant in‡uence on the length of the stay (table 2). As for
the between di¤usion e¤ect, the estimates revealed that being assigned to an innovative hospital
has a signi…cant, but rather small positive in‡uence on the length of the stay in 199418. Graph
3b’ in appendix B isolates the e¤ect of between hospital di¤usion on the distribution of ln(LOS).
Comparing graph 3b and 3b’leads to the conclusion that the cumulated e¤ect is mainly due to the
between hospital di¤usion e¤ect, and that this e¤ect is very small.
Turning now to cost distribution, graph 4b gives the cumulated e¤ects of between and within
di¤usion. Both e¤ects appear to be quite sizeable. They induce a rise in costs : the frequency of
low-cost stays decreases whereas the frequency of expensive stays increases. The cumulated e¤ect of
between and within di¤usion (graph 4b) is much larger than the between e¤ect alone (graph 4b’in
appendix B). However the latter is far from negligible : it amounts to about half of the cumulated
within-between impact. It is interesting to note that the positive shocks on costs are limited to a
speci…c place in the distribution. This result gives empirical support to a lump-sum payment for
AMI treated by angioplasty, under a prospective payment system.
5.2.2 The impact of the worsening of patients’epidemiological state
The descriptive analysis of our data revealed that AMI patients age slightly and that their
epidemiological state worsens : the number of secondary diagnoses increases rapidly. In addition,
the estimates show that age and indicators of coronary and non coronary secondary diagnoses
signi…cantly in‡uence the length of stays (table 2).
The e¤ect on the distribution of log(LOS) of changes in observable and unobservable patients’
characteristics is quite sizeable (graph 3c). It is huge in comparison with the impact of
technolo-gical progress di¤usion (graph 3b). The worsening of the epidemiolotechnolo-gical state of patients in 1997,
together with their aging, tend to lengthen hospital stays. Graph 3c’in appendix B shows that the
impact on length of stay of changes in patients’ unobservable heterogeneity is rather limited and
result in more variability of the length of the stay.
For costs, the change arising from shifts in patients’observable and unobservable characteristics
is quite sizeable and results in an increase in the average cost per stay (graph 4c). Given that
age and secondary diagnoses are not signi…cant in the cost equation, this e¤ect results from the
in‡uence of these variables on LOS, which is a signi…cant explanatory variable of the cost. Indeed,
we have just seen that a sharp increase in the length of stays occurred because of changes in patients’
characteristics.
5.2.3 The role of shifts in LOS behavior
Our results show that between 1994 and 1997 hospital costs were subject to two positive shocks :
di¤usion of technological progress and worsening of patients’epidemiological state. The combined
e¤ect of these two factors leads to a sizeable shock on cost distribution, which is much larger than
the total change in cost distribution observed between 1994 and 1997 (compare graphs 4b and 4c to
graph 4a). In fact, costs in the French public hospitals were limited by their budgets. Nonetheless,
they were able to carry out rapid di¤usion of costly innovative procedures, despite two unfavorable
conditions : cost containment and the worsening state of patients.
How did hospitals manage to do this ? They sharply reduced their length of stay. Indeed, the most
marked change that occurred during the period was a change in the coe¢ cients of the LOS equation
between 1994 and 1997, which induced a tendency to shorten stays. More precisely, the results of
the estimates (see subsection 3.2) show that there is a substantial reduction in the constant of
equation (3) between 1994 and 1997 : -22.5 %. In addition, being assigned to an innovative hospital
has a signi…cant positive in‡uence on the length of the stay in 1994, which becomes negative in
1997. The impact of these behavior changes on the Log(LOS) distribution is represented by graph
3d.
Graphs 3a-d show changes in the Log(LOS) distribution and the main shocks which a¤ected
this distribution between 1994 and 1997. Overall, length of stays has shortened (graph 3a).
Decom-position of this change into its main components shows that the impact of technological progress
(graph 3c). However, these two e¤ects taken together are smaller than the very large impact of
behavior change, represented in graph 3d. This negative e¤ect more than o¤sets the impact of the
worsening of patients’state.
This change in hospital behavior as regards length of stays induced cost savings. To evaluate
these savings, we simulated the cost distribution in the year 1994, with the patients observed in
1994, but with the behavior estimated in 1997 as regards exclusively the length of stays. In other
words, we simulated the counterfactual distribution, denoted 0:1(LOS), which gives the distribution
of the log costs of stay that would be observed if the patients observed in 1994 had their lengths
of stays determined by the behaviors estimated in 1997, all other behaviors being equal to those
estimated for 1994, as regards assignment to innovative hospitals, treatment by angioplasty and
levels of costs.19 The di¤erence : d
0:1(LOS) = 0:1(LOS) 0 is displayed in graph 4d. It gives the
savings in costs due to changes in the coe¢ cients of the length of stay function. This graph reveals
the magnitude of the cost savings induced by change in LOS behavior.
Graphs 4a-d show changes in the cost distribution and of main shocks that occurred between
1994 and 1997. The overall change is a rather limited rise in costs, linked to the small increase in
global budgets (graph 4a). Decomposition of this change into its main components shows that (i)
the impact of technological progress di¤usion is positive and sizeable (graph 4b) ; (ii) the impact
of changes in patient characteristics is positive and even larger (graph 4c) ; (iii) the saving e¤ect of
shifts in the coe¢ cients of the length of stay equation (graph 4d) is larger and more than o¤sets
the e¤ects on costs of the di¤usion of innovative procedures (graph 4b). On the whole, this last and
negative e¤ect partially o¤sets the cumulated impact of the technological progress di¤usion and of
the worsening of the patients’state : the overall rise in costs is limited.
How did hospitals succeed in shortening the length of stays ? Graph 5 allows us to examine more
thoroughly the changes that occurred in the LOS distribution. We have seen (graphs 3c-d) that
this distribution was subject to two main shocks : the worsening state of patients and changes in
behavior. The lines corresponding to these two e¤ects are superimposed on graph 5, together with
a vertical line which represents the …rst quartile of the length of stays in the year 1994. The e¤ect of
1 9
0:1(LOS)is de…ned by 0:1(LOS)= x0i0; i0; (B0; D0; d1; a1; p1; c1; 0; 0; 0; 0; 0) :
the shortening of the stays due to the changes in LOS behavior takes place around the …rst quartile,
i.e. more on the left of the distribution in comparison to the lengthening of stays due to changes
in patient characteristics. This result shows that hospitals concentrate their stay shortening e¤ort
on patients situated at the bottom of the length of stay distribution, who are likely to be patients
without complications. This strong shortening of stays might entail risks for such patients.
6
Conclusion
Between 1994 and 1997, hospitals faced two main causes of rises in costs : on the one hand,
di¤usion of technological progress, with increasing use of costly innovative procedures such as
an-gioplasty ; on the other hand, patients’epidemiological state worsened, since they became older and
had more secondary diagnoses. These two factors induced shocks in cost distributions.
During the same period, French public hospitals were …nanced by a global budget, and their
budgets increased very slowly. Hence, growth in overall average costs was limited. However,
inter-national comparisons show that di¤usion of technological progress for AMI treatment is similar
in France and in comparable countries (TECH (2001)). How did French hospitals deal with their
…nancial constraints ?
The speci…cation and estimation of a model describing angioplasty di¤usion and explaining the
cost and length of stays allowed us to perform decompositions of the average changes that occurred
between 1994 and 1997. Our results show that hopitals shortened stay duration to create savings
in order to compensate for the extra cost arising from the increasing use of angioplasty. However,
these changes did not a¤ect all patients uniformly. Our analysis shows that stays were shortened
especially for patients at the bottom of the distribution. This large reduction in the length of stays
for patients with few complications appears to have enabled hospitals to …nance the di¤usion of
angioplasty, despite a budget shortage. Such a strategy cannot be sustained in the long run without
jeopardizing the quality of care.
Turning to the issue of technological progress, it is remarkable to observe how hospitals got
round the …nancial di¢ culty to maintain a rather high pace in the adoption and use of angioplasty.
7
References
Bourguignon, F., Fournier M. and M. Gurgand M., (2001) ”Fast development with a stable
income distribution : Taiwan, 1975-1994”, Review of Income and Wealth, 47(2), 139-63
Bourguignon, F., Ferreira, F. H. G. and Leite, P. G. (2002), ”Beyond Oaxaca-Blinder :
Ac-counting for Di¤erences in Household Income Distribution Across Countries”, Working paper Delta
n 2002-04
Cutler D. and McClellan M. (1996) "The Determinants of Technological Change in Heart Attack
Treatment." NBER Working Paper # 5751
Cutler D, McClellan M., Newhouse J. P. and Remler Dahlia (1998) Cutler D, McClellan M.,
Newhouse J. P. and Remler Dahlia (1998) "Are Medical Prices Falling ?" Quarterly Journal of
Economics, 113(4), 991-1024.
Delattre E. , Dormont B., McClellan M. and Milcent C. (2002) "Systèmes de tari…cation et
évolutions de la variabilité des coûts hospitaliers en France et aux Etats-Unis" in La tari…cation à
la pathologie : les leçons de l’expérience étrangère, Dossiers Solidarité et Santé, La Documentation
française.
DiNardo, J. , Fortin N. M. and Lemieux T. (1996) ”Labor market institutions and the
distribu-tion of wages, 1973-1992 : a semiparametric approach”, Econometrica, Vol. 64, n 5; pp 1001-1044.
Dormont B. and Milcent C. (2003), ”How to Regulate Heterogenous Hospitals”, Working Paper
Thema, n 2003-14, Journal of Economics and Management Strategy, forthcoming, 2005.
Ho V. (2002), ”Learning and the evolution of medical technologies : the di¤usion of coronary
angioplasty”, Journal of Health Economics, Vol. 21, pp 873-885
Jacobzone, S., Dormont, B. and Durand Zaleski, I., (2002), ”Technological Change in Heart
Attack Care in France : Causes and Consequences.” In Technological Change in Health Care. A
Global Analysis of Heart Attack, Mark B. McClellan and Daniel B. Kessler Eds. The University of
Michigan Press.
Juhn, C., Murphy, K. M. and Pierce, B. (1993), ”Wage Inequality and the Rise in Returns to
Skill”, The Journal of Political Economy, Vol. 101, Issue 3 : pp 410-442.
Kesteloot, K. and Penninckx, F. (1993), “The costs and e¤ects of open versus laparascopic
McClellan, M. et Newhouse, J. P. (1997), “The marginal cost-e¤ectiveness of medical technology :
A panel instrumental-variables approach”, Journal of Econometrics, vol 77 : pp 39-64
Milcent C. (2003) ” Ownership, System of reimbursement and Mortality rate relationships”,
Working Paper Delta, n 2003, Health Economics, 2005, forthcoming.
Oaxaca, R. (1973) "Male-Female Wage Di¤erentials in Urban Labor Markets", International
Economic Review, 14, 693-709.
The Technological Change in Health Care (TECH) Research Network (2001). ” Technological
Change Around The World : Evidence From Heart Attack Care. ”, Health A¤airs. ; 20(3) :25-42).
Van de Ven W. P. M. and Van Pragg B. M. S. (1981), ” The demand for deductible in private
Table 1: Basic features of the data
1994 1997
Number of stays 2,269 3,412
Gender (proportion of female) 29.7 31.2
Average age (year) 67 67
Male age distribution 40-64 65-74 75-84 85 and over 50.9 29.5 15.1 4.5 51.7 27.4 16.2 4.7 Female age distribution
40-64 65-74 75-84 85 and over 17.5 31.2 33.9 17.4 16.0 26.9 34.8 22.3 Number of secondary diagnoses (percentage):
None 26.6 10.6
1-3 57.7 51.8
Over 3 15.7 37.6
At least one non coronary secondary diagnosis
(percentage) 45.0 71.1
At least one coronary secondary diagnosis
(percentage) 59.1 70.7
Patient’s characteristics
Angioplasty (percentage)
4.8 15.6 Average LOS (days) 11.6 9.7 (Standard deviation) (7.1) (7.0)
Stay without angioplasty 11.6 9.9
(Standard deviation) (7.1) (7.0)
Stay with angioplasty 11.8 8.5
Length of stay
(Standard deviation) (6.1) (6.8)
Average cost (euros) 4,361.7 4,611.2 (Standard deviation) (2,980.0) (3,088.9)
Stay without angioplasty 4,252.7 4,334.5
(Standard deviation) (2,947.9) (2,914.5)
Stay with angioplasty 6,542.7 6,109.3
Cost
(Standard deviation) (2,784.8) (3,546.9)
Figure 1: PTCA diffusion (Between and Within) 0% 5% 10% 15% 20% 25% 30% 35% 40% % of innovative hospitals (Between hospitals diffusion)
% of innovative procedure used within innovative hospitals (Within
hospitals diffusion)
1994 1997
Graph 1: Distribution of the logarithm of the length of stay in 1994 (Λ0) and 1997 (Λ1) 0 .2 .4 .6 .8 Density 0 1 2 3 4 5 ldstot
log (LOS), 1994 log (LOS), 1997
PMSI database: 2,269 and 3,412 AMI stays in 1994 and 1997
Graph 1a: Change in the distribution between 1994 and 1997 (Λ1-Λ0)
Diff . ln(LOS ),97-94 ldstot Diff. ln(LOS),97-94 0 .5 1 1.5 2 2.5 3 3.5 4 -.4 -.35 -.3 -.25 -.2 -.15 -.1 -.05 0 .05 .1 .15 .2 .25 .3 .35 .4
Graph 2: Distribution of the logarithm of the cost of stay in 1994 (Γ0) and 1997 (Γ1) 0 .2 .4 .6 .8 D ensi ty 6 8 10 12 14 lctot log(C), 1994 log(C), 1997
PMSI database: 2,269 and 3,412 AMI stays in 1994 and 1997
Graph 2a: Change in the distribution between 1994 and 1997 (Γ1-Γ0)
Diff. ln(Cost),97-9 4 lctot Diff. ln(Cost),97-94 4 5 6 7 8 9 10 11 -.2 -.15 -.1 -.05 0 .05 .1 .15 .2
Table 2: Estimated coefficients for Equations (3) Length of stay and (4) Cost Log(LOS) Log(C) 94 97 94 97 Non coronary secondary diagnosis 0.314** (0.029) 0.074** (0.029) 0.006 (0.050) 0.049 (0.034) Coronary secondary diagnosis 0.163** (0.031) 0.332** (0.031) 0.052 (0.040) 0.044 (0.053) Log(LOS) Hausman Test for
H0 : exogeneity -0.899** (0.136) H0rejected (0.036) 0.849** (0.096) H0rejected (0.001) Innovative Hospital
Hausman Test for
H0 : exogeneity 0.129** (0.031) H0 non rejected (0.050) -0.139** (0.032) H0 non rejected (0.848) 0.278** (0.030) H0 non rejected (0.437) 0.174** (0.024) H0 non rejected (0.609) Angioplasty
Hausman Test for
H0 : exogeneity -0.028 (0.061) H0 non rejected (0.269) -0.008 (0.047) H0 non rejected (0.163) 0.301** (0.068) H0 non rejected (0.103) 0.389 (0.429)1 H0rejected (0.022) **: The estimated coefficient is significant at 1 % level. *: The estimated coefficient is significant at 5 % level.
Models also included patient characteristics.
1
The null hypothesis being rejected, Angioplasty is instrumented in the regression. In this cases the standard error is consistently estimated by bootstrap (1000 replications).
Table 3: Average changes between 1994 and 1997: first decomposition
Equation Total changes 1994 – 1997 (%) (1) Changes due to shifts in coefficients (2) Changes due to shifts in explanatory variables (3) (1) Assignment to an innovative hospital + 6.8 + 2.8 (+ 6.5) + 4.0 (+ 0.3) (2) Treatment by an angioplasty + 32.0 + 32.0 (+ 27.0) 0.0 (+ 5.0) (3) Length of stay - 24.7 - 31.2 (- 35.36) + 6.55 (+ 10.68) (4) Cost of stay + 5.0 - 2.9 (- 10.1) + 7.9 (+ 15.1) The decompositions given here take the year 1994 as a reference for the explanatory variables. In parenthes es are given the decompositions resulting from the other possible computation, which takes the year 1997 as a reference for the explanatory variables.
Graphs 3 :
Distribution of the log(LOS): overall change and main shocks between 1994 and 1997. Graph 3a: Overall change in the distribution between 1994 and 1997 (Λ1-Λ0)
Diff. ln( LOS) ,97-94 ldstot Diff. ln(LOS),97-94 0 .5 1 1.5 2 2.5 3 3.5 4 -.4 -.35 -.3 -.25 -.2 -.15 -.1 -.05 0 .05 .1 .15 .2 .25 .3 .35 .4
Graph 3b: Cumulated effect of between and within diffusion on the distribution of ln(LOS)
D iff. ln( LOS) ,94.97(B,D)-94 ldstot Diff. ln(LOS),94.97(B,D) -94 0 .5 1 1.5 2 2.5 3 3.5 4 -.4 -.35 -.3 -.25 -.2 -.15 -.1 -.05 0 .05 .1 .15 .2 .25 .3 .35 .4
Graph 3c: Effect of changes in unobservable heterogeneity and observable patients’ characteristics on the distribution of ln(LOS)
Di ff. ln(LO S )(94.97(xu)-9 4) ldstot Diff. ln( LOS)(94.97(xu)-94) 0 .5 1 1.5 2 2.5 3 3.5 4 -.4 -.35 -.3 -.25 -.2 -.15 -.1 -.05 0 .05 .1 .15 .2 .25 .3 .35 .4
Graph 3d: Change in the distribution due to shifts in the coefficients
D iff. ln( LO S),94.9 7-94 ldstot Diff. ln(LOS),94.97-94 0 .5 1 1.5 2 2.5 3 3.5 4 -.4 -.35 -.3 -.25 -.2 -.15 -.1 -.05 0 .05 .1 .15 .2 .25 .3 .35 .4
Graphs 4 :
Distribution of log(Costs): overall change and main shocks between 1994 and 1997. Graph 4a: Overall change in the distribution between 1994 and 1997 (Γ1-Γ0)
Diff. ln(Cost),97-9 4 lctot Diff. ln(Cost),97-94 4 5 6 7 8 9 10 11 -.2 -.15 -.1 -.05 0 .05 .1 .15 .2
Graph 4b: Cumulated effect of between and within diffusion on the distribution of ln(cost)
D iff. ln(Co st ),94. 97( B,D)-9 4 lctot Diff. ln(Cost),94.97(B,D)-94 4 5 6 7 8 9 10 11 -.2 -.15 -.1 -.05 0 .05 .1 .15 .2
Graph 4c: Effect of changes in unobservable heterogeneity and observable patients’ characteristics on the distribution of ln(cost)
D iff . l n (C o st), (94 .9 7 (xu )-94 ) lctot Diff. ln(Cost),(94.97(xu)-94) 4 5 6 7 8 9 10 11 -.2 -.15 -.1 -.05 0 .05 .1 .15 .2
Graph 4d: Savings in cost due to changes in LOS behavior between 1994 and 1997
Diff. ln (C ost),94.9 7(LOS )-94 lctot Diff. ln(Cost),94.97(LOS)-94 4 5 6 7 8 9 10 11 -.2 -.15 -.1 -.05 0 .05 .1 .15 .2
Graph 5: LOS distribution : comparison of effect of changes in behavior and effect of changes in patients' characteristics.
Vertical line : first quartile of ln(LOS), 94.
-.4 -.3 -.2 -.1 -2.78e-17 .1 .2 .3 .4 Di ff. ln(LO S ), 94.97-9 4/Di ff. ln( LOS) (94.97( xu) -94) 0 .5 1 1.5 2 2.5 3 3.5 4 ldstot
Diff. ln(LOS),94.97-94 Diff. ln(LOS)(94.97(xu)-94)
Appendix A Table 4:
Overall changes between 1994 and 1997: checking for the robustness of the results
Equation Total changes 1994 – 1997 (%) (1) Changes due to shifts in coefficients (2) Changes due to shifts in explanatory variables (3)
Using OLS instead of IV to estimate equation (4) (4) Cost of stay + 5.0 - 4.6 (- 8.6) + 9.6 (+ 13.6) Omitting secundary
diagnoses (3)’ Length of stay - 24.7
- 26.1 (- 27.2)
+ 1.5 (+ 2.6) The decompositions given here take the year 1994 as a reference for the explanatory variables. In parentheses are given the decompositions resulting from the other possible computation, which takes the year 1997 as a reference for the explanatory variables.
Appendix B: Detailed results of the simulations
1) Effect of between hospital diffusion between 1994 and 1997 on the distributions of ln(LOS) and ln(cost). The cumulated effects of between and within diffusions are given in graphs 3b and 4b.
Graph 3b’
Effect of between hospital diffusion on the distribution of ln(LOS)
Graph 4b’
Effect of between hospital diffusion on the distribution of ln(cost) D iff. ln( LO S), 94 .97 (B)-94 ldstot Diff. ln(LOS),94.97(B)-94 0 .5 1 1.5 2 2.5 3 3.5 4 -.4 -.35 -.3 -.25 -.2 -.15 -.1 -.05 0 .05 .1 .15 .2 .25 .3 .35 .4 Dif f. ln(C os t), 94.97 (B )-94 lctot Diff. ln(Cost),94.97(B)-94 4 5 6 7 8 9 10 11 -.2 -.15 -.1 -.05 0 .05 .1 .15 .2
2) Effect of changes in patients’ unobservable heterogeneity between 1994 and 1997 on the distributions of ln(los) and ln(cost). The cumulated effects of changes in unobservable heterogeneity and observable patients’ characteristics are given in graphs 3c and 4c.
Graph 3c’
Effect of changes in patients’ unobservable heterogeneity on the distribution of ln(LOS)
Graph 4c’
Effect of changes in patients’ unobservable heterogeneity on the distribution of ln(cost)
Dif f. ln( LO S)( 94 .97( u)-94 ) ldstot Diff. ln(LOS)(94.97(u)-94) 0 .5 1 1.5 2 2.5 3 3.5 4 -.4 -.35 -.3 -.25 -.2 -.15 -.1 -.05 0 .05 .1 .15 .2 .25 .3 .35 .4 D iff . l n( Cos t), (94. 97( u) -9 4) lctot Diff. ln(Cost),(94.97(u)-94) 4 5 6 7 8 9 10 11 -.2 -.15 -.1 -.05 0 .05 .1 .15 .2