Statistical and non-statistical reactions in energy selected
fluoromethane ions
Karl-Michael Weitzel a, Felix Güthe a, Joachim Mähnert a, R. Locht b, Helmut Baumgärtel a a
Institut für Physikalische und Theoretische Chemie, Freie Universität Berlin, Takustrasse 3, D-14195 Berlin, Germany
b
Département de Chimie Générale et de Chimie Physique, Batiment B6, Uniυersité de Liège, Sart-Tilman par 4000, Liège I, Belgium
Abstract
The unimolecular reactions of the fluoromethane ion have been investigated by the threshold photoelectron photoion coincidence technique (TPEPICO). The breakdown curves have been measured in the energy range between the adiabatic ionization potential of 12.53 eV and 21 eV. In this energy range the formation of the CH2F + , CHF+, CH2 + , CH3 +
, and CF+ fragment ions is observed. The appearance energies (AE) for these ions at 300 K are 13.2, 13.91, 13.93, 14.51 and < 17.7 eV respectively. The 0 K threshold energy for the formation of CH2F+ ions is 13.37 eV. Two different pathways for the unimolecular reaction of the
fluoromethane ion can be distinguished. The reaction proceeding through the electronic ground state of the ion is entirely statistical. In contrast to this the reaction occurring through the first electronic excited state shows non-statistical behaviour. The two pathways are distinguished via the kinetic energy released in the respective dissociation channels. While all thermochemically allowed reaction channels are observed on the ion ground state potential, the first excited state seems to decay predominantly by F loss reaction.
1. Introduction
Hydrofluorocarbon (HFC) compounds have received considerable interest in recent years due to their potential role as a replacement [1] for chlorofluoro(hydro)carbons (CFCs). The relevant property of these compounds is the chemical reactivity connected to the depletion of the ozone layer [2]. We are currently interested in the properties and the reaction behaviour of simple hydrofluorocarbon ions which might have some implications to processes in the ionosphere. Some elementary reactions of these ions have been found to deviate from the expected statistical behaviour under certain excitation conditions. This has often been referred to as the isolated state [3] reaction. In this work we report on a detailed investigation of the unimolecular reactions of energy selected fluoromethane ions, the simplest fluorohydrocarbon. The aim of this work is to obtain a distinct picture of the thermochemistry of the relevant species and of the dynamics of the underlying reactions.
The electron configuration of neutral fluoromethane is commonly described as (1e4) (3a12) (2e4). In
order of increasing energy the character of these molecular orbitals is predominantly of F (1e4), C-F (3a12), and
CH3 (2e 4
) type. Removing one electron from these orbitals leads to the fluoromethane cation in the three lowest electronic states: X (2E), A (2A1), and B (
2
E). The assignment of the X, A, and B state has been derived from the He(I) photoelectron spectrum (PES) [4-6] which has been measured by several groups. This He(I) PES comprises two major bands, one starting at 12.5 eV corresponding to the X state and one at 16.3 eV corresponding to the A and the B state. There is general agreement on the assignment of the X band, however, the assignment of the A and B bands is somewhat ambiguous. The analysis of the He(I) PES is further complicated by the fact that the ion ground state (2E in point group C
3v) is subject to a Jahn-Teller distortion. The
vertical ionization potentials (IP) of these two Jahn-Teller components have been observed [6] at 13.0 and 13.6 eV. The first band in the He(I) PES exhibits a clear vibrational structure while the upper bands do not.
The chemical reactions of fluoromethane ions have first been investigated by electron impact ionization. Dibeler and Reese [7] reported the threshold energies for the formation of the CH3F
+
parent ion (12.6 eV) and the CH3
+
ion formed by F loss. They observed two different types of CH3 +
ions: one with thermal and one with very high kinetic energy. The threshold energies were 14.7 and 16.3 eV respectively. The origin of the two different processes was not resolved in that work. At that time the only information on the electronic states of the fluoromethane ion was derived from electron impact ionization efficiency measurements. In that work [89] three different ionic states were assigned at about 12.85, 14.1 and 16.9 eV. Tsuda et al. [9] reported a value of 14.5 eV for the appearance energy (AE) of the CH3+ ion by F loss reaction. A mass spectrometric study of fluoromethane
employing photoionization was carried out by Krauss et al. [10]. In that work the H loss reaction from fluoromethane cations was observed with an AE of 13.37 eV and the F loss reaction with an AE of 16.25 eV. The two reaction channels mentioned so far, i.e. the H loss and the F loss reaction were also observed in the only photoelectron photoion coincidence experiment [11] reported to date. In this energetic PEPICO experiment the molecules were ionized by He(I) radiation. The PES of Eland et al. [11] is in general agreement with the better
resolved spectrum obtained by Karlsson et al. [6]. In the region of the excited A and B states Eland et al. [11] mainly observed CH3
+
ions. From a time of flight analysis of the CH3 +
ions it was concluded that about 90% of the available energy was released into translational energy of the F and CH3+ products. CH3
+
ions with thermal energy, however, were not observed in that study.
The kinetic energy released in the F loss reaction from fluoromethane ions has been investigated by Locht et al. in a series of papers [12-14]. There electron impact ionization as well as fixed wavelength photoionization (HeI: 21.22 eV, NeI: 16.7-16.9 eV) was applied. The kinetic energy analysis of the CH3+ product
ions was performed by the retarding field technique. In all these studies two types of CH3 +
ions were observed, i.e. one with thermal and one with non-thermal kinetic energy. There is no doubt that the kinetically hot CH3
+
ions are associated with parent ions formed in one of the excited states. For the He(I) excitation source the kinetic energy distribution of the energetic CH3+ component extended to higher energies than for the Ne(I)
excitation. The important difference between the two excitation energies is that the Ne(I) line only allows access to roughly half of the Franck-Condon allowed region of the A and B bands in the PES which extends from about 16 to 17.5 eV. The He(I) excitation line on the other hand gives access to the entire A and B band. For the thermal CH3+ component the trend goes in the opposite direction. There the kinetic energy distribution extends to
higher energies for the less energetic Ne(I) excitation. From these investigations the origin of the thermal CH3 +
ions could not be assigned unambiguously particularly in the case of the He(I) excitation. It should be emphasized that the only resonant photoionization work carried out to that point [10] had not reported the F loss reaction, i.e. CH3+ formation in the region of 14.5 eV which is supposed to be the origin of the thermal CH3+ ions
according to electron impact ionization [9,14]. This discrepancy was removed by a resonant photoionization study by Locht et al. [15] where thermal CH3
+
ions were observed with a threshold energy of 14.5 eV. This investigation also revealed another reaction channel which had not been observed before, i.e. the HF loss reaction giving rise to CH2+ ions. The threshold energy for this reaction was determined to be 13.9 eV.
At this point a few questions remain. Only the kinetically hot CH3 +
ions have been observed in a study with energy selected parent ions [11]. Is it also possible to observe thermal CH3+ ions from energy selected
CH3F+ ions? Since the threshold for this process is supposed to be about 14.5 eV and thus falls into a
Franck-Condon gap in the PES it is not surprising that the He(I) PEPICO [11] experiment did not detect this process. To resolve this question it seems promising to apply a PEPICO technique based on resonant photoionization, i.e. the threshold photoelectron photoion coincidence (TPEPICO) technique [16, 17]. This experiment would allow us to measure the KER in the CH3+ ions as a function of the internal energy of the parent ions over the entire region
where the F loss reaction is observed. It could also address the question whether thermal and kinetically hot CH3 +
ions can be formed at the same internal energy of the parent ion. As far as the elementary reactions of the fluoromethane cation are concerned one reaction, i.e. the H2 loss, has not been reported in the studies mentioned
above. The only reports on this reaction channel that we are aware of are a charge transfer reaction study [18] of fluoromethane with Ar+ ions and a photoionization study of fluoromethane in the region of double ion-ization [19] above 20 eV. However, to our knowledge the appearance energy for this reaction has not been reported. 2. Experimental method
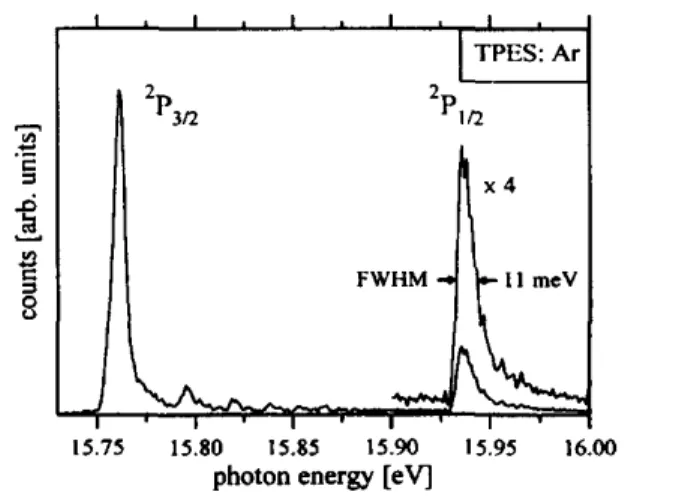
The unimolecular reactions of fluoromethane ions have been investigated by means of the threshold photoelectron photoion coincidence technique (TPEPICO) [16, 17]. Details of the experimental setup have been described previously [20]. Only a brief description will be given here. Molecules are introduced into the ion source of a TPEPICO spectrometer either in a room temperature effusive or in a cold supersonic beam. In the latter case pure fluoromethane is expanded at a stagnation pressure of 0.8 bar through a 70 µm nozzle. The molecular beam is skimmed 8 mm down stream from the nozzle. The sample is ionized by synchrotron radiation dispersed in a 3m normal incidence monochromator. All experiments were carried out at the 3m NIM1 beam line of the electron storage ring BESSY at Berlin. The ionization rate is kept low enabling us to measure the coincidence of one electron and one ion formed in a single ionization event. Electrons are energy selected in a 0 Volt analyser [21] and ions are detected in a linear time of flight mass spectrometer [22]. This coincidence experiment provides the basis for the energy selection of the ions. The ion source is operated at a static field of 27 V/cm. This represents a compromise between a high electron and ion kinetic energy resolution on the one hand and a reasonable collection efficiency for ions at very high kinetic energies on the other hand. The overall energy resolution including photon and electron energy was about 11 meV. This is the typical full width at half maximum (FWHM) of the 2P1/2 peak in the threshold photoelectron spectrum (TPES) of argon (see Fig. 1).
Fluoromethane has been purchased from Haereus with a purity of > 98%. It was used without purification. Small traces of impurities (CO2) were observed but did not interfere with our experiment.
Fig. 1. Threshold photoelectron spectrum (TPES) of argon. The FWHM of the 2Pl/2 state of 11 meV represents
the typical energy (photon + electron) resolution of the experiment.
3. Results and discussion
3.1. Threshold photoelectron spectrum
As a first step of our investigation we have measured the threshold photoelectron spectrum (TPES) of fluoromethane. As mentioned earlier the He(I) PES has been recorded by Karlsson et al. [6]. The well known difference between a TPES and a PES is that the former may contain contributions from autoionizing Rydberg states. In fact this is one important advantage of the technique applied in this work as will be shown in a later section. The TPES measured in the range from 12.5 eV to 14.5 eV is shown in Fig. 2. These data have been recorded in a pure molecular beam in order to reduce the possible influence of hot band transitions. As it turns out this spectrum does not significantly differ from the one recorded in an effusive beam at room temperature. This indicates that hot band transitions do not play an important role. The spectrum shown in Fig. 2 exhibits several progressions between 12.5 and 13.8 eV. The first peak at 12.53 ± 0.015 eV has been assigned to the 0-0 transition, i.e. the adiabatic IP. The error limits are a combination of the total energy resolution and the calibration uncertainty of the photon energies. The assignment of the vibrational progressions as indicated in Fig. 2 has been adopted from Karlsson et al. [6]. There is one progression of the v5 mode (nv5) with spacings of 160
meV. Furthermore there are several combination bands of this v5 progression with one quantum in the v3 mode
(starting at 12.61 eV), with one quantum in the v6 mode (starting at 12.64 eV) and another one with one quantum
in each v3 and v6 (starting at 12.73 eV). It should be pointed out that the vibrational structure as discussed above
corresponds to the ion in its lowest Jahn-Teller state [6]. In our experiment a discernible structure is not observed above 13.8 eV. It should be noted, however, that the corresponding He(I) PES does show vibrational structure up to about 14.1 eV. Most likely this difference is due to the fact that we have a contribution from autoionization in this experiment, which smears out any vibrational structure.
Fig. 2. Threshold photoelectron spectrum (TPES) of a pure molecular beam of fluoromethane in the region of the X band. The assignment is based on Ref. [6].
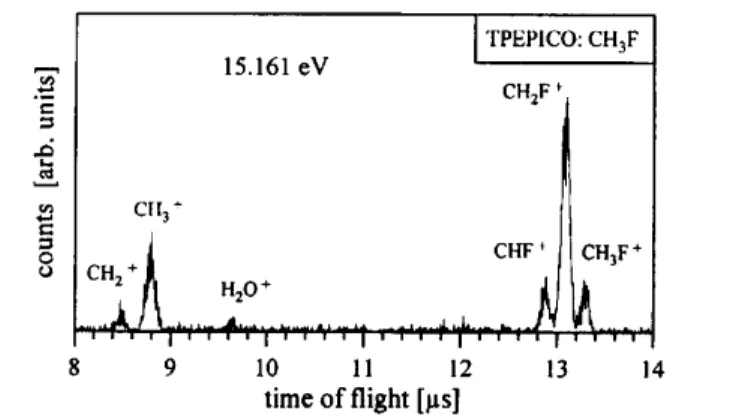
Fig. 3. TPEPICO-TOF mass spectrum of fluoromethane at 15.161 eV recorded at room temperature.
3.2. TPEPICO-TOF spectra and breakdown curves
We have investigated the unimolecular reactions of fluoromethane ions by recording the TPEPICO time of flight (TOF) spectra at excitation energies between 12.5 and 20.5 eV. A typical TPEPICO-TOF spectrum recorded at 15.161 eV is shown in Fig. 3. At this photon energy obviously several reaction channels are accessible. Here we observe the H loss, H2 loss, F loss, and HF loss reactions. The yield of any particular ion
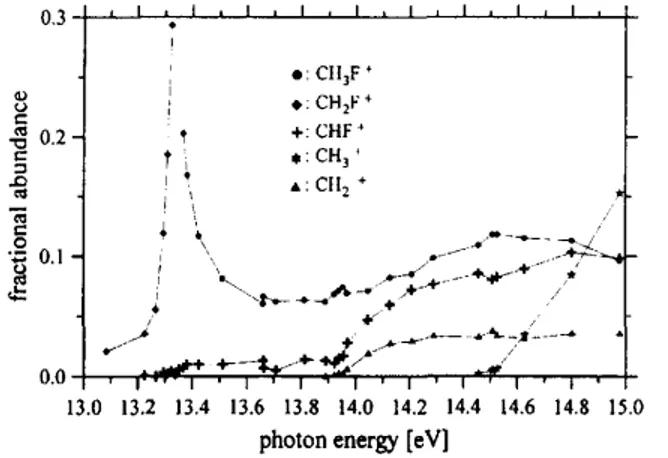
observed in such a TPEPICO-TOF spectrum normalized to the total coincidence ion yield constitutes the fractional abundance of that ion. The fractional abundance of all ions observed is plotted in a breakdown diagram (Fig. 4A) as a function of the photon energy. In the upper part of this picture the entire TPES of fluoromethane is also shown for comparison (Fig. 4B). This TPES comprises the two bands also known from the He(I) PES [6], i.e. the X band with a maximum at 13.5 eV and the A and B bands with a maximum at 17 eV. In contrast to the He(I) PES, however, we do observe a non-vanishing signal in the region between the two bands in the TPES. This signal is due to resonant autoionization which does not contribute to the He(I) PES. As mentioned above this difference reflects the advantage of resonant photoionization over He(I) photoionization for investigating Fig. 4. Lower part (4A): Breakdown curves of fluoromethane at room temperature as derived from the TPEPICO-TOF spectra. Upper part (4B): Complete TPES of fluoromethane in the energy range covered in this work.
reactions in this energy range. Note that all data shown in Fig. 4 have been recorded at room temperature. The only ion observed between the IP and the first fragmentation channel is the parent ion. This indicates that stray light or second order light from the monochromator do not play a major role in our experiments. Starting at about 13.2 eV the fractional abundance of the parent ion begins to decrease due to the loss of H atoms. The fractional abundance of the corresponding daughter ion CH2F+ increases from 0 to about 0.9 at 13.6 eV. The
appearance energy (AE) for the CH2F +
ion is determined to be 13.20 ± 0.08 eV. In this context the appearance energy stands for the photon energy at which a non-vanishing ion signal is observed at the applied temperature,
i.e. 300 K. It is very difficult to translate such an AE to a molecular dissociation energy. The reason is that the thermal Boltzmann distribution of the neutral molecules smears out any ion yield measurement (this holds true for coincidence experiments). The smooth increase in the fractional abundance is particularly severe in the case of the lowest reaction channel. This is accounted for by the large error limits stated above for this AE. The increase of the fractional abundance is significantly sharper in the case of the higher reaction channels. At least for the first reaction channel the alternative approach to the dissociation energy is to analyse the cross-over point in the breakdown curve at which the intensity of parent and daughter ions is equal. For the H loss reaction the cross-over point at 300 K is observed at 13.34 ± 0.015 eV where the error limits are determined by the overall energy resolution and the precision of the wavelength calibration. This cross-over point is basically independent of the sensitivity of the measurement and it contains a well defined influence of the thermal energy of the parent molecules. The dissociation energy of the molecular ion at 0 K can be derived from this number by taking into account this thermal energy of the molecules. At a given temperature the cross-over point occurs at that energy where half of the parent molecules have an internal energy above the dissociation limit. The relevant quantity here is the median internal energy of the molecules, i.e. that which divides the area under the thermal probability distribution into two identical parts. For molecules of this size [20] this median internal energy and thus the expected shift of the cross-over point in converting from 300 to 0 K is roughly 3/4 of the corresponding average rovibrational energy. Since the average rovibrational energy as calculated from the frequencies of the neutral molecule [23] is 41 meV at room temperature the cross-over energy for 0 K would be expected at 13.37 ± 0.02 eV. This calculation is based on the assumption that all three external degrees of rotation contribute to the dissociation [24] which is expected for a simple bond fission. This cross-over energy corresponds to a dissociation energy of the ion at 0 K of 0.84 ± 0.02 eV.
In going to higher photon energy the next reaction channels observed are the H2 loss and the HF loss
reaction. For the sake of better illustration the relevant part of the breakdown curve is plotted enlarged in Fig. 5. Fig. 5. Enlarged view of the breakdown curves of fluoromethane in the range between 13 and 15 eV.
The yield of CHF+ and CH2 +
ions increases significantly beyond 13.9 eV. The threshold energies for the formation of these ions as determined by linear extrapolation are 13.91 ± 0.05 and 13.93 ± 0.05 eV respectively. In this case the error limits are mainly determined by the uncertainty of the extrapolation. These values have not been corrected for thermal energy of the fluoromethane molecules. At this time it is not known how the thermal rotational energy of the parent molecule contributes to the experimental appearance energy for these reactions. It might be worthwhile to point out that we also do not know the internal energy with which these fragments are formed at the threshold. Since both reactions are formally 1,1 geminal eliminations one expects a significant barrier for the reverse reaction which suggests that in the unimolecular fragmentation the products are formed with a non-vanishing internal energy. The question of the actual internal energy of the parent molecule and the fragments at the experimentally determined AE imposes a fundamental problem in comparing these numbers to thermochemical data. We will come back to this problem at the end of this section. A very weak signal is observed in the TOF range of the CHF+ ion between 13.3 and 13.9 eV. This signal accounts for a fractional abundance of about 1%. However this signal is most likely caused by the tail of the CH2F
+
ion TOF distribution due to the experimental mass resolution. For the experimental conditions mentioned above the precision in determining relative ion intensities of neighbouring masses is about 2% in the region of the parent ion. The mass resolution can easily be increased by increasing the draw out field in the ionization region, however, only at the cost of electron energy resolution. The problem with the nominal mass resolution was also encountered in distinguishing between the CH3
+
ion (F loss) and the CH2 +
ion (HF loss). In that case the problem was caused by a very large kinetic energy released (KER) in the F loss reaction above 16 eV. The analysis of this KER will be presented in Section 3.3. The breakdown curves (Fig. 4) do not show the HF loss reaction above about 16.5 eV.
This observation has been confirmed by recording the breakdown curves at draw out fields of 50 and 100 V/cm which lead to significantly enhanced mass resolution.
The fractional abundance of the CHF+ and CH2+ ions is smaller than 0.15 each over the entire range of
excitation energy covered in this work. This implies that the specific rate constant for the formation of these ions is significantly smaller than for the other reaction channels. Between about 13.5 and 15.5 eV the CH2F
+
ion dominates the TPEPICO mass spectra. Above 14.5 eV we observe the formation of CH3+ ions, i.e. the F loss
reaction. The threshold energy for the formation of this ion determined by extrapolation is 14.51 ± 0.03 eV. The fractional abundance of CH3
+
ions increases almost linearly up to 15.75 eV and even steeper above that photon energy. Apparently the reaction behaviour of the fluoromethane ions changes in this region. At the same time the fractional abundance of the CH2F
+
ion decreases monotonically between 13.5 and ~ 18 eV. It should also be pointed out that the fractional abundance of the parent ion varies between 10 and 15% in the energy range from 13.5 to almost 20 eV. This parent ion signal is in part due to the limited resolution of our electron energy analyser. It is also possible that a small part of this parent ion signal is caused by stray light. However, the absolute amount of parent ions together with the variation in intensity observed indicate that some of these ions might be formed via another process. This could be the fluorescence of fluoromethane ions which would lead to stable parent ions. In order to test this possibility we have performed preliminary fluorescence excitation experiments. There we did indeed observe fluorescence after excitation of fluoromethane. The major part of the fluorescence signal observed does not seem to correspond to the fluorescence of the fluoromethane ion, however, this point requires a more detailed investigation. The experimental technique which we believe would provide an unambiguous answer is a threshold photoelectron fluorescence photon coincidence experiment (TPEFCO). In the breakdown curves which we have recorded at the draw out fields of 50 and 100 V/cm we observed yet another fragment ion, i.e. the CF+ fragment which might be formed by consecutive H and H2 loss. The lowest photon
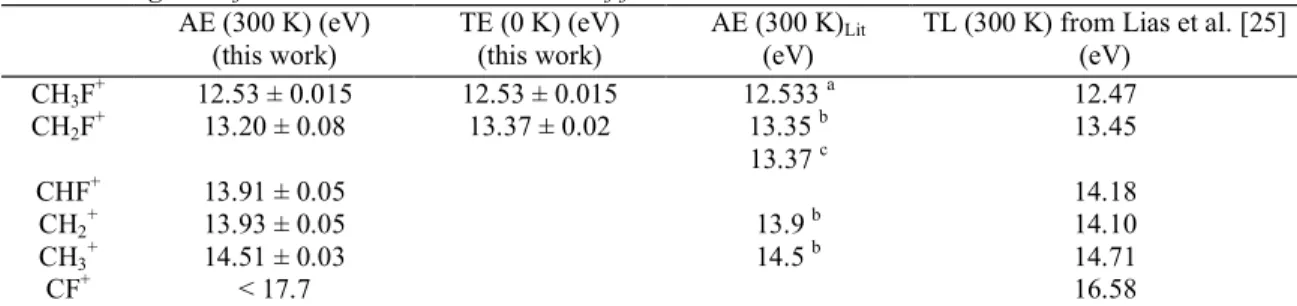
energy at which the CF+ ion was observed is 17.7 eV, the highest fractional abundance is 4%. The appearance energies/threshold energies determined in this work are summarized in Table 1 and compared with AE measurements from the literature. We have pointed out earlier that a comparison of our data with thermochemical reference data [25] is difficult since the actual thermal energy of the parent ion and the fragment ion at the observed AE is in general not known precisely. However, we want to include the thermochemical limits at 300 K as obtained from Lias et al. [25] for the sake of completeness. The latter data correspond to the parent and the product ions at 300 K. In general our results agree well with the data from the literature. The threshold energy for the formation of CH2F
+
ions is observed 80 meV below the thermochemical limit reported by Lias et al. [25]. In our experiment the CH2F+ ions are formed without internal energy at the threshold of the
reaction since it is a simple bond fission. Therefore the discrepancy mentioned above is basically due to the internal (vibrational + rotational) energy of the CH2F
+
ions at 300 K. The AE of the CHF+ ion, i.e. the H2 loss
reaction, and of the CF+, i.e. formally H + H2 loss, have been determined for the first time in this work. All
threshold energies except for the CF+ formation are observed below the first excited A state. Thus all
thermochemically possible processes are in fact observed from the ion ground state. In the region of the excited A and B states, however, the fractional abundance of the CH3
+
ion becomes larger than 0.8. This indicates that the parent ions decay predominantly by the F loss reaction in this energy range. From the TPES we certainly can not distinguish between the A and the B states. On the other hand the almost exclusive F loss reaction is considered to be in line with the C-F character of the singly occupied MO [6,11] in the A state. The only other report on the CF+ ion that we are aware of is a photoionization study by Masuoka and Koyano [19] who observed this ion at the lowest excitation energy of 20 eV applied in their work.
Table 1 Energetics of the unimolecular dissociation of fluoromethane ions AE (300 K) (eV) (this work) TE (0 K) (eV) (this work) AE (300 K)Lit (eV)
TL (300 K) from Lias et al. [25] (eV) CH3F + 12.53 ± 0.015 12.53 ± 0.015 12.533 a 12.47 CH2F + 13.20 ± 0.08 13.37 ± 0.02 13.35 b 13.45 13.37 c CHF+ 13.91 ± 0.05 14.18 CH2 + 13.93 ± 0.05 13.9 b 14.10 CH3 + 14.51 ± 0.03 14.5 b 14.71 CF+ < 17.7 16.58
AE is the appearance energy at a given temperature, TE is the threshold energy and TL is the thermochemical limit. Note that the AE and TE data given for the parent ion correspond to the 0-0 transition in the TPES and PES. The error limits are discussed in the text.
a Ref. [6]. b Ref. [15]. c Ref. [10].
3.3. KER analysis
In the previous section we discussed the breakdown curves of the fluoromethane ion which indicated a possible change in the reaction behaviour around 16 eV. This is the region where the first excited state of the fluoromethane ion can be populated as apparent from the TPES (Fig. 4B). In this section we will present results on the kinetic energy released in the F loss reaction from energy selected fluoromethane ions as a function of the excitation energy. In our experiment the kinetic energy released in the dissociation of an ion is determined from the ion TPEPICO-TOF distribution. As mentioned earlier the ion spectrometer is setup in such a way that the width of the ion distribution in the time of flight domain is limited by the kinetic energy of this ion. The average total kinetic energy released in the reaction is then given by Eq. (1) which has been investigated by Stockbauer [26]. This equation holds true for isotropic reactions with a thermal kinetic energy release, i.e. one which peaks at zero.
Here Mp, Md, and Mn are the masses of the parent ion, the daughter ion and the neutral fragment.
FWHMt is the full width at half maximum of the daughter ion signal in the time of flight domain. E is the electric
field, q is the charge of the ion, and KEp is the kinetic energy of the parent ion. This total average KER is under
most practical conditions dominated by the first term. The second term takes into account the contribution of the parent thermal translational energy to the TOF distribution of the daughter ion. The total KER is of course distributed over all fragments. If the KER is non-thermal, i.e. the kinetic energy release distribution (KERD) peaks far away from zero the ion TOF distribution will not longer be Gaussian. In the case of a single non-zero KER the ion TOF distribution will be rectangular. In this situation the non-thermal KER has to be calculated from Eq. (2) instead of Eq. (1) [27].
where W0 is the full width of the rectangular ion TOF distribution. In the case of a quasi-rectangular ion TOF
distribution indicating a distribution of non-thermal KERs W0 has to be determined at the inflection points of the
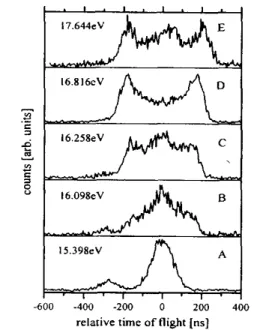
TOF distribution. In this case Eq. (2) gives the most probable kinetic energy released into the direction of the spectrometer axis, i.e. the peak in the kinetic energy release distribution (KERD). In order to determine the KER in the F loss reaction from fluoromethane ions we have measured the TOF distribution of the CH3+ ion as a
function of the excitation energy. Some typical TOF spectra are shown in Fig. 6 for photon energies between 15.398 and 17.644 eV. Besides from the CH3
+
ion (relative TOF: 0 ns) the spectra at low photon energy (Fig. 6A and Fig. 6B) also exhibit the CH2
+
ion (relative TOF: - 280 ns) formed by HF loss. This reaction channel does not play a major role at the higher photon energies as has been checked at higher draw out fields, i.e. improved mass resolution. Evidently the shape of the ion TOF distribution of the CH3
+
ion changes dramatically for the series of excitation energies shown. At low photon energy (Fig. 6A) a Gaussian peak shape is observed. With increasing photon energy the width of this Gaussian distribution increases. At 16.098 eV (see Fig. 6B) the peak seems to consist of two contributions. The outer part is almost rectangular but in the center the tip of a Gaussian distribution is still observed. At 16.816 eV (Fig. 6D) a Gaussian distribution is no longer discernible in the spectrum. Only the remainder of a quasi-rectangular peak is observed. However, this peak exhibits a very pronounced dip at its center. In principle such a dip in the ion TOF distribution could be caused by an anisotropy in the ion dissociation. However, here the dip is most likely due to a severe kinetic energy discrimination of the corresponding ions. According to simple TOF calculations daughter ions will not be detected in this experiment if their initial velocity vector is perpendicular to the spectrometer axis and if the total KER is larger than 300 meV. They hit a spectrometer lens before getting to the detector. This picture is supported by an experiment in which the kinetic energy discrimination is significantly reduced by the use of a refocus-ing ion lens. Under these conditions the dips in the ion TOF distributions almost vanish. The important point is that daughter ions formed with high kinetic energy reach the detector only if the angle between the initial velocity vector and the spectrometer axis is small. The two maxima in these TOF distributions are commonly referred to as the forward and backward scattered ions. At the highest photon energy displayed in Fig. 6E (17.644 eV) the peak shape changes again. Now a central Gaussian peak is again observed together with the outer rectangular part of forward and backward scattered ions. In the analysis of these kinetic energy release data we have adopted the following procedure. All ion TOF distributions below 16 eV appear to have a Gaussian shape. This indicates that the corresponding KER is thermal and thus Eq. (1) is operative. Above 16 eV the quasi-rectangular shape of the outer part of the ion TOF distribution indicates that this part of the KER is non-thermal. Therefore we have
applied Eq. (2), i.e. the width of the peak at half the maximum has been translated to a KER value. Since the TOF distributions are not perfectly rectangular there is probably not a single non-thermal KER but rather a distribution of non-thermal KERs. The average total kinetic energy released in the F loss reaction is plotted as a Fig. 6. TPEPICO-TOF spectra for the CH3
+
ion (relative TOF: 0 ns) at different photon energies. Note the change in the peak shape. The spectra A and B also exhibit the CH2
+
ion (relative TOF: - 280 ns) caused by the HF loss reaction.
function of the photon energy in Fig. 7. Since two different procedures have been applied for the data analysis as outlined above we have also used two different symbols for the data representation (see figure caption). In the analysis of the non-thermal TOF distributions we have taken into account a possible contribution from the thermal translational energy of the parent ions. However, since the total translational energy of the parent ions is about 39 meV (300 K) this contribution is almost negligible compared to the total KER which is on the order of a few eV. The accuracy in the determination of the non-thermal KER is mainly limited by the determination of the inflection point. Clearly our TOF distributions show the influence of angular discrimination. In this situation we decided to base our analysis on the width at half the maximum of the TOF distributions. The error bars given in Fig. 7 for the non-thermal KER cover the range between 10% and 90% of the maximum signal. The ultimate goal would be the complete calculation of the TOF distributions. However, given the signal to noise ratio of the experimental data and the changing ratio of thermal and non-thermal contribution to the TOF signal the enormous effort of such calculations does not seem to be justified for the time being.
Fig. 7. Total average kinetic energy release (KERtot) for the F loss reaction from CH3F+. The symbols represent
experimental data; (●) analysed by Eq. (1); (■) analysed by Eq. (2). The straight line is the maximum KER possible, the dotted line is the statistically expected KER based on Eq. (3).
The experimental KER data can be compared to two different models. The KER observed in the statistical dissociation of ions in their ground state is in general well described by a model given in Eq. (3). According to this model [28] the excess energy in the microcanonical ensemble of dissociating molecules, i.e. the internal energy above the dissociation threshold is distributed statistically over the degrees of freedom of the products taking into account the constraints of energy and angular momentum conservation.
Here Eexc is the excess energy above the threshold of 14.51 eV, kT# is the translational energy of the
products (i.e. the total average KER), r is the number of rotations of the products and vi are the vibrational
frequencies of the products. In the calculation of the statistically expected KER we have used the following set of frequencies for the CH3+ ion: 1403 cm-1 (A2"), 1413 cm-1 (E'), 3145 cm-1 (A1'), and 3225 cm-1 (E'). These
frequencies were calculated by the GAUSSIAN92 ab initio program [29] at the MP2/6-31G* level of computation (geometry optimization and frequency calculation at the same level) and scaled by a factor of 0.96 [30]. The total average KER has been calculated by numerical solution of Eq. (3). This statistical KERtot is
plotted in Fig. 7 as a dotted line. In the energy range between 14.51 eV, i.e. the threshold, and about 16 eV both the experimental and the statistically expected KER increase slowly. However, the experimental data are consistently higher than the calculated data. At this point we can not unambiguously explain the origin of this discrepancy. The kinetic energy release distributions (KERD) [14] which have been measured for electron impact ionization between 14.5 and 16 eV appear to be perfectly thermal with the peak of the distribution at zero kinetic energy. A further contribution to the understanding of this discrepancy could come from the measurement of the KERD of ions energy selected in a PEPICO experiment. This experiment has not yet been performed to our knowledge. Above 16 eV the experimental KER increases steeply and becomes significantly larger than expected on the basis of the statistical calculation. It is important to point out that this deviation from the statistically expected KER coincides with the change in the shape of the ion TOF distribution. At this point the experimental KER should be compared to the maximum KER possible at a given photon energy. This maximum KER is determined by the difference between the photon energy and the appearance energy of the process under consideration, i.e. it is equal to the excess energy in the parent ion. This maximum KER possible is also plotted in Fig. 7 as a straight line. Very interestingly the experimentally observed KERtot reaches about 90% of the
maximum KER possible in the range between 16 and 17 eV. This does in fact characterize the dissociation from a repulsive state. In this case the origin of this non-statistical KER is most likely the first excited A state of the fluoromethane ion. As mentioned earlier the molecular orbital from which the electron is removed in forming the A state of the ion has predominantly C-F bonding character.
The question remains what is the onset of this excited state. It is evident from our ion TOF spectra (Fig. 5) that the statistical and the non-statistical KER are both observed in the region between 16 and 16.3 eV. This is probably also the case for photon energies just below 16 eV. However, it is less obvious. In the analysis of the KER data we had to make a decision whether KER Eq. (1) or (2) should be applied in the transition region. Since the signal to noise ratio was too small we did not want to apply a combination of both equations to our KER data. For photon energies above 16 eV the peak shape has clearly rectangular character in the outer wings. Thus Eq. (2) applies. It has to be emphasized that the attempt to analyse data points above 16 eV by Eq. (1) results in a KERtot of about 4 eV. However this result is physically not possible since the energy available for KER is only 2
eV e.g. at 16.51 eV. Therefore there is no doubt that Eq. (2) is appropriate above 16 eV. Below 16 eV on the other hand the peak shape of the CH3+ is reasonably well described by a Gaussian function and thus Eq. (1) was
applied. It has to be pointed out that data analysis by Eq. (2) instead would lead to smaller KERtot values in this
case. The conclusion which emerges is that any data analysis different from the one which we have adopted and which we believe is appropriate would only lead to an even more pronounced increase in the total KER around 16 eV. At photon energies above 17.5 eV the experimental KER apparently does not further increase. At the same time the corresponding ion TOF spectra (e.g. Fig. 6E) seem to contain the contribution of a central peak indicating the recurrence of a thermal dissociation. Such a thermal dissociation could be due to the internal conversion of molecular ions from the A or possibly the B state to the ion ground state followed by a statistical dissociation. In order to obtain further information on this question we have also measured the ion TOF distributions employing a refocusing lens for the ions. This significantly reduces the effect of kinetic energy discrimination of the ions. Under these conditions the ion TOF distributions appear to be rectangular with no indication of a thermal contribution. For the time being we have not further considered the possibility of a recurring thermal dissociation. It should be noted that the Franck-Con-don factors for resonant ionization decrease above 17.5 eV since one approaches the end of the A and B bands in the TPES (Fig. 4B). The fact that the KER does not increase beyond about 2.5 eV could in principle be due to a kinetic energy discrimination of
the ion spectrometer in the spectrometer direction. However, TOF calculations show that this is not the case at the electric fields applied in this work. The KER observed above 17.5 eV is still considerably larger than the statistically expected one. Thus the F loss reaction is most likely formed from a repulsive state. It seems, however, that above 17.5 eV the excess energy available for distribution does not longer go entirely into translational energy of the products but partly into the vibrational and rotational degrees of freedom. It seems tempting to compare the recurrence of the thermal contribution around 17.5 eV to KERDs measured at 16.85 eV (Ne(I) and 21.22 eV (He(I)) [13]. There for the less energetic Ne(I) excitation the thermal part of the KERD extended to higher kinetic energies than for the higher energetic He(I) excitation. In the latter case the thermal part of the KERD might be dominated by ions formed directly in the ground X state due to the Franck-Condon factors. For the Ne(I) experiment, however, the thermal part of the KERD might be caused by the dissociation of parent ions primarily formed in the A or B state but followed by fast internal conversion to the ground state from which a dissociation with a broader but still thermal KERD could occur. Again it seems rewarding to perform an experiment aimed at the KERD of energy selected ions.
4. Summary
The unimolecular reactions of the fluoromethane ion have been investigated by means of the threshold photoelectron photoion coincidence technique (TPEPICO) for the first time. The TPES exhibits a pronounced vibrational structure in the region of the X band. This vibrational structure has been assigned in agreement with He(I) PES from the literature [6]. Differences between the TPES and the PES do, however, exist due to the difference in the ionization mechanism. The excited A and B states of the fluoromethane ion are observed as a broad band in the TPES between 16 and 17.5 eV. From the TPES alone these two excited states cannot be distinguished. According to the literature the first excited A state is supposed to be repulsive while the second excited B state might be bound. The TPEPICO-TOF spectra have been recorded between the IP of the molecule (12.53 eV) and 20 eV. From these spectra the breakdown diagram was derived which allows us to determine the threshold energies for various fragmentation channels. In the order of increasing energy the appearance energies of CH2F+, CHF+, CH2+, CH3+, and CF+ are 13.2, 13.91, 13.93, 14.51, and < 17.7 eV respectively at 300 K. For
the H loss reaction we have been able to derive the 0 K dissociation energy of the ion with 0.84 eV. In general our AEs agree quite well with data reported in the literature. The AE of the CHF+ ion, i.e. the H2 loss reaction,
and of the CF+, i.e. formally H + H2 loss, have been determined for the first time. All threshold energies except
for the CF+ formation are observed below the first excited A state. Thus all thermochem-ically possible processes are in fact observed from the ion ground state.
The kinetic energy released in the F loss reaction from fluoromethane ions has been measured as a function of the internal energy of the parent ions. From the comparison of the experimental KER with the statistically expected KER calculated from Klots' model it is concluded that the F loss reaction proceeds statistically for excitation energies below about 16 eV. However, the experimental data are consistently higher than the calculated data. At photon energies above 16 eV the experimental KER increases very steeply reaching values which must be considered non-statistical. There the comparison of the experimental KER with the maximum KER possible at a given photon energy reveals that about 90% of the available energy is observed as transiational energy of the products for excitation energies between 16 and 17 eV. This implies that the fragments do not gain any vibrational energy from the dissociation process in this energy range. This situation in fact characterizes the non-statistical dissociation out of a repulsive state. The origin of this process is assigned to the first excited A state. Our assignment is further supported by the fact that the non-statistical KER coincides with the first part of the A band in the TPES. At excitation energies above 17 eV the experimental KER does not show a further increase. It can not unambiguously be ruled out that the KER is influenced by the second excited B state in this region. However, here at least part of the available excess energy obviously goes into internal energy of the products.
Acknowledgements
The authors would like to thank Dr. H.W. Jochims (Freie Universität Berlin) and Dr. H. Biel (University of Birmingham) for help with the preliminary fluorescence experiments. Financial support of this work by the BMFT is gratefully acknowledged.
References
[1] D.A. Fisher, C.H. Hales, W.C. Wang, M.K.W. Ko and N.D. Sze, Nature, 344 (1990) 513;R. Zellner and H. Sidebottom, Commun. Eur. Communities (Rept.) 1 (1994) 333.
[2] M.J. Molina and F.S. Rowland, Nature 249 (1974) 810.
[4] B.P. Pullen, T.A. Carlson, W.E. Moddeman, G.K. Schweitzer, W.E. Bull and F.A. Grimm, J. Chem Phys. 53 (1970) 768.
[5] C.R. Brundle, M.B. Robin and H. Basch, J. Chem Phys. 53 (1970) 2196.
[6] L. Karlsson, R. Jadrny, L. Mattsson, F.T. Chau and K. Siegbahn, Physica Scripta 16 (1977) 225. [7] V.H. Dibeler and R.M. Reese, J. Res. Natl. Bur. Std. 54 (1955) 127.
[8] D.C. Frost and C.A. McDowell, Proc. Roy. Soc. (London) A 241 (1957) 194. [9] S. Tsuda, C.E. Melton and W.H. Hamill, J. Chem. Phys. 41 (1964) 689.
[10] M. Krauss, J.A. Walker and V.H. Dibeler, J. Res. Natl. Bur. Std. 72A (1968) 281.
[11] J.H.D. Eland, R. Frey, A. Kuestler, H. Schulte and B. Brehm, Intern. J. Mass Spectrom. Ion Phys. 22 (1976) 155.
[12] R. Locht and J. Momigny, in: Photophysics, photoionisation and photochemistry, ed. F. Lahmani (Elsevier, Amsterdam, 1985) p. 171.
[13] J. Momigny, R. Locht and G. Caprace, Intern. J. Mass. Spectrom. Ion Phys. 71 (1986) 159. [14] R. Locht and J. Momigny, Intern. J. Mass. Spectrom. Ion Phys. 71 (1986) 141.
[15] R. Locht, J. Momigny, E. Rühl and H. Baumgärtel, Chem. Phys. 117 (1987) 305.
[16] T. Baer, in: Gas phase ion chemistry, Vol. 1, ed. M.T. Bowers (Academic Press, New York, 1979).
[17] T. Baer, J.A. Booze and K.-M. Weitzel, in: Vacuum ultraviolet photoionization and photodissociation of molecules and clusters, ed. C.Y. Ng (World Scientific, Singapore, 1991).
[18] M. Tsuji, T. Funatsu, H. Kouno and Y. Nishimura, J. Chem. Phys. 97 (1992) 8216. [19] T. Masuoka and I. Koyano, J. Chem. Phys. 95 (1991) 1621.
[20] K.-M. Weitzel, J. Mähnert and H. Baumgärtel, Ber. Bunsen-ges. Physik. Chem. 97 (1993) 134. [21] R. Spohr, P.M. Guyon, W.A. Chupka and J. Berkowitz, Rev. Sci. Instrum. 42 (1971) 1872. [22] W.C. Wiley and I.H. McLaren, Rev. Sci. Instrum. 26 (1955) 1150.
[23] G. Herzberg, Infrared and Raman spectra of polyatomic molecules (Van Nostrand Reinhold, New York, 1945) p. 315.
[24] K.-M. Weitzel, Chem. Phys. Letters 186 (1991) 490.
[25] S.G. Lias, J.E. Bartmess, J.F. Liebman, J.L. Holmes, R.D. Levin and W.G. Mallard, Gas phase ion and neutral thermochemistry, J. Phys. Chem. Ref. Data 17 (1988).
[26] R. Stockbauer, Intern. J. Mass Spectrom. Ion Phys. 25 (1977) 89. [27] J.L. Franklin, P.M. Hierl and D.A. Whan, J. Chem Phys. 47 (1967) 3148. [28] C.E. Klots, J. Chem. Phys. 58 (1973) 5364.
[29] M.J. Frisch, G.W. Trucks, M. Head-Gordon, P.M. W. Gill, M.W. Wong, J.B. Foresman, B.G. Johnson, H.B. Schlegel, M.A. Robb, E.S. Replogle, R.Gomperts, J.L. Andres, K. Raghavachari, J.S. Binkley, C. Gonzalez, R.L. Martin, D.J. Fox, D.J. Defrees, J. Baker, J.J.P. Stewart and J.A. Pople, GAUSSIAN92 (Gaussian, Inc. Pittsburgh PA, 1992).